


Category: Antarctic
Sea Ice Extent (Global Antarctic and Arctic) – Day 67 – 2019


Sea Ice Extent (Global Antarctic and Arctic) – Day 66 – 2019


Sea Ice Extent (Global Antarctic and Arctic) – Day 65 – 2019


Sea Ice Extent (Global Antarctic and Arctic) – Day 64 – 2019


Green Icebergs
Scientists May Soon Solve Century-Old Mystery of Green Icebergs
Most icebergs appear white or blue when floating in seawater, but since the early 1900s explorers and sailors have reported seeing peculiar green icebergs in certain parts of Antarctica.
The strange green icebergs have always baffled scientists, but now a new study suggests iron oxides in rock dust from Antarctica’s mainland are turning some icebergs green.
According to the study published in the Journal of Geophysical Research: Oceans, marine ice varies in color due to the “abundance of foreign constituents in the seawater,” particularly iron-oxide materials. Researchers formulated the theory after they detected “large amounts of iron” during a 2016 research trip to the Amery Ice Shelf in East Antarctica.
“Previously, dissolved organic carbon (DOC) had been proposed to be responsible for the green color,” authors Stephen Warren, Collin Roesler, Richard Brandt, and Mark Curran explained in the paper. “Subsequent measurements of low DOC values in green icebergs, together with the recent finding of large concentrations of iron in marine ice from the Amery Ice Shelf, suggest that the color of green icebergs is caused more by iron‐oxide minerals than by DOC.”
Iron is a key nutrient for phytoplankton, microscopic plants that form the base of the marine food web. But iron is scarce in many areas of the ocean. If the researchers’ theory is confirmed, it would mean green icebergs are ferrying precious iron from Antarctica’s mainland to the open sea when they break off, providing this key nutrient to the organisms that support nearly all marine life.
“It’s like taking a package to the post office,” Warren, a glaciologist at the University of Washington and lead author of the study, said in a statement. “The iceberg can deliver this iron out into the ocean far away, and then melt and deliver it to the phytoplankton that can use it as a nutrient.”
Warren had been studying the green iceberg phenomenon since 1988. He analyzed samples taken from a green iceberg near the Amery Ice Shelf and found they were not made from regular glacier ice, but from marine ice, which is ocean water frozen to the underside of an overhanging ice shelf.

Seawater sometimes freezes to the underside of ice shelves, creating a layer of what’s called marine ice. (Credit: AGU)
When an oceanographer testing an ice core from Amery Ice Shelf found marine ice near the bottom of the core had nearly 500 times more iron than the glacial ice above, Warren began to suspect iron oxides in the marine ice could be turning blue ice green.
Warren believes iron oxides in “glacial flour,” a powder created when glaciers grind against bedrock, from rocks on Antarctica’s mainland are responsible for creating the stunning emerald icebergs. He now wants to to sample icebergs of different colors for their iron content and light-reflecting properties (icebergs are usually blue in color, because the ice absorbs more red light than blue light).
If their theory proves correct, green icebergs could be more important than scientists thought.
Sea Ice Extent (Global Antarctic and Arctic) – Day 63 – 2019


Sea Ice Extent (Global Antarctic and Arctic) – Day 62 – 2019


UK Antarctic meteorite hunt bags large haul
Space rocks!
The first British-led expedition to gather meteorites in the Antarctic has returned with a haul of 36 space rocks.
Manchester University’s Dr Katherine Joy was dropped in the deep field with British Antarctic Survey guide Julie Baum for four weeks.
The pair spent their days near the Shackleton mountains running across the ice sheet in skidoos looking for out-of-place objects.
The meteorites ranged from tiny flecks to some that were as big as a melon.
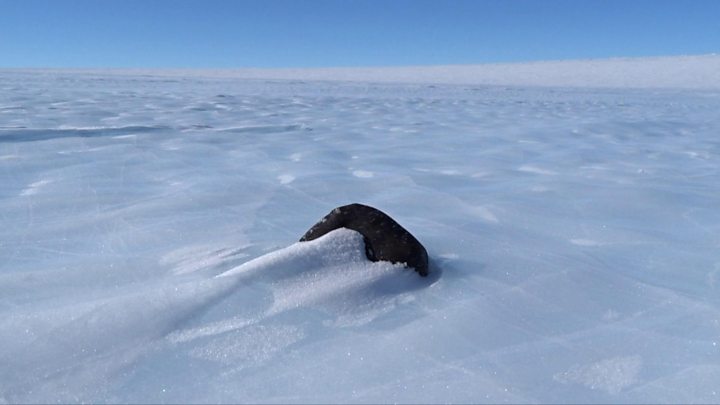
Some two-thirds of the meteorites in the world’s collections have been picked up in the Antarctic. It’s the contrast of black on white that makes the continent such a productive hunting ground.
“As soon as you spot a black rock you know. You dart towards it and your heart picks up a beat,” Dr Joy told BBC News.
“They look black because they’re burnt up as they come down through Earth’s atmosphere. They have a very characteristic exterior colour, and they have a kind of cracked surface where that exterior has expanded and contracted during the violent atmospheric entry.”
Read the rest
Antarctic Minimum Approaching – Day 59 – 2019
This post may seem familiar.
The most current Antarctic Sea Ice Extent data is from day 61.
I thought day 49 was the minimum. I was wrong. It may be day 59 … and I could still be wrong.
Antarctic minimum is approaching (or may have occurred) 2017 and 2018 were lowest minimums. 2019 is 7th lowest (although that may change a bit).
That kind of oscillation is “normal” and getting larger. The oscillation graph is just Day 99 but thats close to the normal day of min.

| Year | Min | Max | day of Max | day of Min | Avg Anomaly |
| 2017 | 2.08 | 18.145 | 282 | 60 | -0.904021753581 |
| 2018 | 2.15 | 18.222 | 273 | 49 | -0.715287507005 |
| 1997 | 2.264 | 18.792 | 265 | 58 | -0.262895726184 |
| 1993 | 2.281 | 18.71 | 263 | 50 | -0.233008054951 |
| 2011 | 2.319 | 18.954 | 266 | 53 | -0.152375178238 |
| 1984 | 2.382 | 18.37 | 266 | 58 | -0.20397636284 |
| 2019 | 2.444 | 59 | |||
| 2006 | 2.487 | 19.36 | 264 | 51 | -0.192035452211 |
| 1992 | 2.492 | 18.467 | 255 | 54 | -0.241630203122 |
| 1980 | 2.521 | 19.092 | 267 | 57 | -0.390551802967 |
| 1991 | 2.554 | 18.671 | 273 | 58 | -0.108073808375 |
| 2000 | 2.582 | 19.159 | 272 | 49 | 0.106979086495 |
| 1996 | 2.597 | 18.831 | 267 | 56 | 0.12888072584 |
| 1985 | 2.602 | 18.931 | 254 | 50 | -0.045367912714 |
| 2016 | 2.616 | 18.581 | 242 | 48 | -0.438132935363 |
| 1988 | 2.639 | 18.785 | 277 | 55 | -0.142789879716 |
| 2009 | 2.671 | 19.299 | 267 | 53 | 0.395643999844 |
| 1981 | 2.694 | 18.856 | 261 | 51 | -0.210032677284 |
| 2002 | 2.697 | 18.116 | 252 | 51 | -0.4313395618 |
| 1999 | 2.707 | 18.981 | 273 | 51 | 0.107734410803 |
| 1989 | 2.723 | 18.274 | 266 | 51 | -0.227268328923 |
| 2007 | 2.723 | 19.086 | 272 | 50 | 0.034159068337 |
| 1998 | 2.772 | 19.244 | 258 | 56 | 0.085424821762 |
| 1990 | 2.784 | 18.379 | 273 | 53 | -0.24335326043 |
| 2005 | 2.804 | 19.295 | 272 | 49 | 0.041931671077 |
| 2010 | 2.842 | 18.998 | 249 | 47 | 0.453843999844 |
| 1983 | 2.843 | 18.811 | 263 | 55 | -0.256928852148 |
| 1982 | 2.89 | 18.55 | 246 | 54 | -0.021131648978 |
| 1979 | 2.911 | 18.361 | 256 | 48 | 0.039939779594 |
| 1986 | 2.953 | 18.027 | 261 | 65 | -0.555519016082 |
| 1987 | 3.01 | 18.524 | 258 | 52 | -0.249198161098 |
| 1994 | 3.083 | 18.827 | 243 | 43 | 0.121022082036 |
| 2012 | 3.111 | 19.478 | 266 | 54 | 0.364189469009 |
| 2004 | 3.259 | 19.124 | 252 | 51 | 0.321249578299 |
| 1995 | 3.33 | 18.762 | 269 | 55 | 0.141808383406 |
| 2001 | 3.441 | 18.494 | 271 | 50 | 0.019676876556 |
| 2015 | 3.544 | 18.912 | 275 | 49 | 0.761153588885 |
| 2014 | 3.548 | 20.201 | 263 | 52 | 1.123178246419 |
| 2003 | 3.626 | 18.68 | 268 | 48 | 0.316339890255 |
| 2013 | 3.679 | 19.608 | 274 | 50 | 0.870657698474 |
| 2008 | 3.692 | 18.298 | 247 | 51 | 0.599159414364 |
