Sea Ice Extent (Global Antarctic and Arctic) – Day 96 – 2016

UPDATE 2: They updated the data, at 3:22 down to 5.786 (which is a 300,000 sq km drop from the day before. Not likely.

On day 96 the Antarctic sea ice extent took an unlikely jump from 6.082 million sq km to 7.959.

Sometimes they correct it the next day. Sometimes they don’t.

UPDATE: The “stuttering” in the daily Antarctic image. (Thanks AZ1971)

Antarctic_Sea_Ice


Global_Sea_Ice_Extent_Zoomed_2016_Day_96_1981-2010 Antarctic_Sea_Ice_Extent_Zoomed_2016_Day_96_1981-2010 Arctic_Sea_Ice_Extent_Zoomed_2016_Day_96_1981-2010


South / North

Sea Ice Extent (Global Antarctic and Arctic) – Day 95 – 2016

Change in the last 10 days Antarctic (blue is gain / red is melt):

2016 Antarctic Ice Loss or Gain Last 10 Days (Up To Day 95 )

Change in the last 10 days Arctic:

2016 Arctic Ice Loss or Gain Last 10 Days (Up To Day 95 )

Global

Global_Sea_Ice_Extent_Zoomed_2016_Day_95_1981-2010

Antarctic

Antarctic_Sea_Ice_Extent_Zoomed_2016_Day_95_1981-2010

Arctic

Arctic_Sea_Ice_Extent_Zoomed_2016_Day_95_1981-2010

South / North

Sea Ice Extent (Global Antarctic and Arctic) – Day 93 – 2016 (No Data Yet)

The data for day 93 has not been uploaded to the website. It is late.


South / North

PIOMAS – Arctic Sea Ice Volume Up From 2010

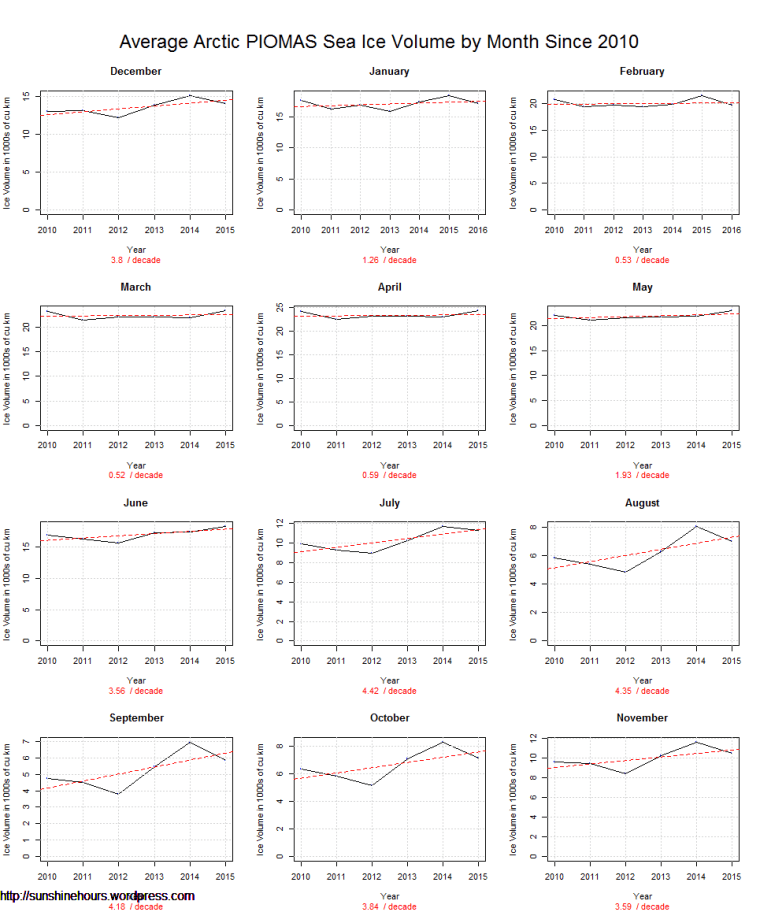
PIOMAS is: “Sea Ice Volume is calculated using the Pan-Arctic Ice Ocean Modeling and Assimilation System (PIOMAS, Zhang and Rothrock, 2003) developed at APL/PSC.  Anomalies for each day are calculated relative to the average over the 1979 -2014 period for that day of the year to remove the annual cycle.”

The PIOMAS daily data is up to the end of February 2016.

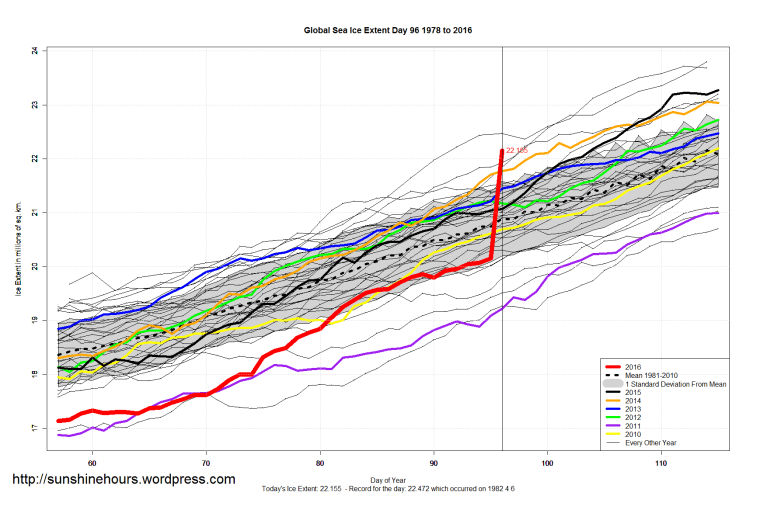
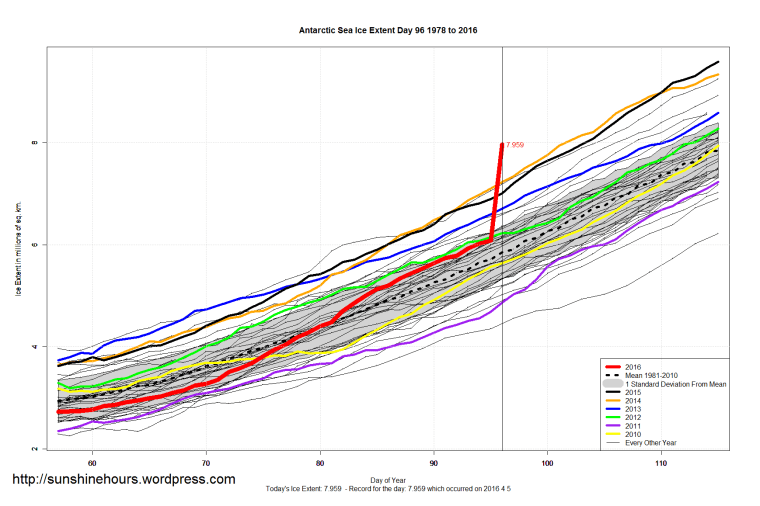
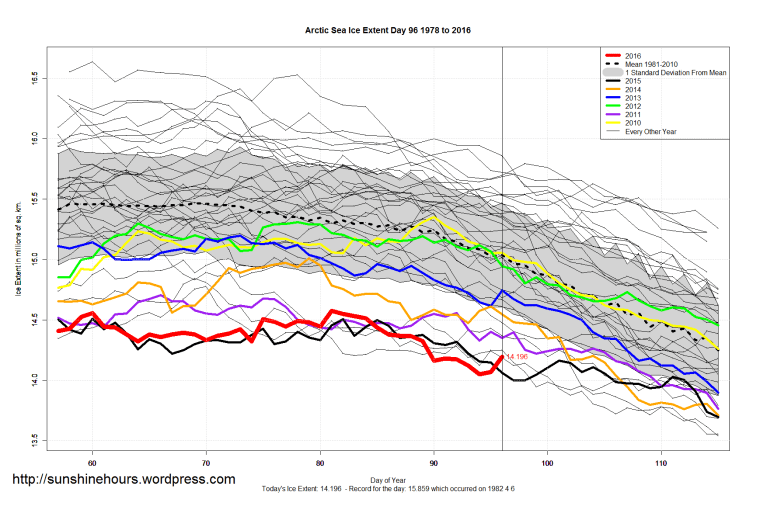
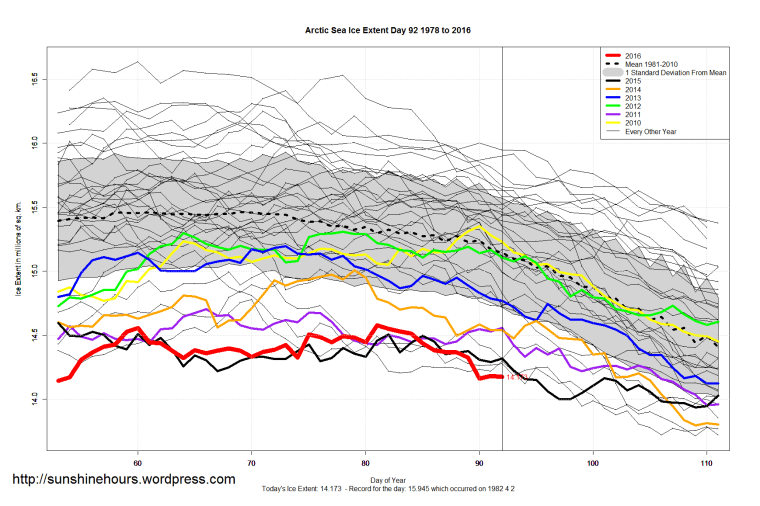
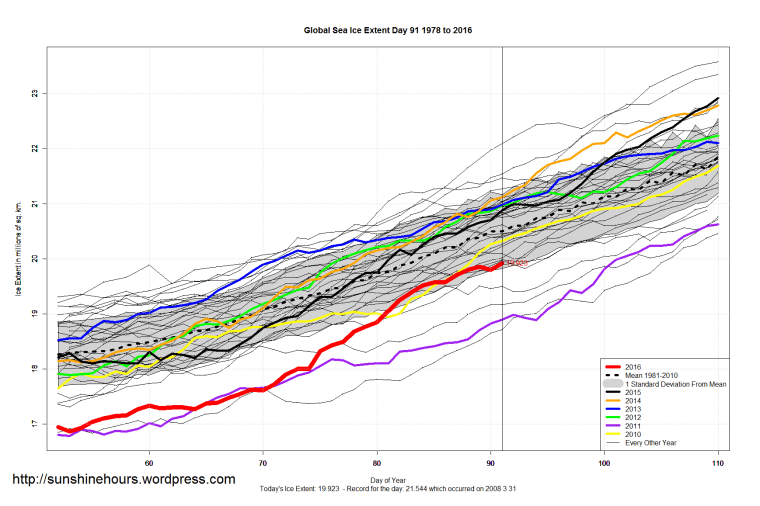
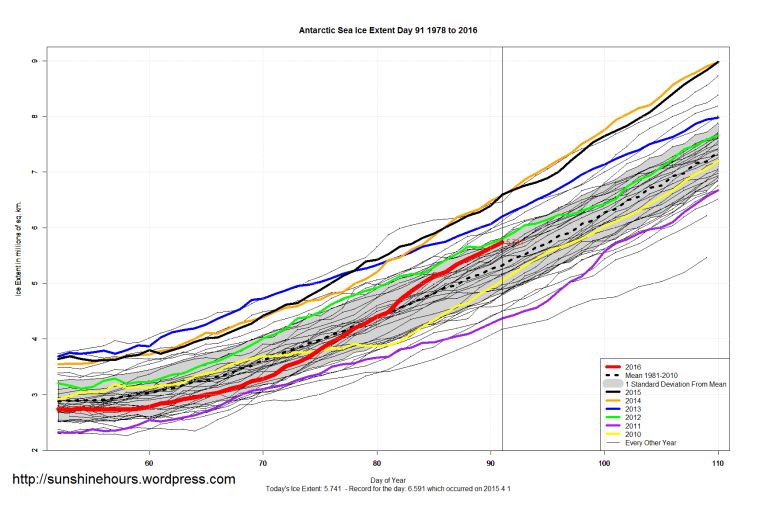
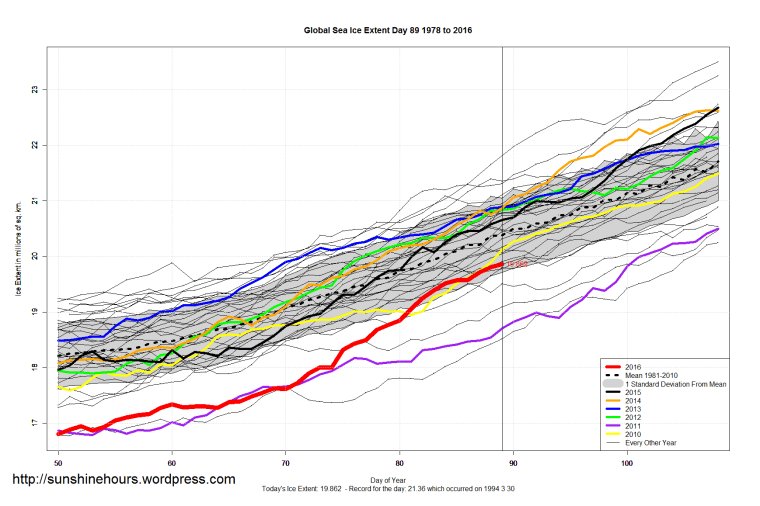
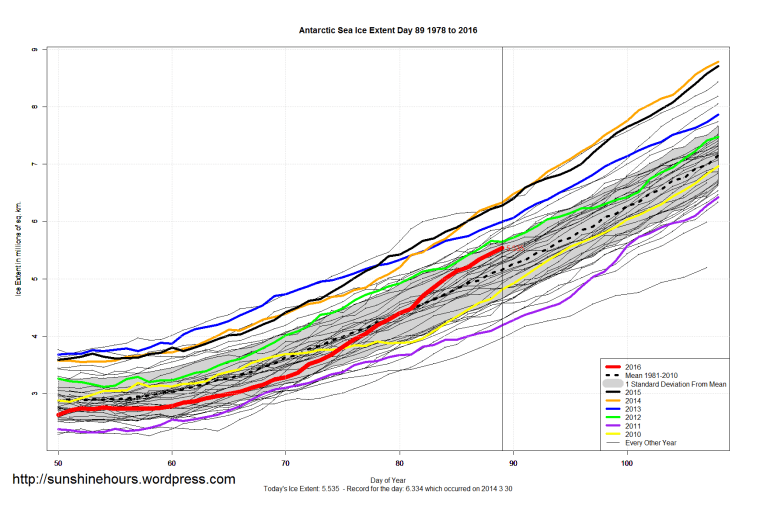
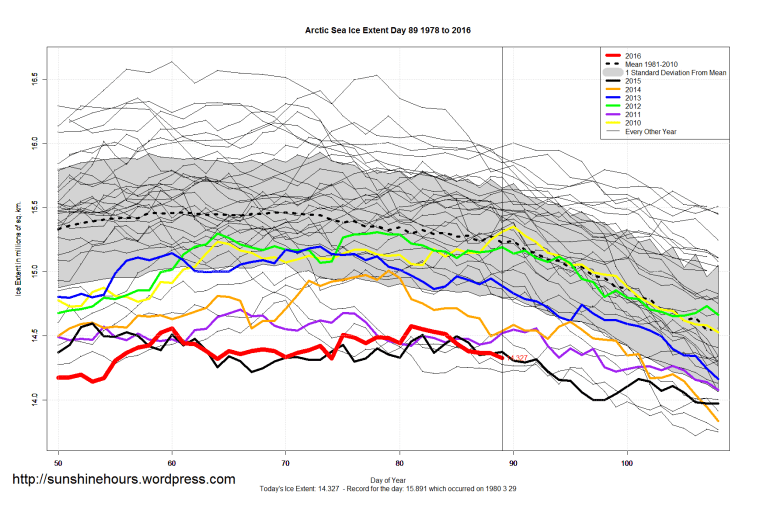
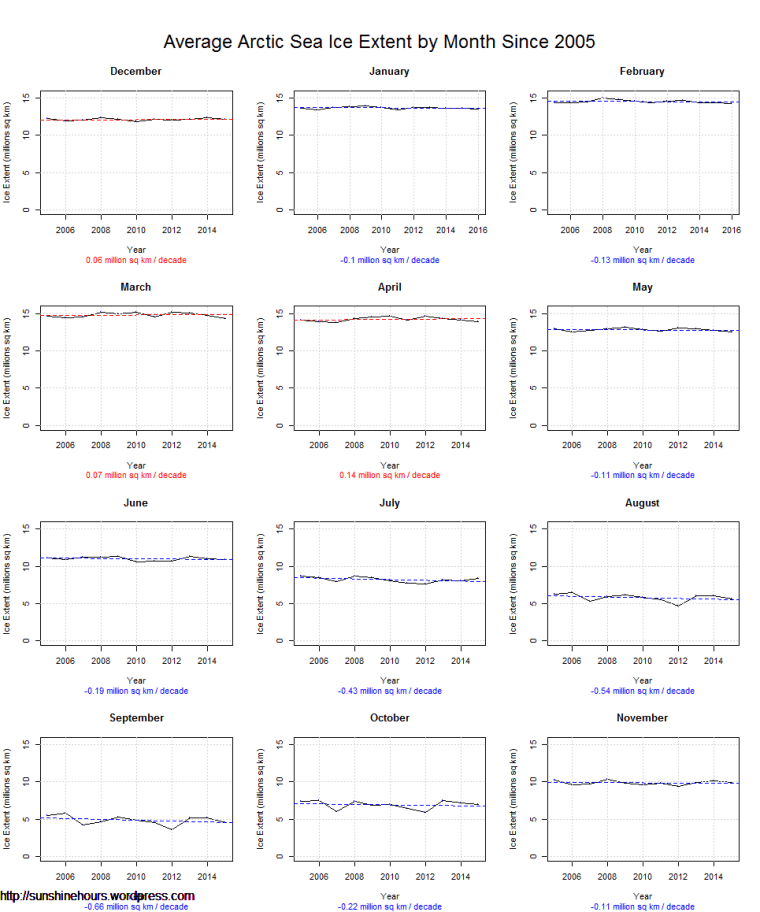
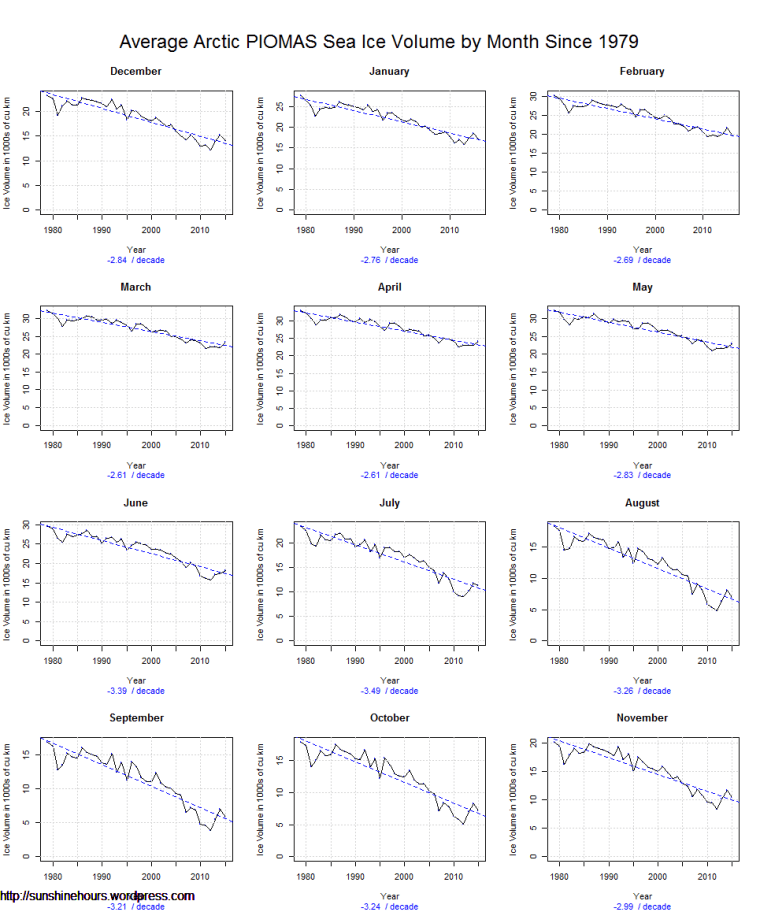
I post a lot of graphs about sea ice area and extent. Some of them show all the data. Some of them show data from 2005 because thats when the arctic sea ice extent trends levelled out.

PIOMAS also shows a leveling out, but not until 2010. I will show both the monthly graphs from 2010 and from 1979. (Click twice for larger) (Graph corrected due to incorrect units)


Average Arctic PIOMAS Sea Ice Volume by Month Since 2010


Average Arctic PIOMAS Sea Ice Volume by Month Since 1979


References:

Volume time series and uncertainties:
Schweiger, A., R. Lindsay, J. Zhang, M. Steele, H. Stern, Uncertainty in modeled arctic sea ice volume, J. Geophys. Res., doi:10.1029/2011JC007084, 2011

Model details:
Zhang, J.L. and D.A. Rothrock, “Modeling global sea ice with a thickness and enthalpy distribution model in generalized curvilinear coordinates“, Mon. Weather Rev., 131, 845-861, 2003


Arctic Sea Ice Extent Since 2005 With 0 Shown on Y Axis

Arctic Sea Ice Extent By Month from 2005 with 0 shown on the Y axis. Red line shows an increasing ice trend.

Does this look like doom for the Arctic to you?

Average Arctic Sea Ice Extent by Month Since 2005


The latest South / North