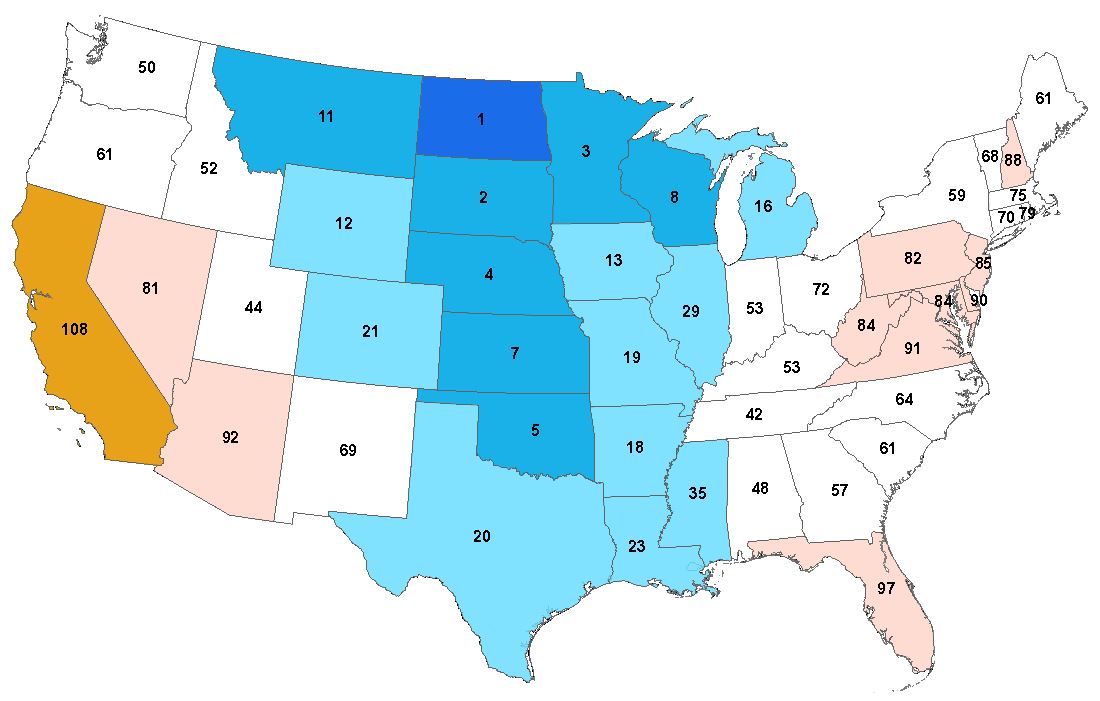
After looking at the national ranking (23rd coldest) it is time to look at the State data:
In the last 119 Aprils, it was the coldest April ever in North Dakota. 2nd coldest ever in South Dakota. 3rd coldest ever in Minnesota, 4th coldest ever in Nebraska, 7th coldest ever in Oklahoma, 8th coldest ever in Wisconsin.
North Dakota was 18.5F colder than the warmest April (which occurred in 1915).
26 out of 48 states had an April ranked below 60. Which means they were ranked in the bottom half of the 119 Aprils measured by the NOAA.
Only one state (California) had an April in the top 20.
| State | Apr 2013 Avg F | Apr Rank (1=Coldest) | Coldest Apr | Coldest Apr F |
| North Dakota | 31 | 1 | 2013 | 31 |
| South Dakota | 36.7 | 2 | 1920 | 35.6 |
| Minnesota | 33.9 | 3 | 1950 | 32.5 |
| Nebraska | 42.3 | 4 | 1920 | 38.9 |
| Oklahoma | 54.6 | 5 | 1983 | 53.2 |
| Kansas | 48.3 | 7 | 1983 | 46.9 |
| Wisconsin | 37.6 | 8 | 1950 | 35.2 |
| Montana | 37.7 | 11 | 1975 | 33.7 |
| Wyoming | 35.8 | 12 | 1920 | 32.2 |
| Iowa | 43.7 | 13 | 1907 | 40.1 |
| Michigan | 39.1 | 16 | 1907 | 35 |
| Arkansas | 58.4 | 18 | 1907 | 54.1 |
| Missouri | 51.8 | 19 | 1907 | 47.6 |
| Texas | 63.1 | 20 | 1997 | 59.7 |
| Colorado | 40.4 | 21 | 1920 | 34.3 |
| Louisiana | 64.5 | 23 | 1983 | 61.4 |
| Illinois | 49.8 | 29 | 1907 | 43.2 |
| Mississippi | 62.2 | 35 | 1983 | 58.4 |
| Tennessee | 56.9 | 42 | 1907 | 50.6 |
| Utah | 45.6 | 44 | 1975 | 39.9 |
| Alabama | 62.1 | 48 | 1901 | 57.4 |
| Washington | 46.7 | 50 | 1955 | 41.5 |
| Idaho | 42.5 | 52 | 1975 | 36.5 |
| Indiana | 50.7 | 53 | 1907 | 42.2 |
| Kentucky | 54.9 | 53 | 1907 | 46.9 |
| Georgia | 63.1 | 57 | 1901 | 57.4 |
| New York | 43.5 | 59 | 1943 | 36.8 |
| Maine | 39.3 | 60 | 1926 | 33.2 |
| South Carolina | 62.1 | 60 | 1901 | 55.1 |
| Oregon | 46.3 | 61 | 1975 | 40.1 |
| Oregon | 46.3 | 61 | 1967 | 40.1 |
| North Carolina | 58.5 | 63 | 1907 | 51 |
| Vermont | 41.9 | 66 | 1926 | 33.3 |
| Connecticut | 47 | 68 | 1943 | 40 |
| New Mexico | 52.3 | 68 | 1973 | 45.8 |
| Ohio | 50.4 | 71 | 1907 | 41.3 |
| Massachusetts | 46.2 | 75 | 1943 | 40.3 |
| Rhode Island | 47.1 | 79 | 1907 | 40.9 |
| Nevada | 48.5 | 80 | 1967 | 38.6 |
| Pennsylvania | 49 | 80 | 1943 | 41.6 |
| Maryland | 53.7 | 82 | 1907 | 45.9 |
| New Jersey | 51.5 | 83 | 1907 | 44.5 |
| West Virginia | 52.9 | 83 | 1907 | 44.4 |
| New Hampshire | 43.3 | 87 | 1926 | 34.6 |
| Arizona | 59.7 | 89 | 1975 | 50.6 |
| Virginia | 56.2 | 89 | 1907 | 47.1 |
| Delaware | 54.5 | 90 | 1907 | 46.4 |
| Florida | 71.4 | 97 | 1987 | 65.1 |
| Florida | 71.4 | 97 | 1901 | 65.1 |
| California | 59.9 | 108 | 1967 | 46.5 |