Climate Change Emergency Causes Droughts Flooding
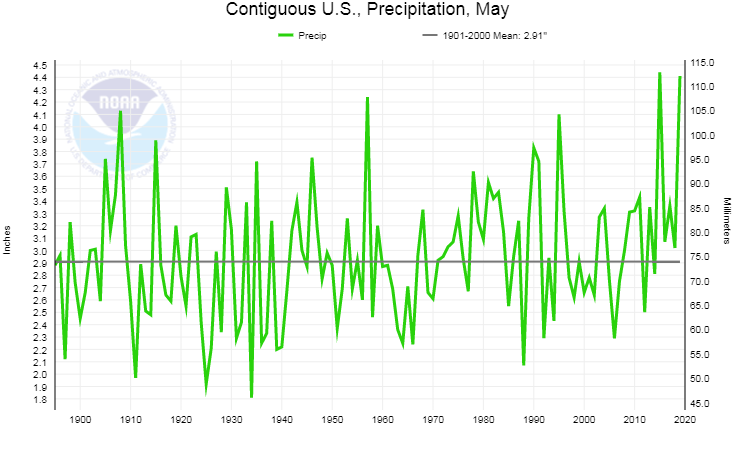
May 2019 – Second Wettest May in US history
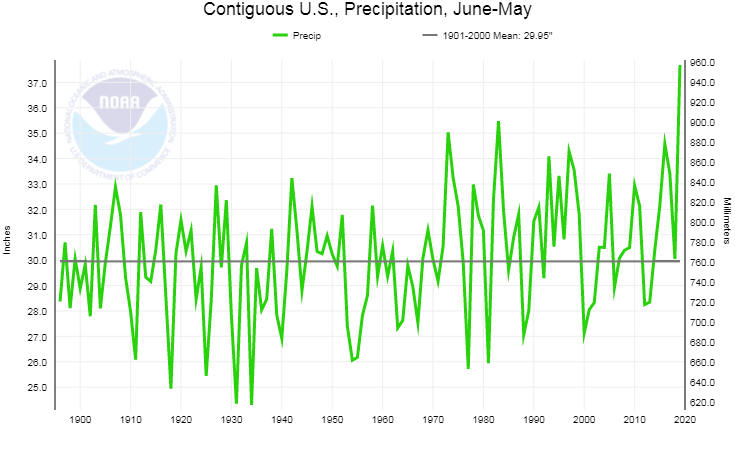
Wettest June to May (12 months) by 2.21 inches – All the dark green ones are state records.
May Average Temp – 0.7F below normal

Climate Change Emergency Causes Droughts Flooding
May 2019 – Second Wettest May in US history
Wettest June to May (12 months) by 2.21 inches – All the dark green ones are state records.
May Average Temp – 0.7F below normal
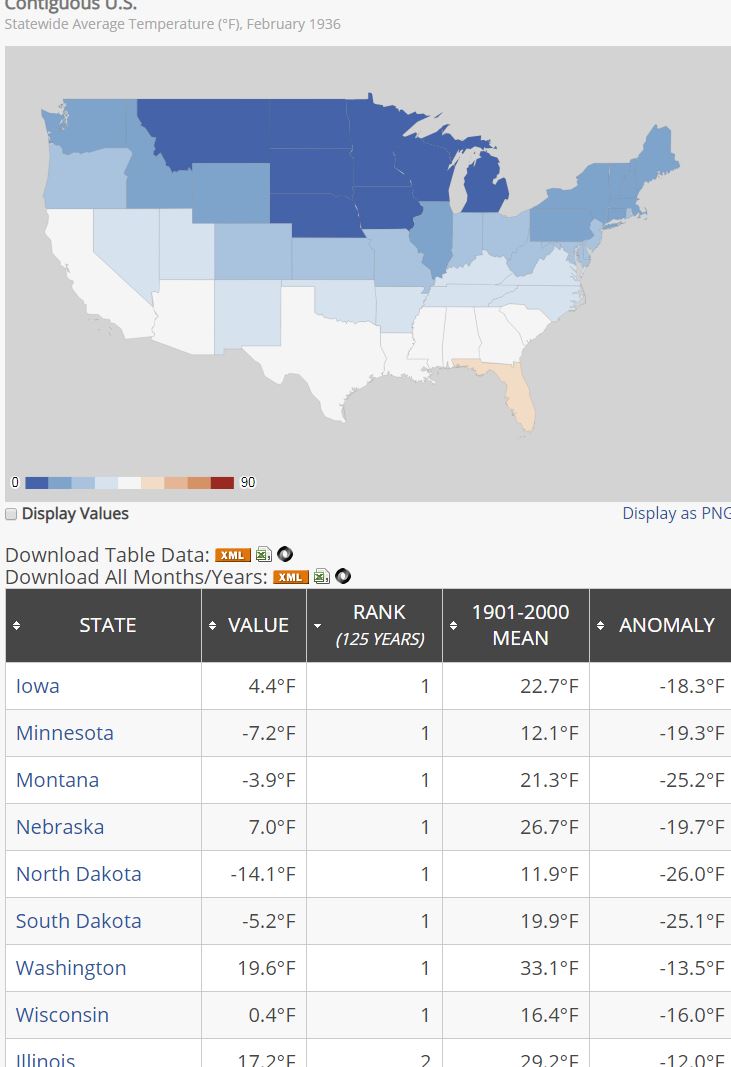
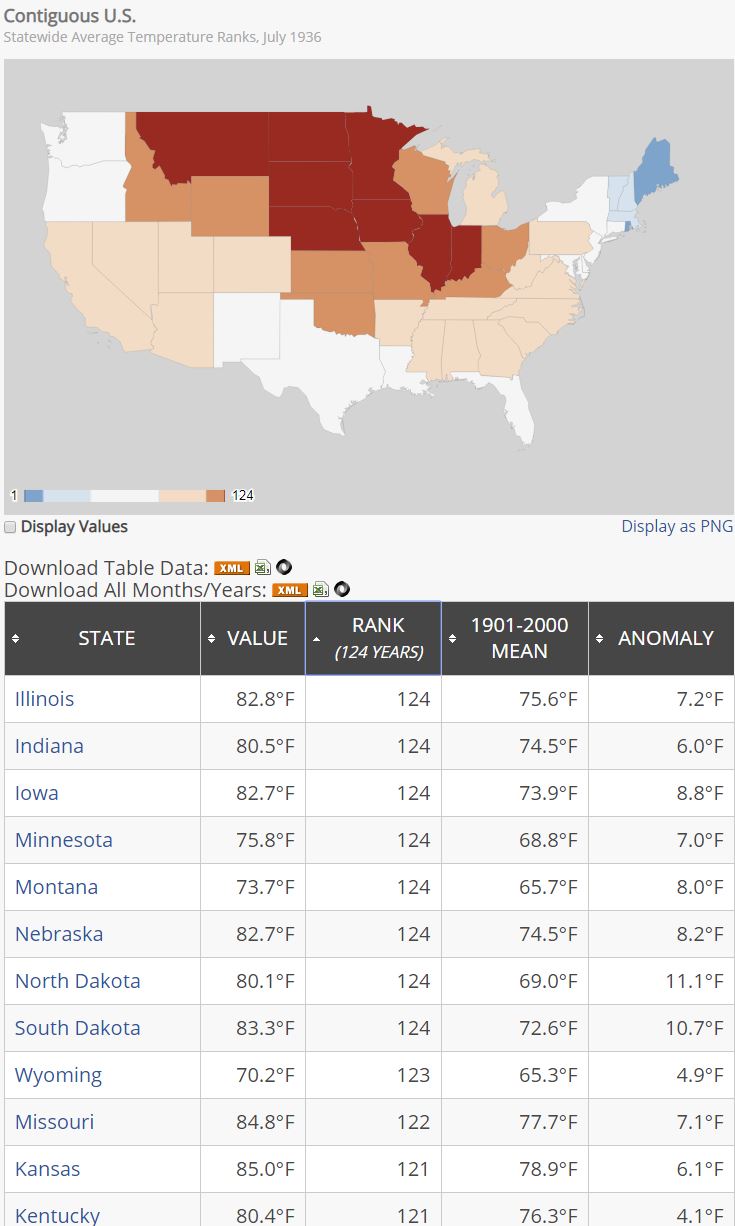
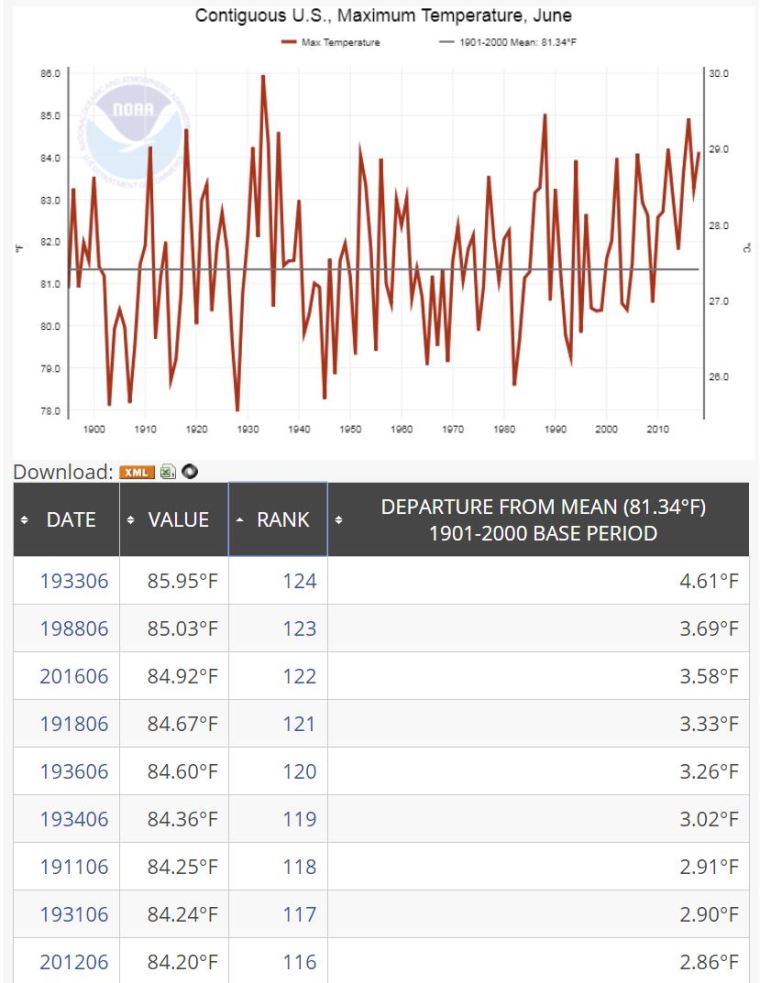
February 2019 Looks a lot Like February 1936 and thats bad because July of 1936 was so damn hot.

February 1936
July 1936 – 8 States Hottest and a bunch more in top 10.
According to the NOAA, Montana was -15.6F below the 1901-2000 mean
Norht Dakota was -14.8 below. South Dakota was -13.5F below.
Coldest February ever in Montana , South Dakota and North Dakota and 5 other states was 1936.
Feb 1936 looks very much like Feb 2019. I hope the summer of 2019 is not the same as the summer of 1936. That would be bad!!!!
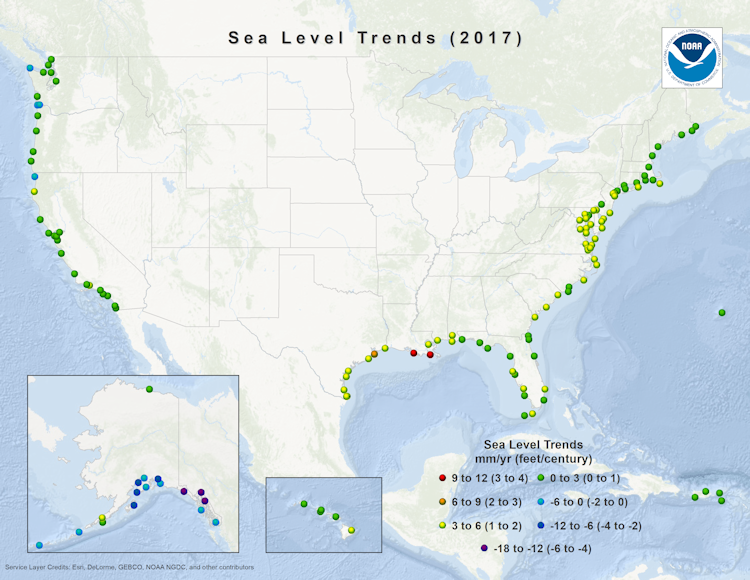
The NOAA has updated its tide gauge data for 2018 and says theaverage global sea level rise rate is 1.7-1.8 mm/yr.
Thats a measly 5.6 inches by 2100.
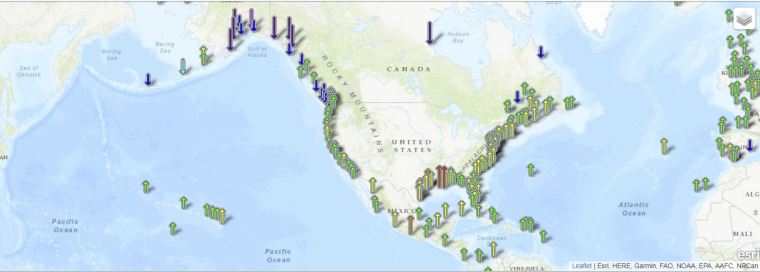
The map of relative sea level trends provides an overview of variations in the rates of local sea level change at long-term tide stations (based on a minimum of 30 years of data in order to account for long-term sea level variations and reduce errors in computing sea level trends based on monthly mean sea level).
The variations in sea level trends seen here primarily reflect differences in rates and sources of vertical land motion.
Areas experiencing little-to-no change in relative sea level are illustrated in green, including stations consistent with average global sea level rise rate of 1.7-1.8 mm/yr. These are stations not experiencing significant vertical land motion.
Stations illustrated with positive sea level trends (yellow-to-red) are experiencing both global sea level rise, and lowering or sinking of the local land, causing an apparently exaggerated rate of relative sea level rise.
Stations illustrated with negative trends (blue-to-purple) are experiencing global sea level rise and a greater vertical rise in the local land, causing an apparent decrease in relative sea level. These rates of relative sea level rise reflect actual observations and must be accounted for in any coastal planning or engineering applications.
July 2018 USA – 1936, 1934 and 1901 (tied with 2012) Are Still the Hottest (Maximum) in USA.
2018 is 19th. I’m using Maximum Temperature. Not Average.
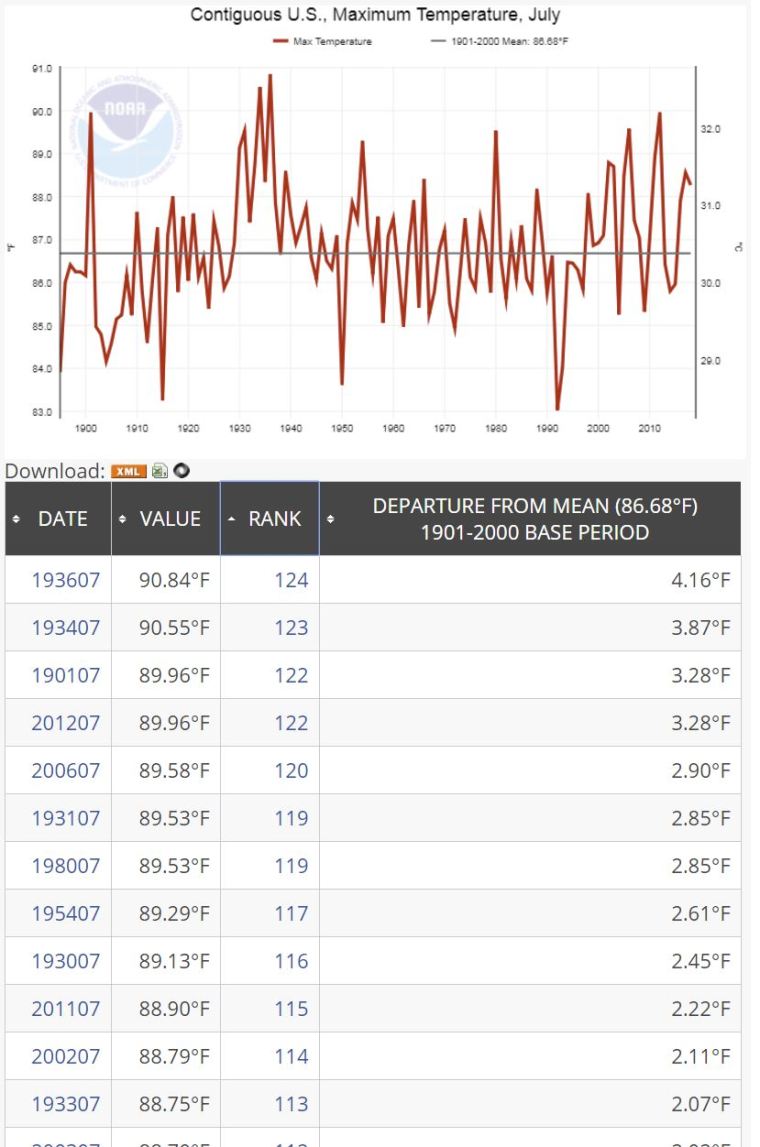
And by hottest i mean Maximum Temperature. Globalists use Average Temps because minimums are skyrocketing because of UHI.
Minimums for USA at bottom of this post.
Minimums
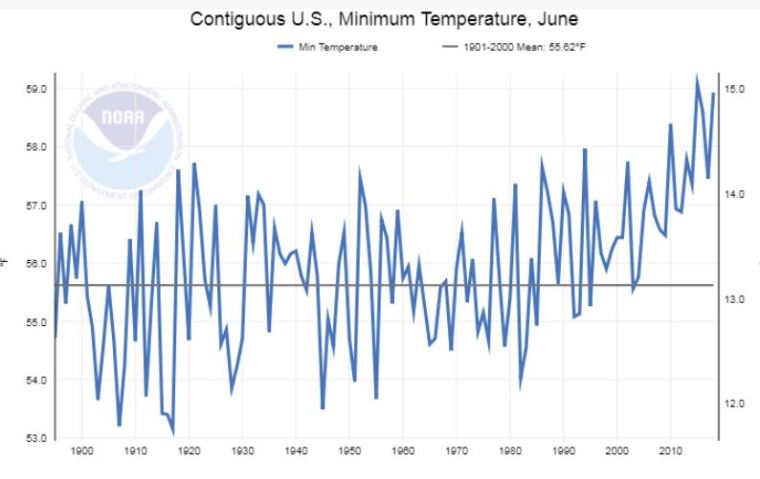
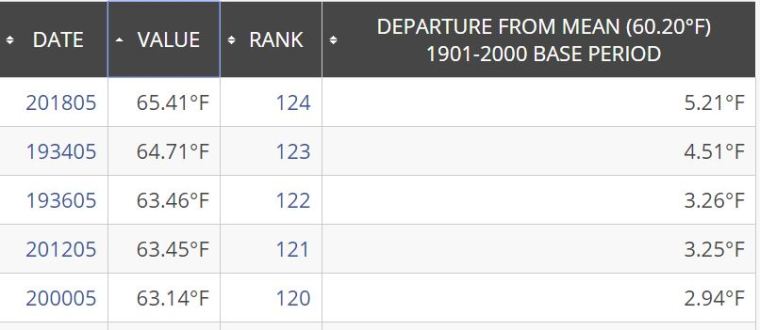
May 2018 in the USA was the highest average temperature for May.
May 2018 in the USA was 2nd highest maximum temperature for May.
May 1934 was highest max.
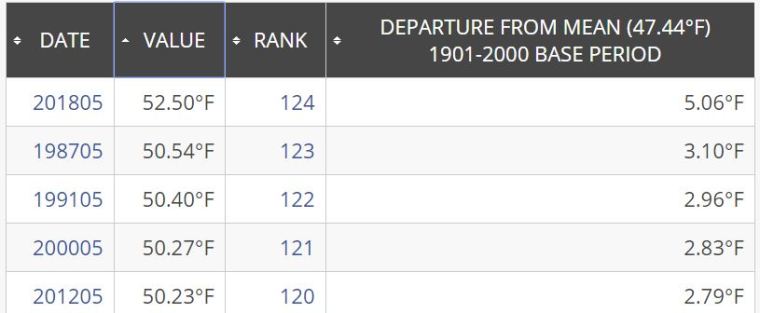
May 2018 in the USA was the highest minimum temperature for May.
Notice 1934, 1936 and 1939 in the top 5 max. And 1934 and 1936 in the top 5 avg.
Max

Avg
Min
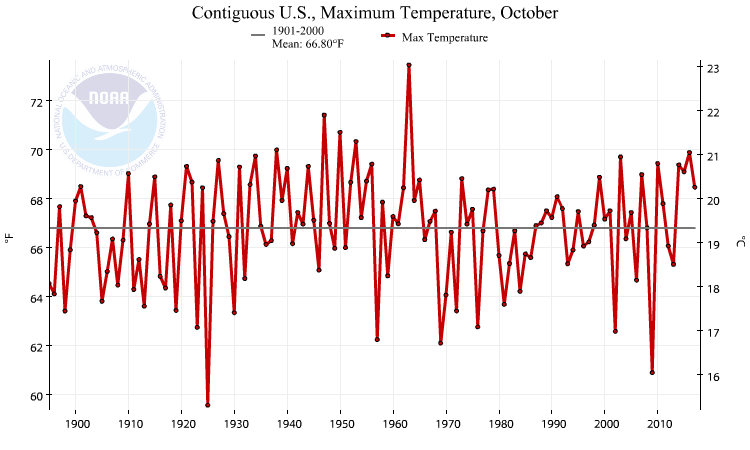
The hottest October in the USA was 1963. It was 5F hotter than October 2017.
Why Has CO2 Ignored October?
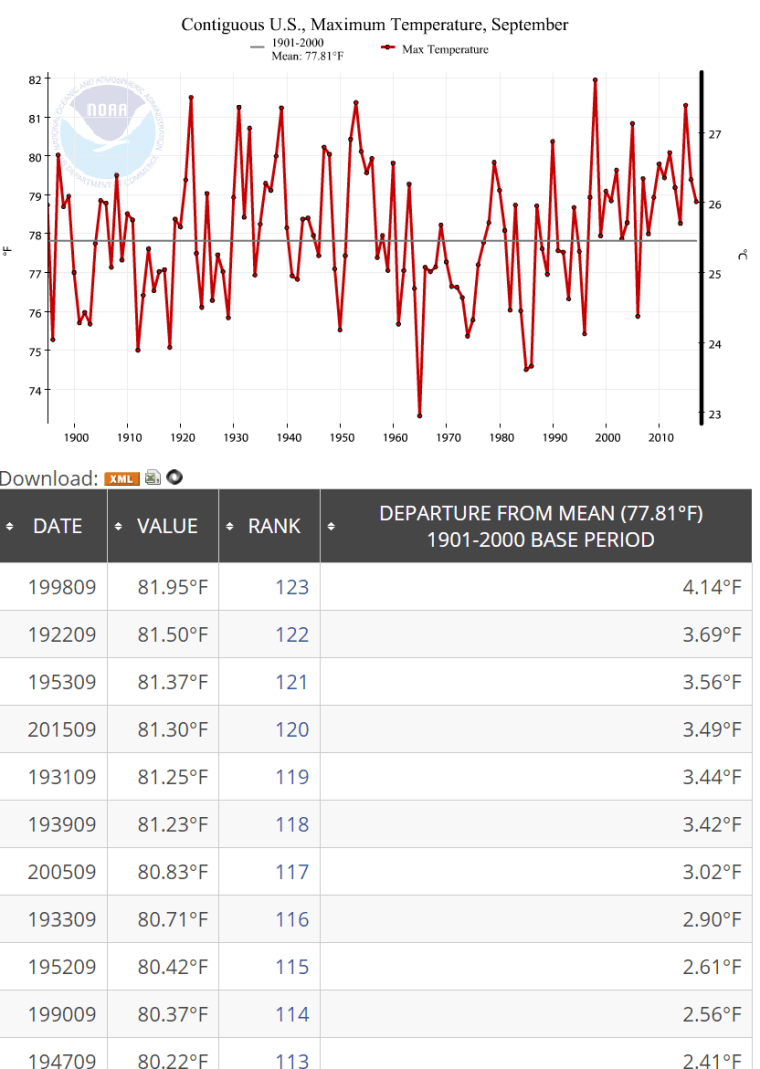
According to the NOAA, September 2017 ranked 83rd out of 123 using the Maximum temperature.
2017 was 3F colder than 1998.
The 10 warmest Septembers: 1998, 1922, 1953, 2015, 1931, 1939, 2005, 1933, 1952, 1990
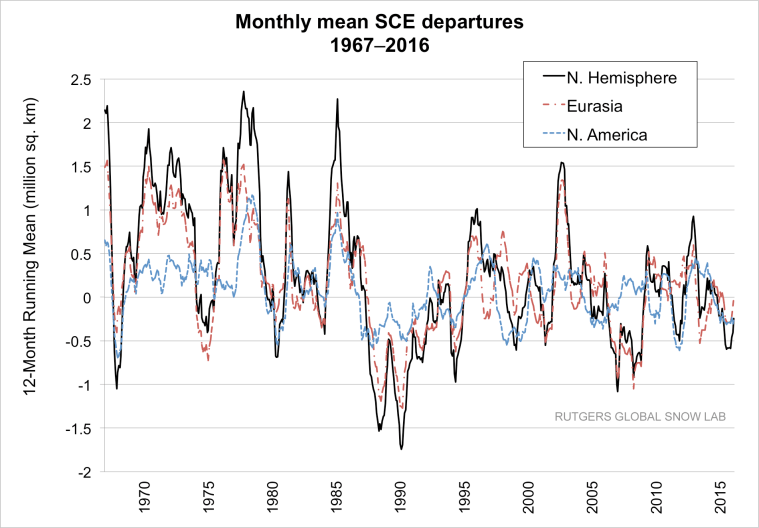
These graphs are NH only.
Its a pity Rutgers graphing script can’t spell Hemisphere.
But …
Fall up 1,500,000 sq km
Winter up 900,000 sq km
Spring down 3,000,000

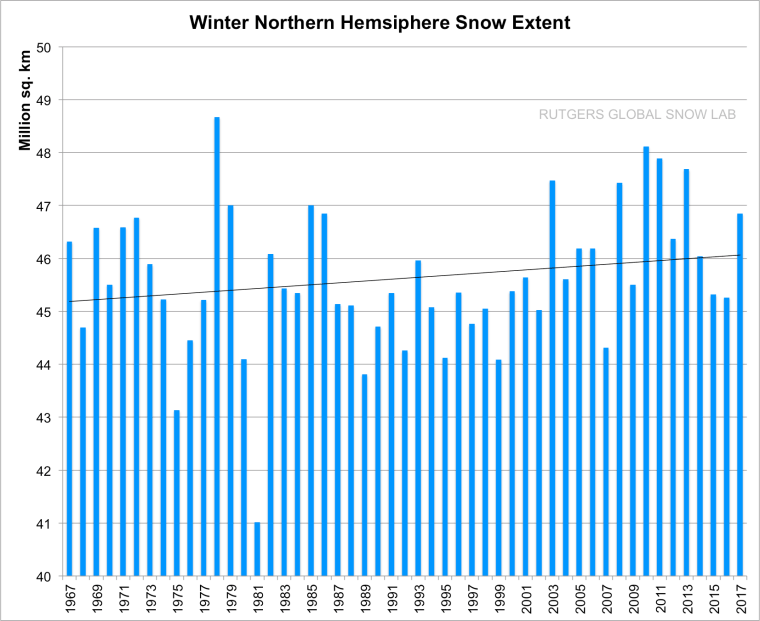
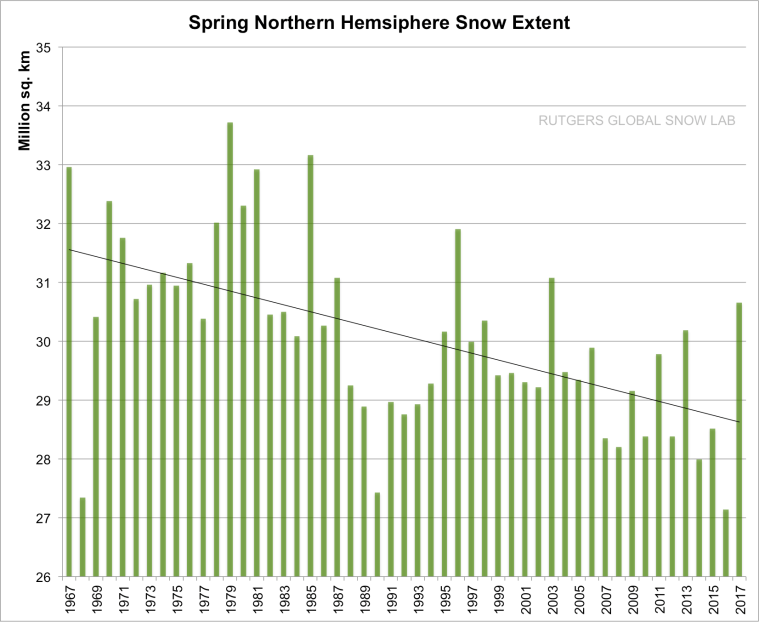
https://climate.rutgers.edu/snowcover/index.php
