If you graph the Arctic Sea Ice Extent anomaly % from the 30 year mean, 2013 has stabilized at -15%, above the -30% of 2011 and well above the -45% of 2012.
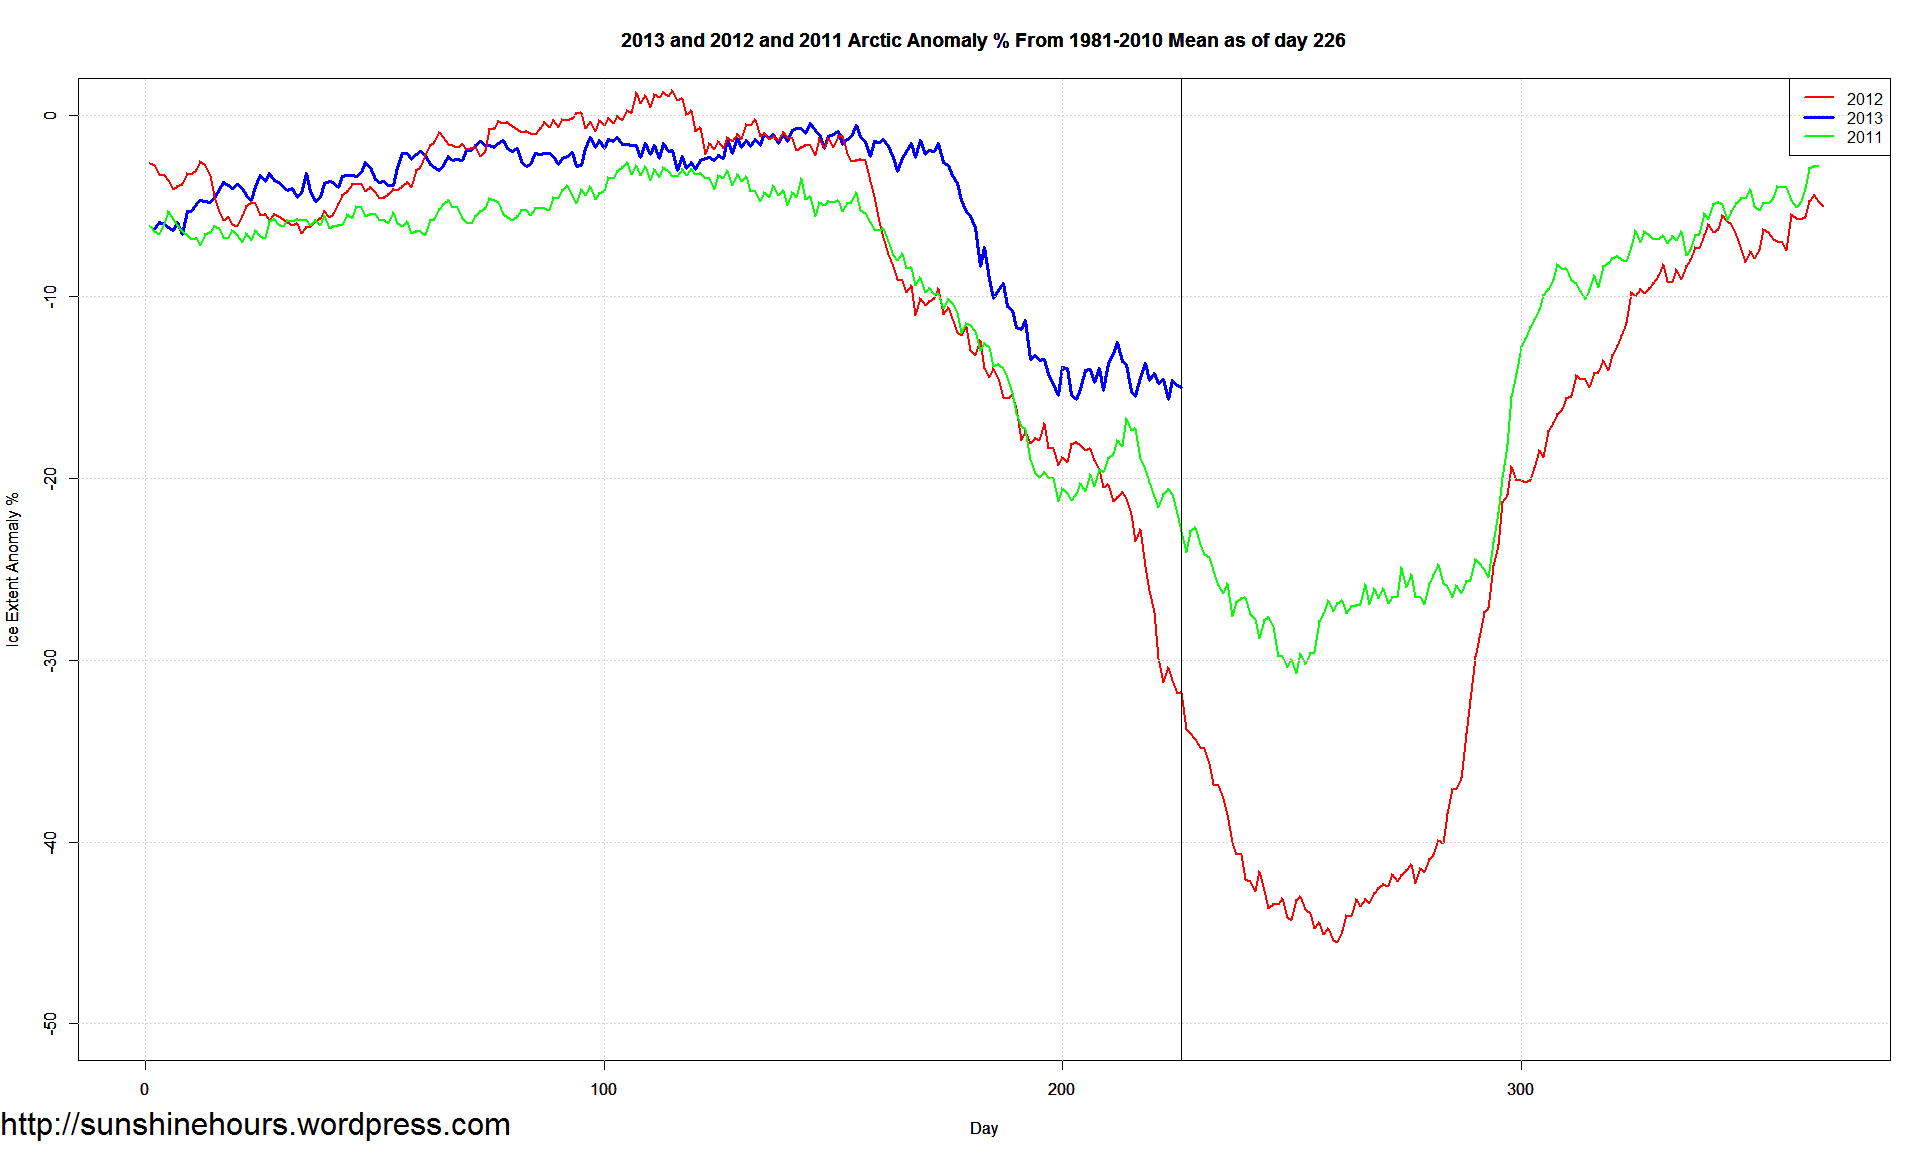
The difference between 2012 and 2013 is quite dramatic if you graph the anomaly % from the 30 year mean.
Until day 175 or so, the anomaly was only around -5% or so (note that the anomaly actually went positive for a few days in 2012).
While 2013 was later, both started drifting down. 2013 has stabilized at -15%. At this time last year 2012 was -30%.
Warmists must be so sad.

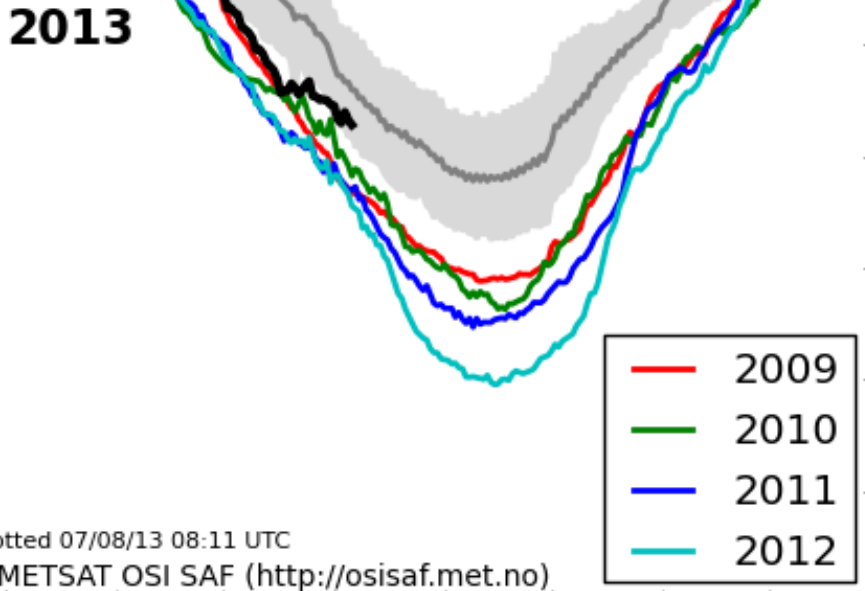
Arctic Sea Ice Extent Higher Than 2005 According to DMI
The red line is 2005. The thick black line is 2013.

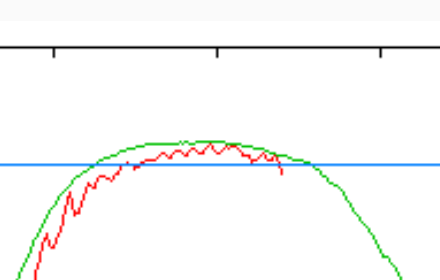
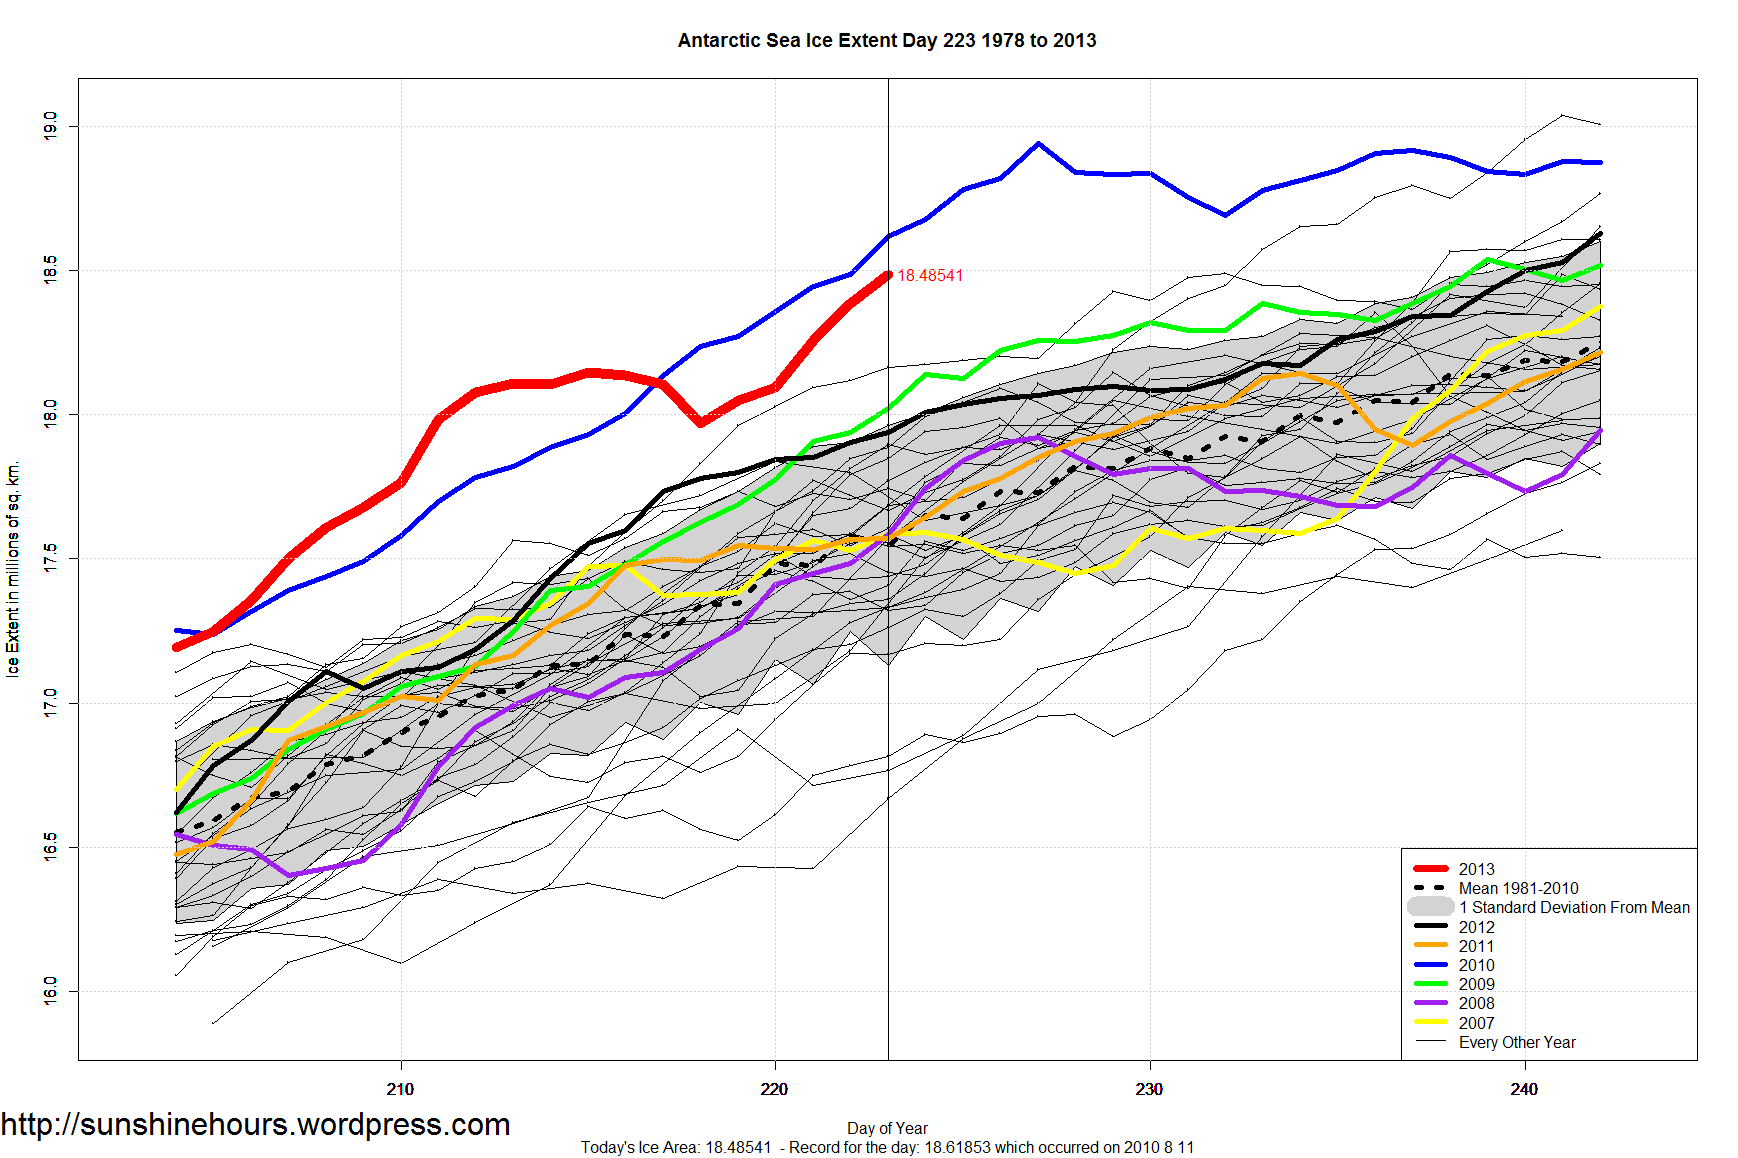
Day 223 in the Antarctic (August 12) has Antarctic Sea Ice Extent slowly closing on 2010’s record.
Day 223 is 1,000,000 sq km above the 30 year mean.
UPDATE and Apology: The headline said Antarctic. The blog post said Arctic. I rushed. Sorry. This blog post is about the Arctic.
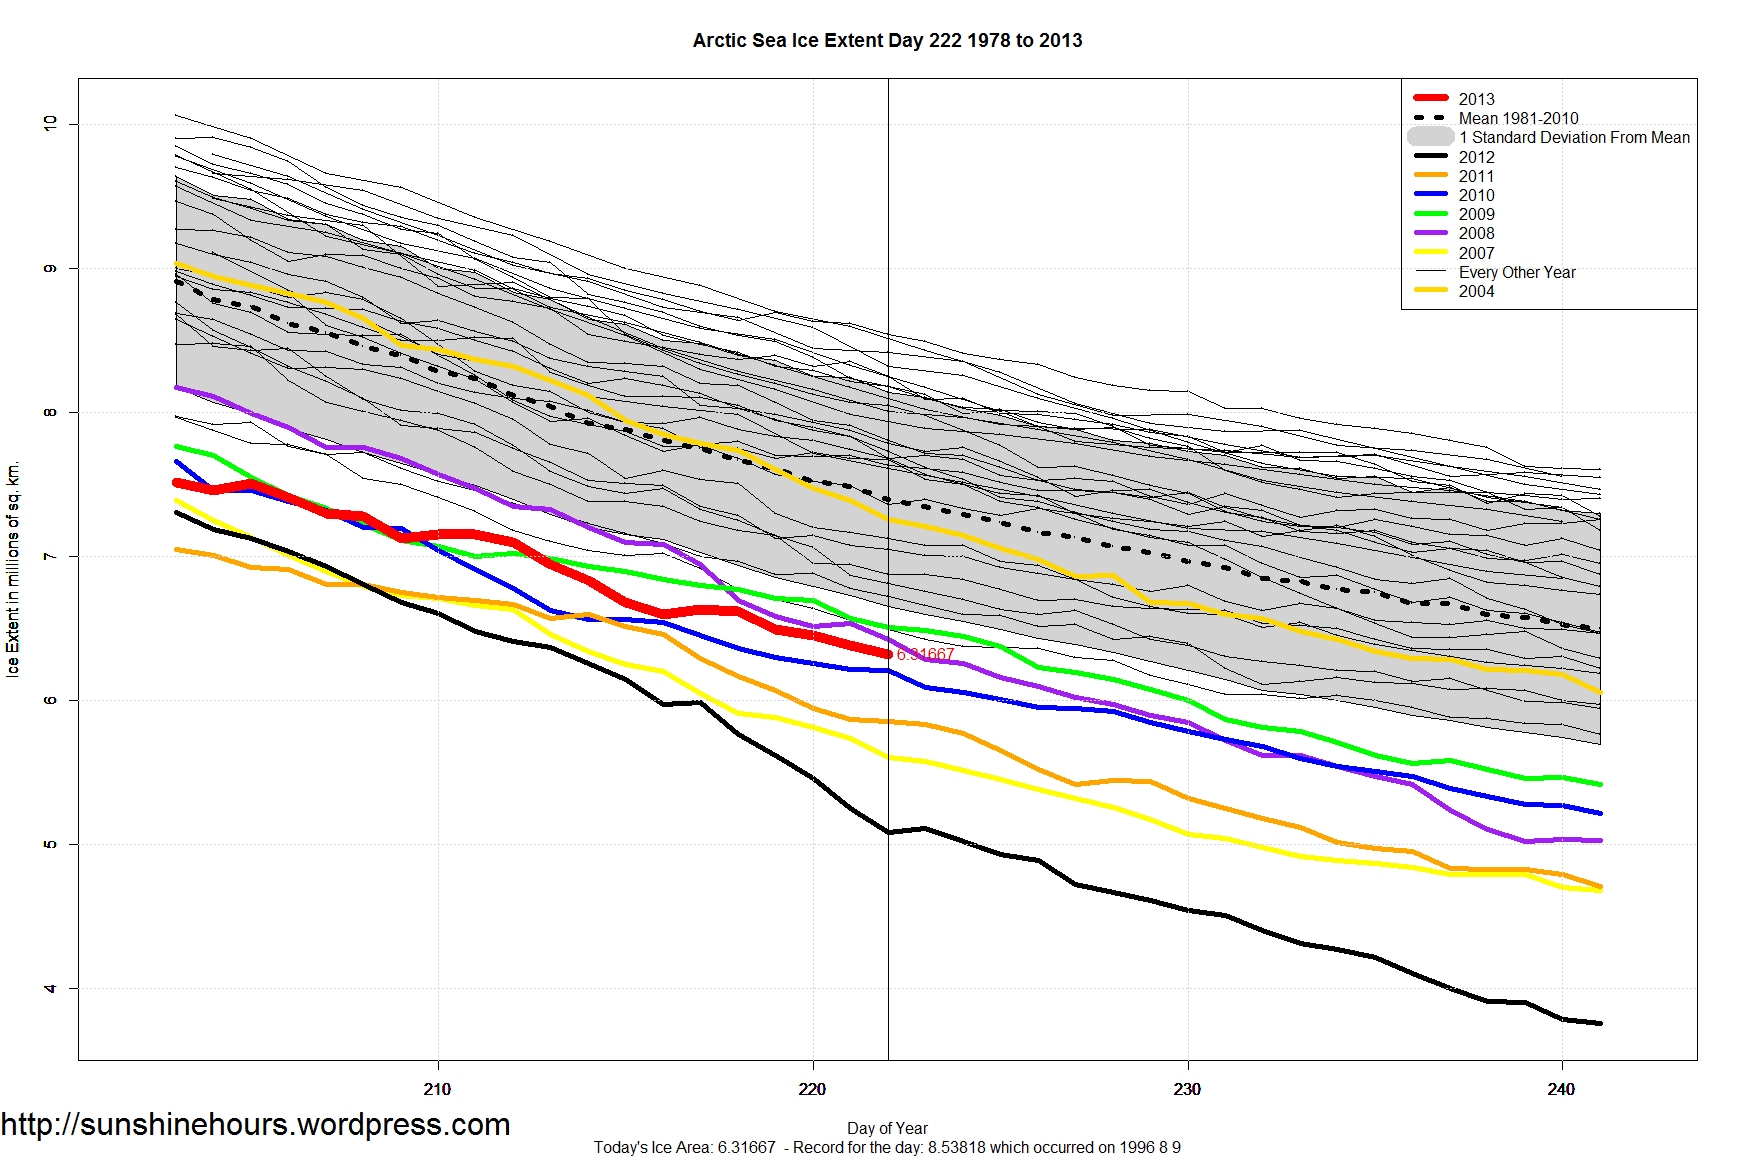
On this day in 2012, the Arctic Sea Ice Extent Anomaly from the 1981-2010 mean was 2.3 million sq km. Thats 31% below “normal”.
In 2013, the anomaly is now 1.07 million sq km – only 14.5% below normal.
Day 222 in the Antarctic (August 10) sees a big jump in sea ice extent as the climb rezooms!
Extent has climbed 290,000 sq km in the last two days and is approaching the 2010 records.
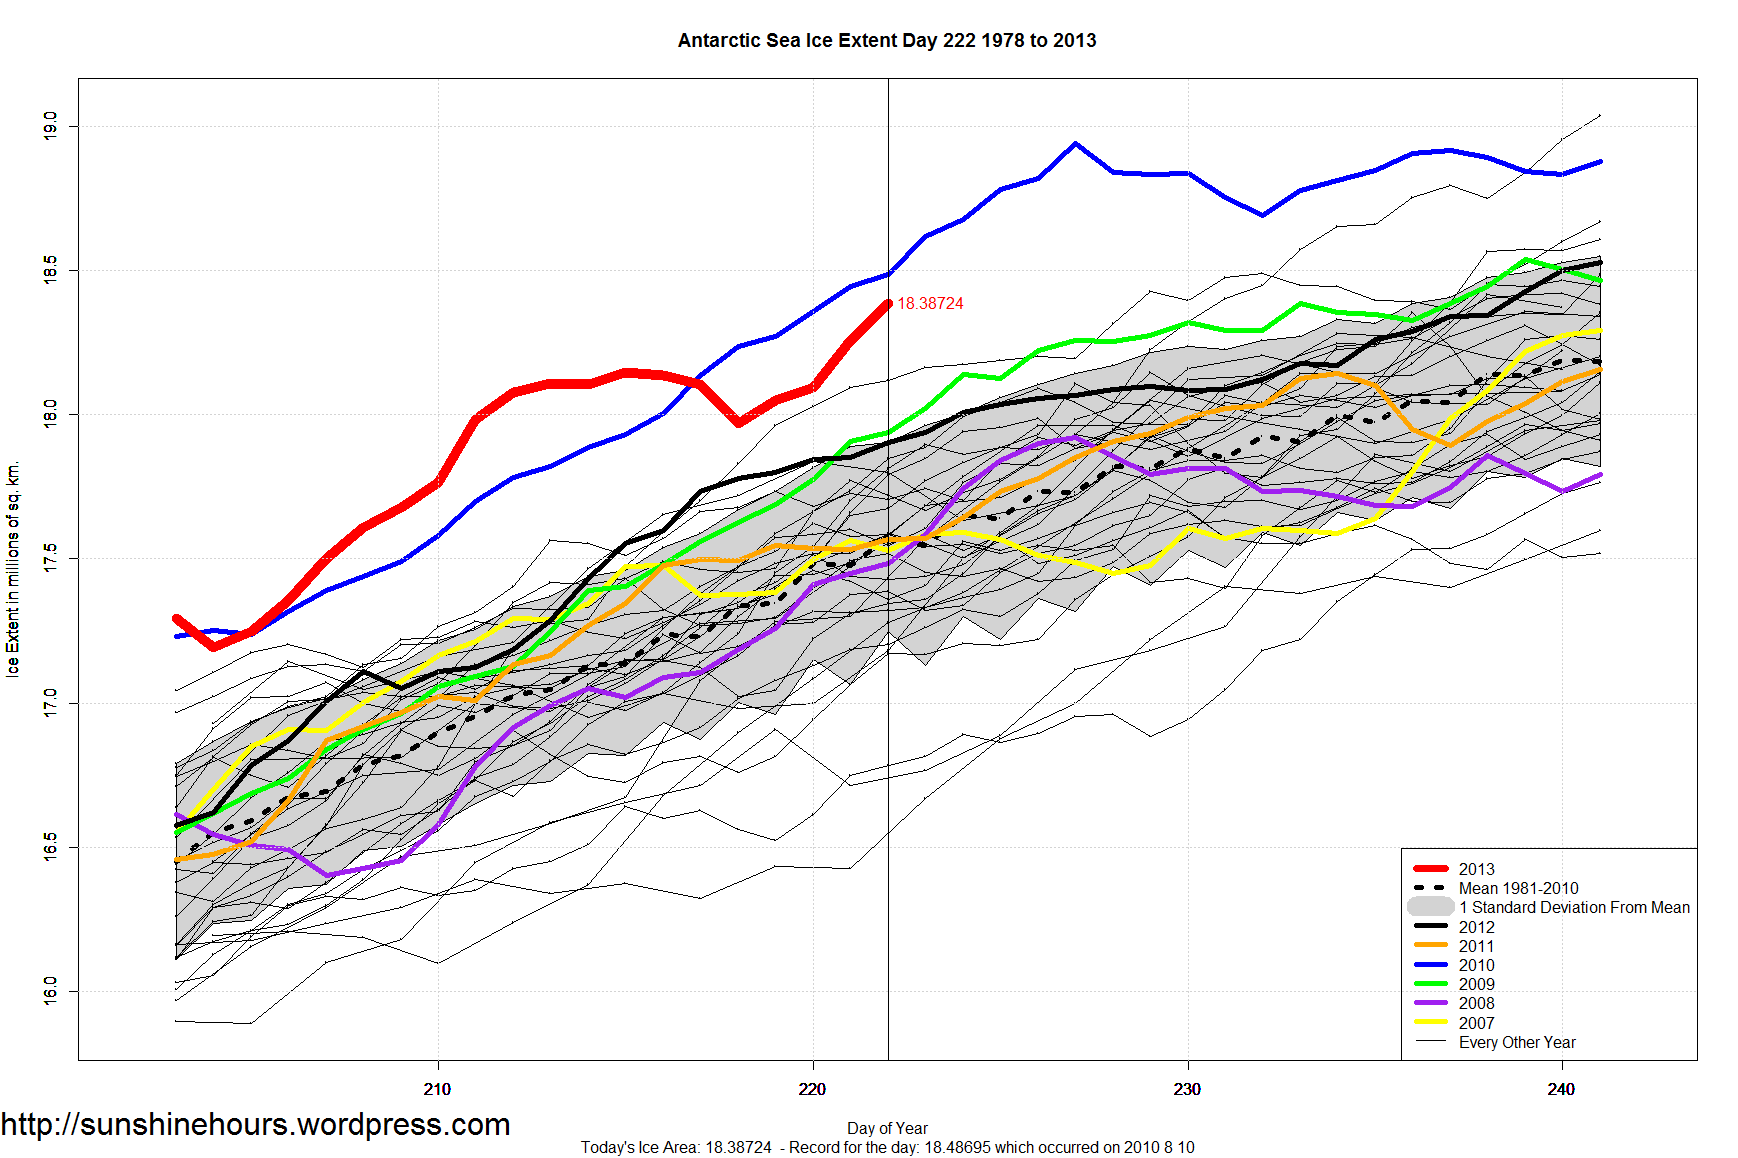
After taking a small jog sideways and downwards, Antarctic Sea Extent is back to moving up.
Day 221 is in 2nd place. 2010 holds the daily record. Can 2013 catch the 2010 record pace again? Wait and see.

August 8th was day 220. Arctic Sea Ice Extent is 988,000 sq km Higher Than 2012. Some cult is weeping …

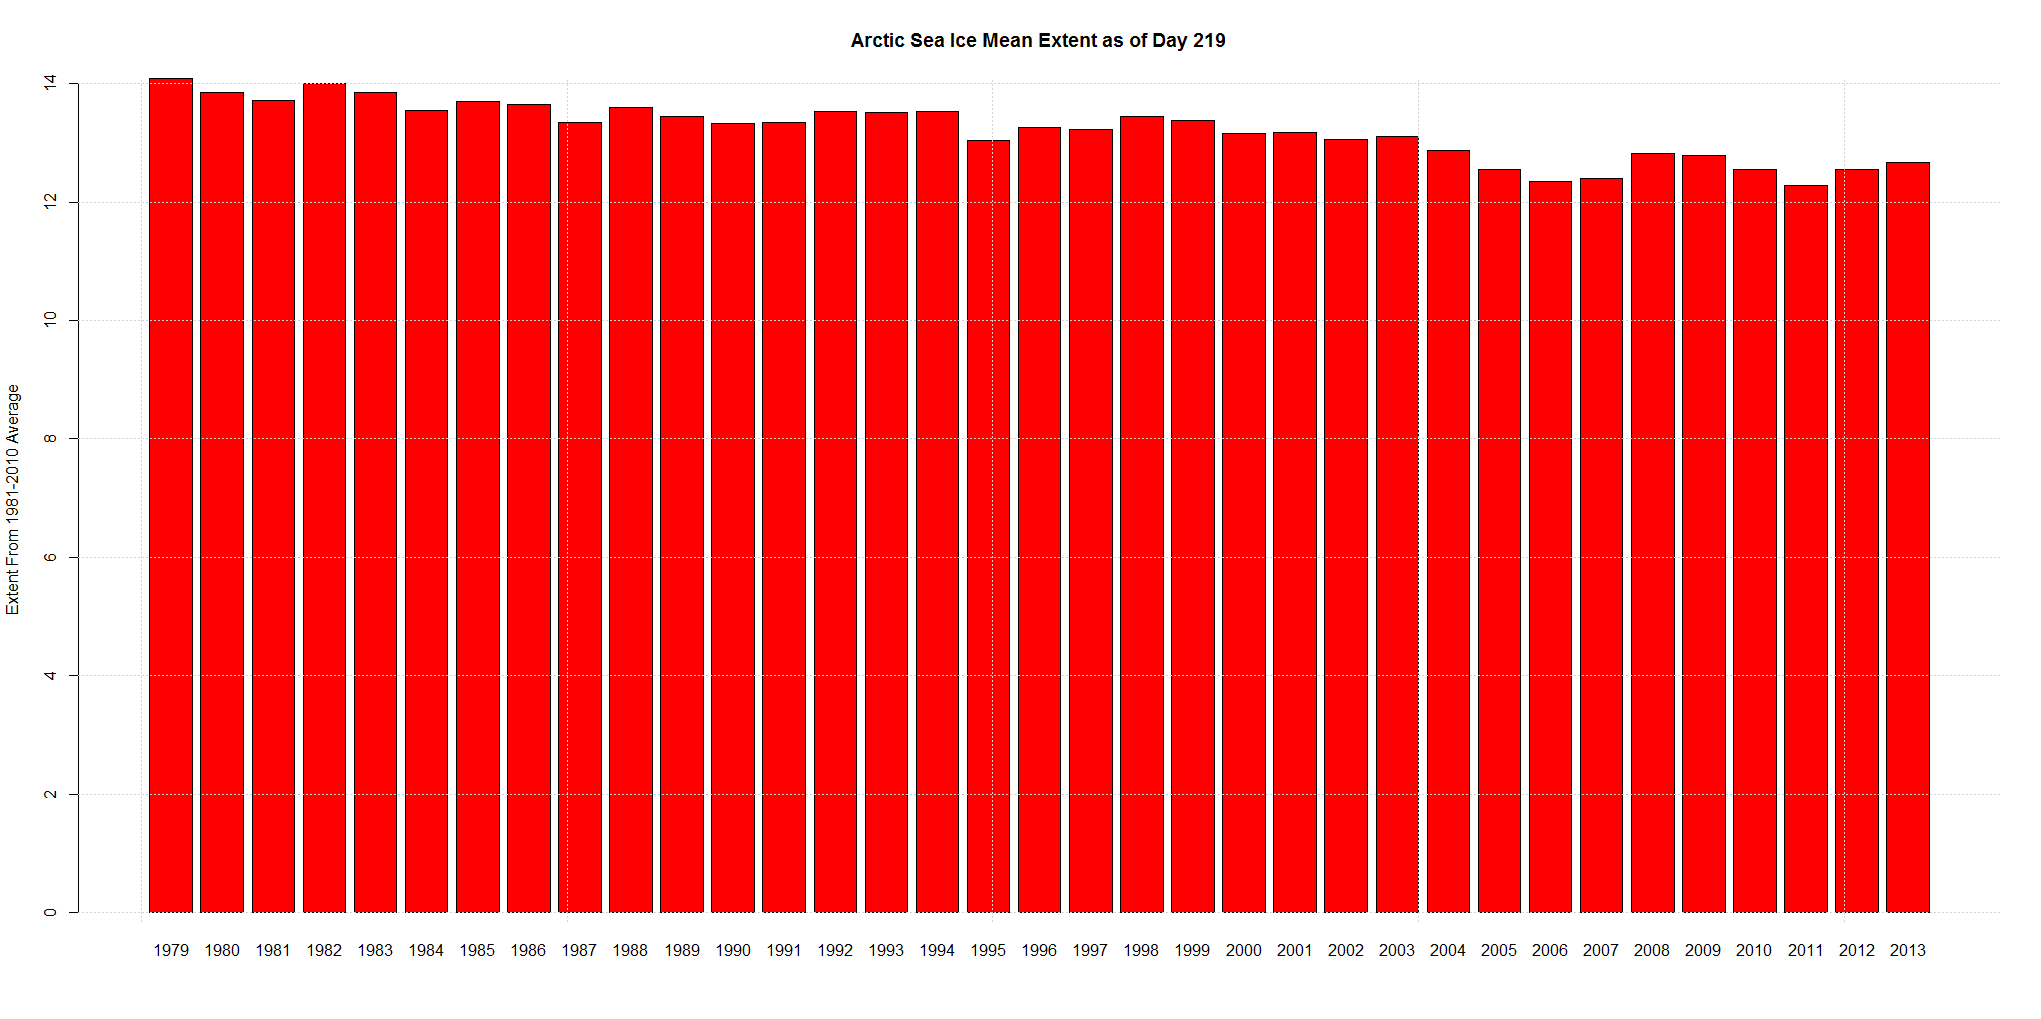
The following graph is the mean of Arctic sea ice extent up to day 219 for each year.