I wish I had caught this …
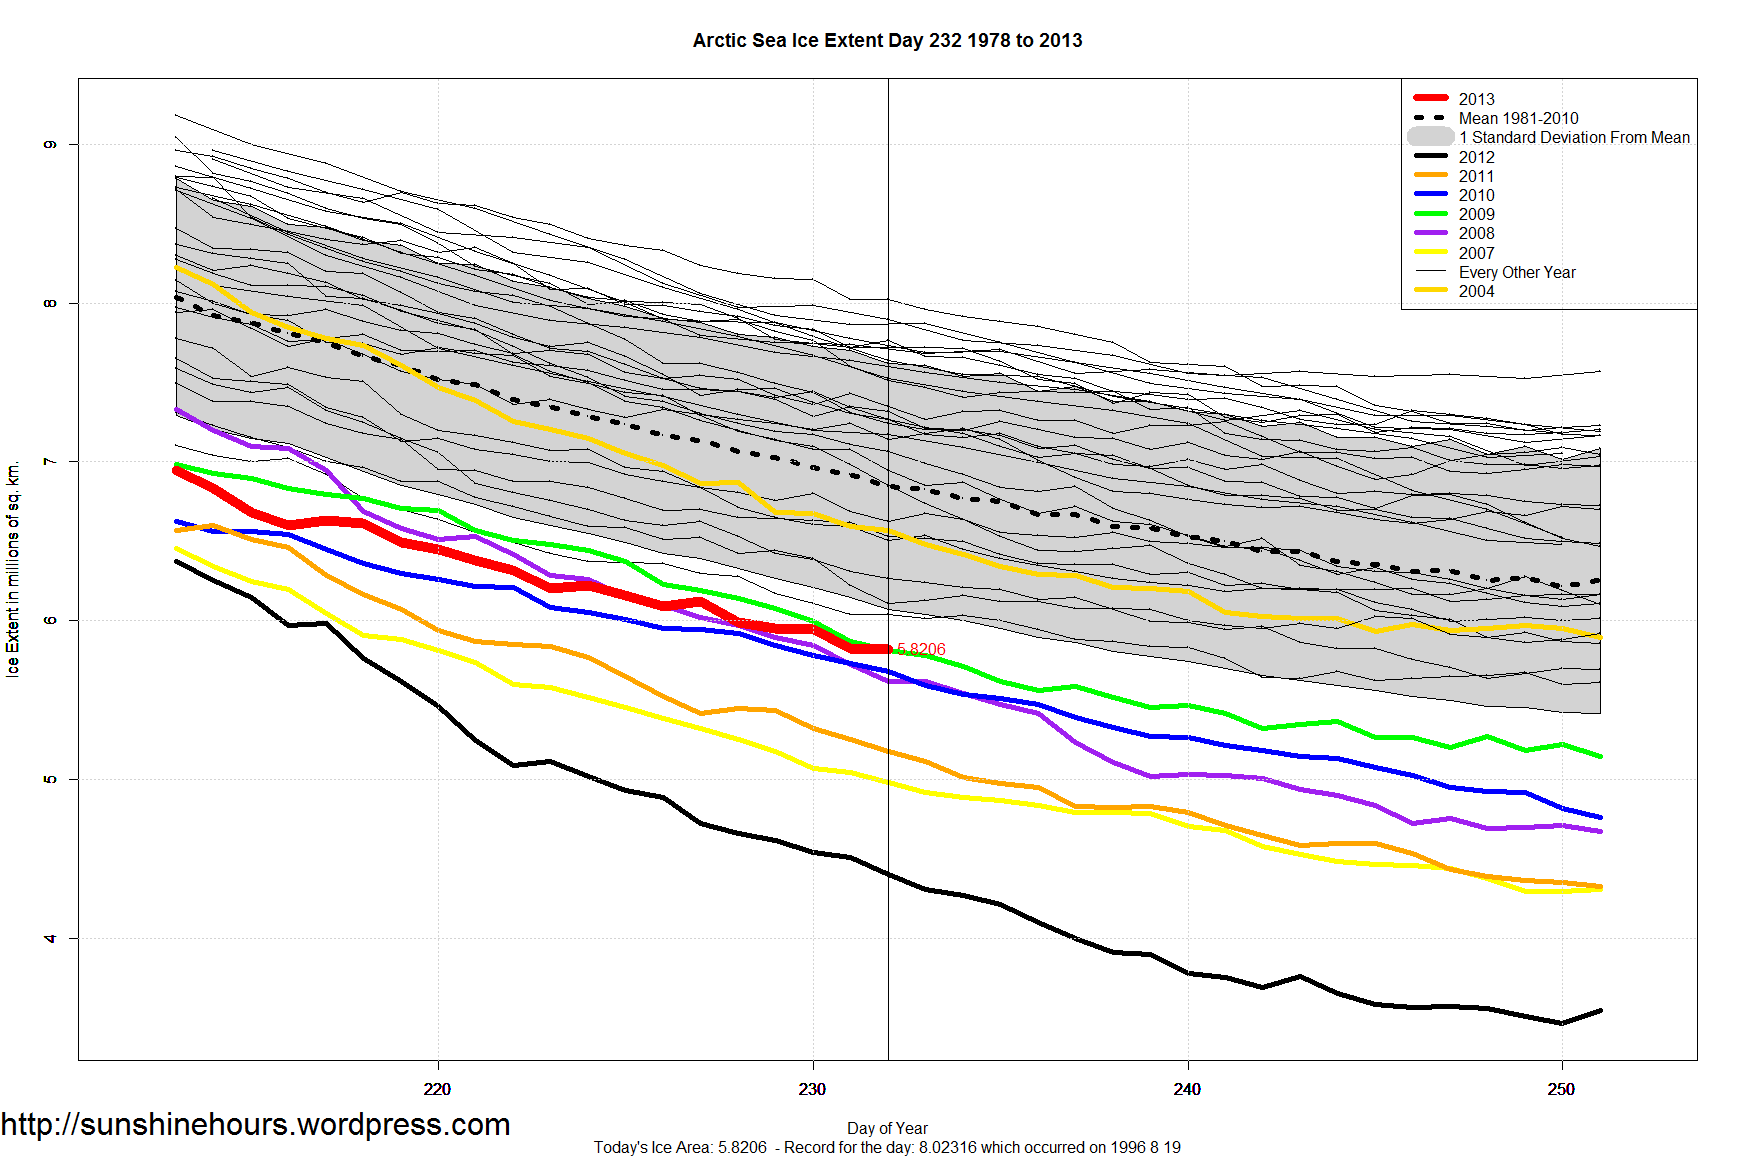
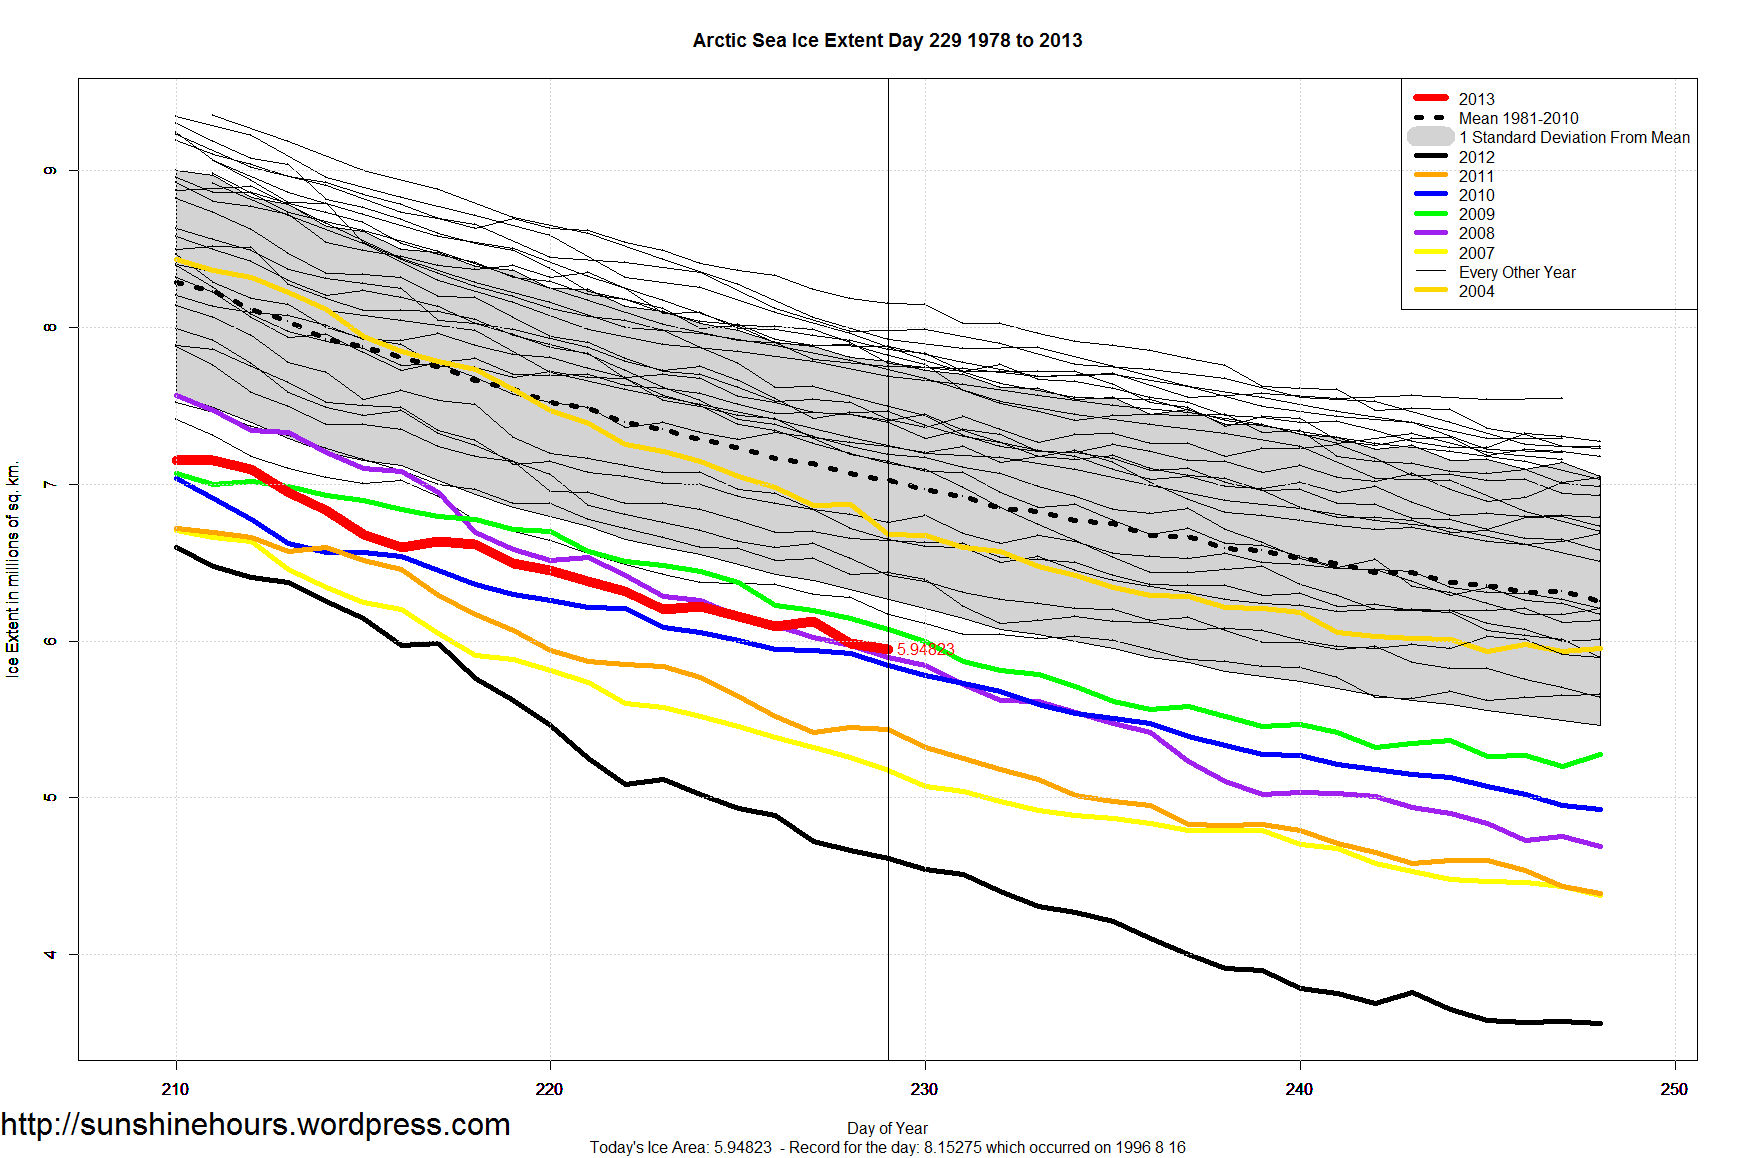
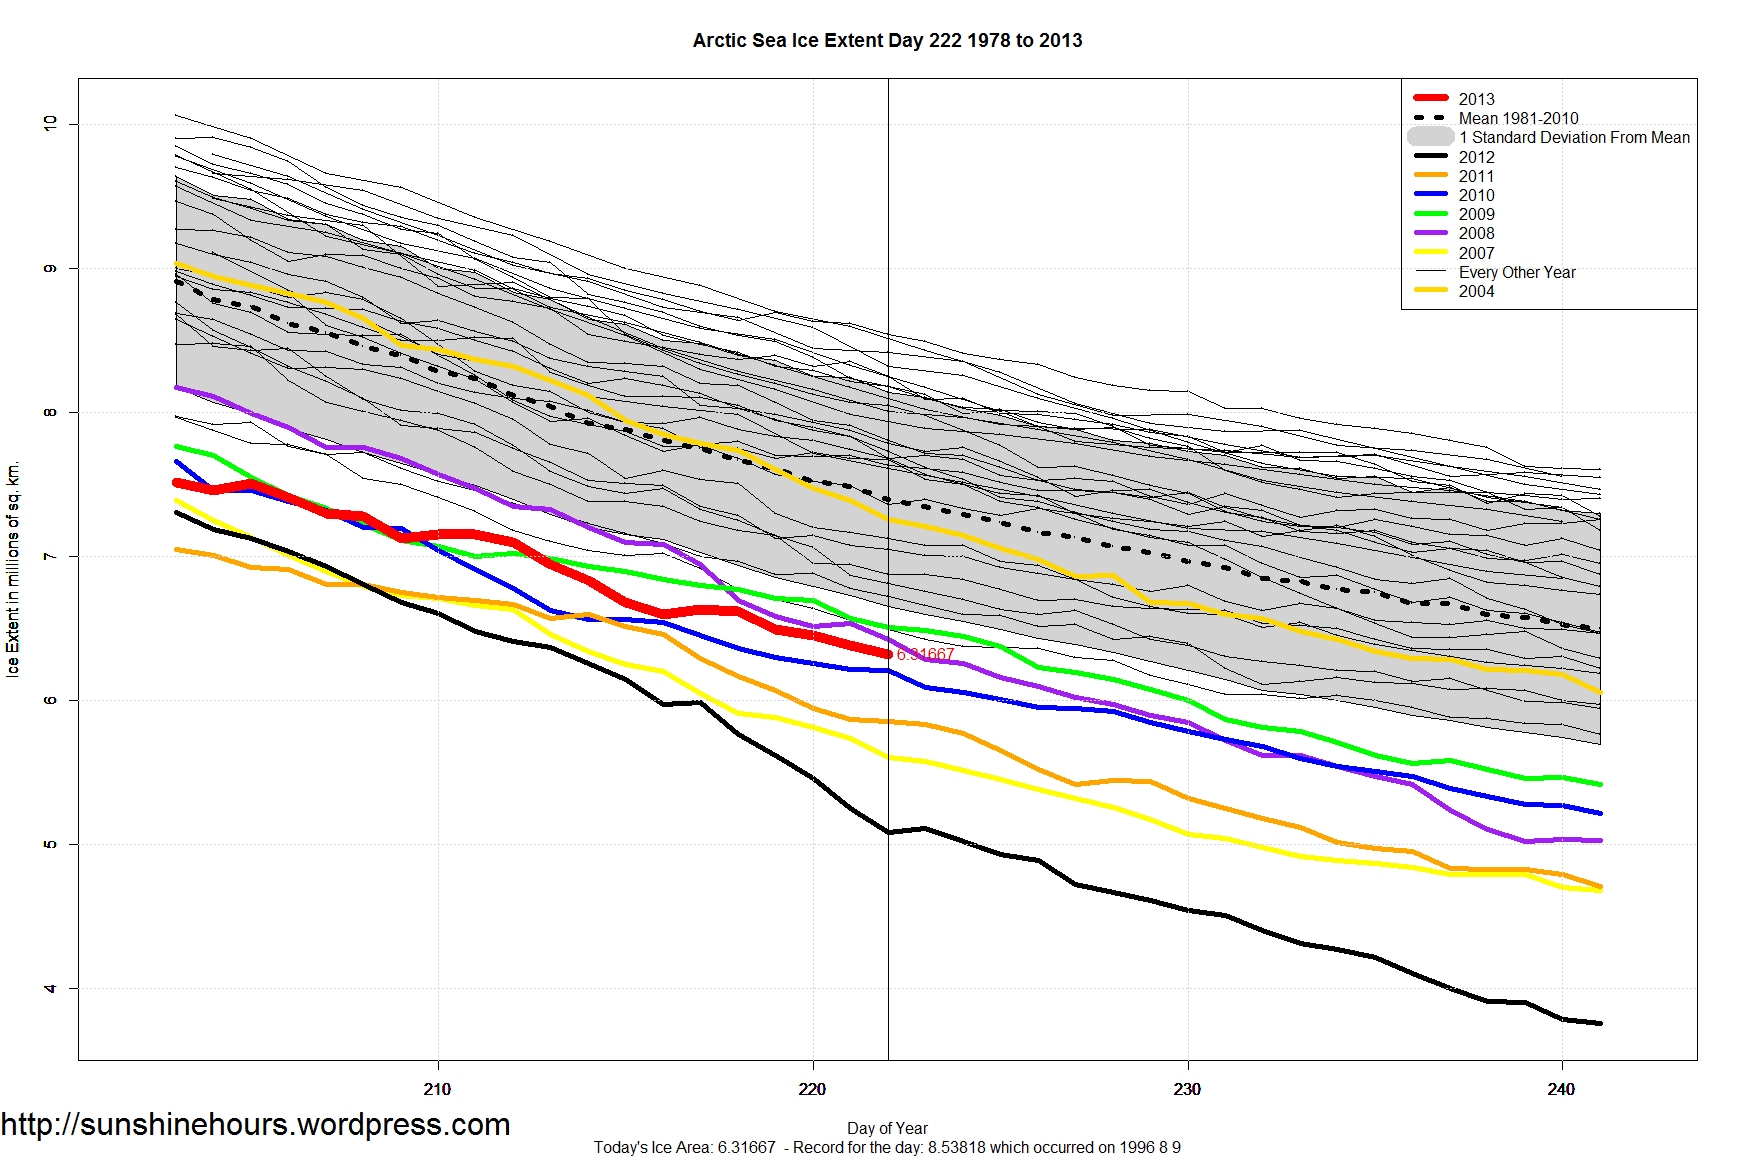
Arctic Sea Ice Extent was 1.4 million sq km higher than 2012 on day 232 (August 20th).
2012, 2007, 2011, 2008, 2010 and 2009 had less ice on the same day.
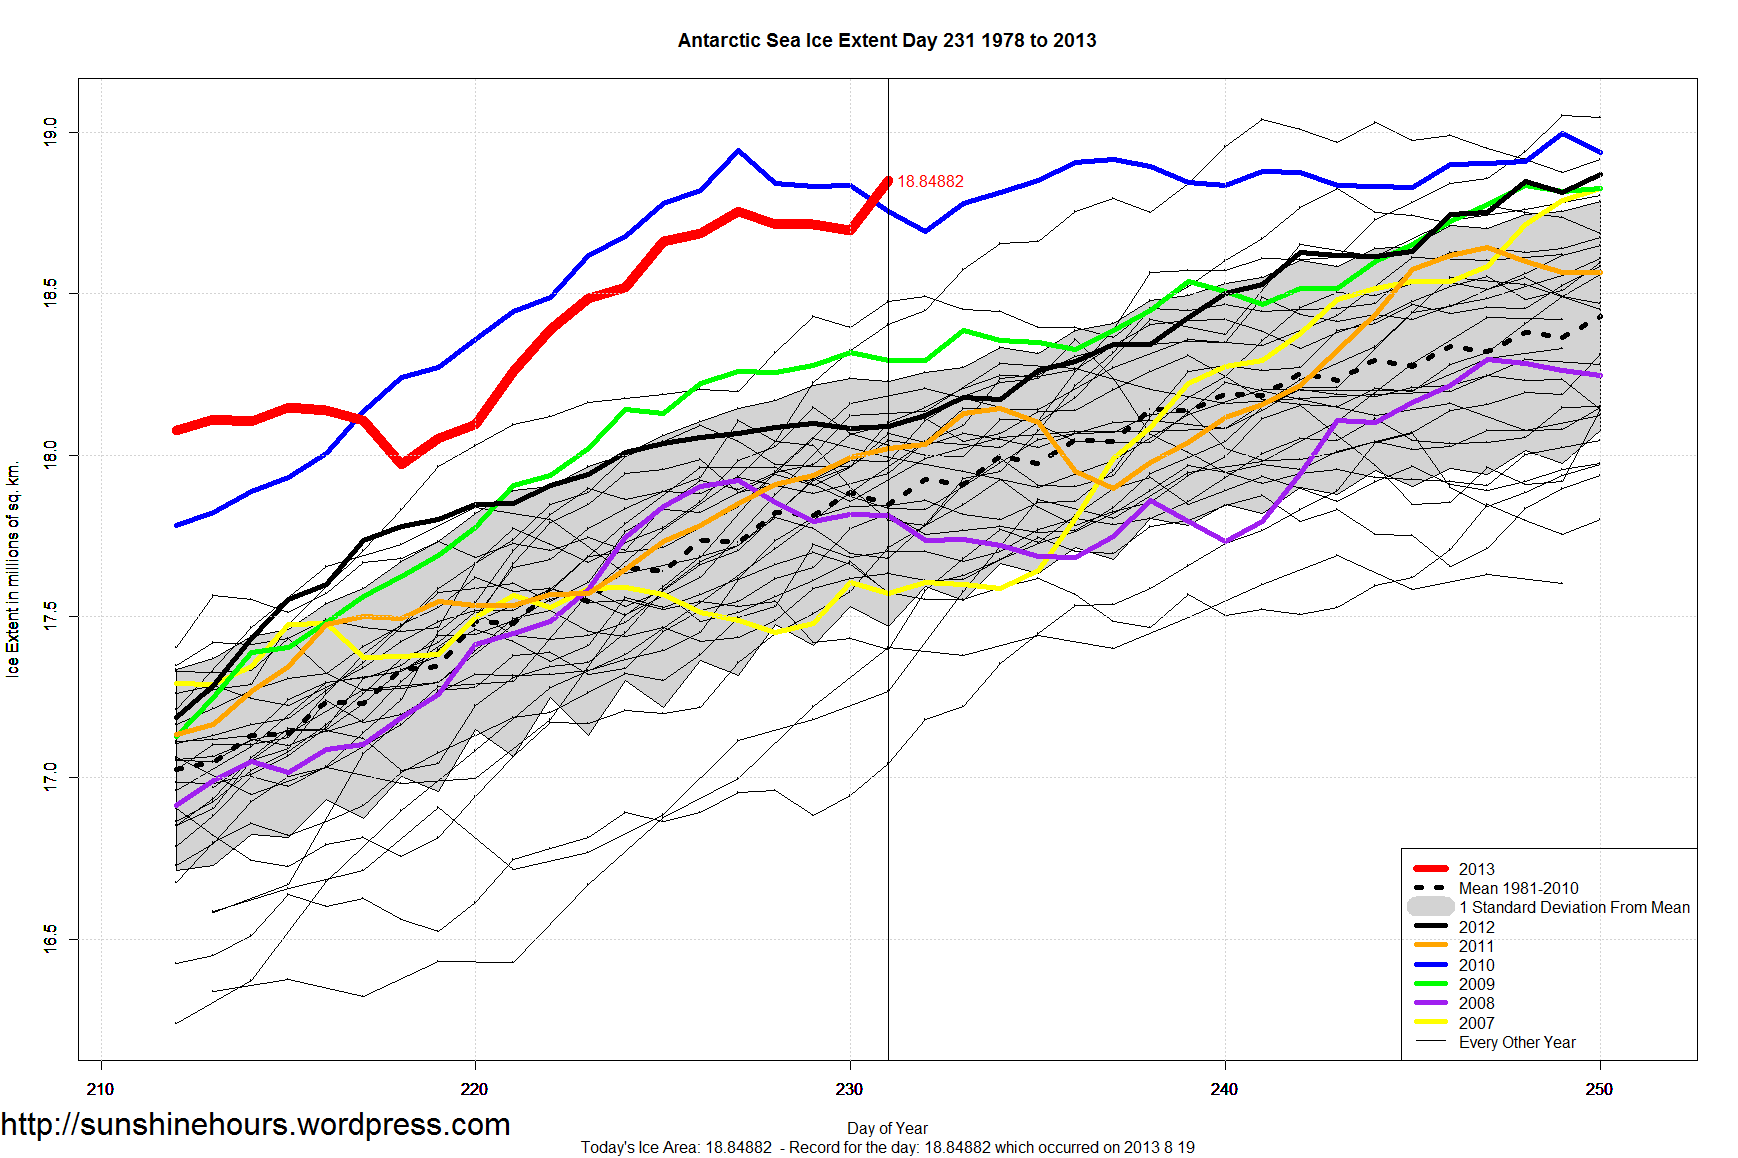
August 19 (Day 231) saw the 24th Daily Record of the Year for Antarctic Sea Ice Extent.
Day 231 Sea Ice Extent was 950,000 sq km higher than the 30 year mean.
2013 has a chance at catching 2006 and 2012 for the number of daily records set in a year.
| Year | No of Records |
| 2008 | 125 |
| 2010 | 115 |
| 2006 | 27 |
| 2012 | 27 |
| 2013 | 24 |
| 2007 | 21 |
| 2009 | 8 |
| 2004 | 5 |
| 1998 | 4 |
| 2000 | 4 |
| 2005 | 3 |
| 1979 | 2 |
| 1980 | 1 |
Click graph for bigger. Data is here.
"Clean-air policies in developing countries have resulted in reduced levels of anthropogenic atmospheric
aerosol pollution. Reductions in aerosol pollution is thought to result in a reduction in haze and
cloud layers, leading to an increase in the amount of solar radiation reaching the surface, and ultimately,
an increase in surface temperatures. There have been many studies illustrating coherent relationships
between surface solar radiation and temperature however, a direct link between aerosol emissions,
concentrations, and surface radiation has not been demonstrated to date. Here, we illustrate a coherence
between the trends of reducing anthropogenic aerosol emissions and concentrations, at the interface
between the North-East Atlantic and western-Europe, leading to a staggering increase in surface
solar radiation of the order of ∼20% over the last decade."
Clean air legislation really got going in the late 1970s.
Paul Homewood has blogged about a surprising admission from a paper published on the NOAA website.
They’ve admitted that if it gets colder in Antarctica there is more sea ice extent and when it is warmer there is less sea ice extent.
“this work not only debunks some of the fanciful arguments of warmists, it also suggests that temperatures in Antarctica have been falling since satellites started to monitor sea ice levels in 1979.”
Read about it here.
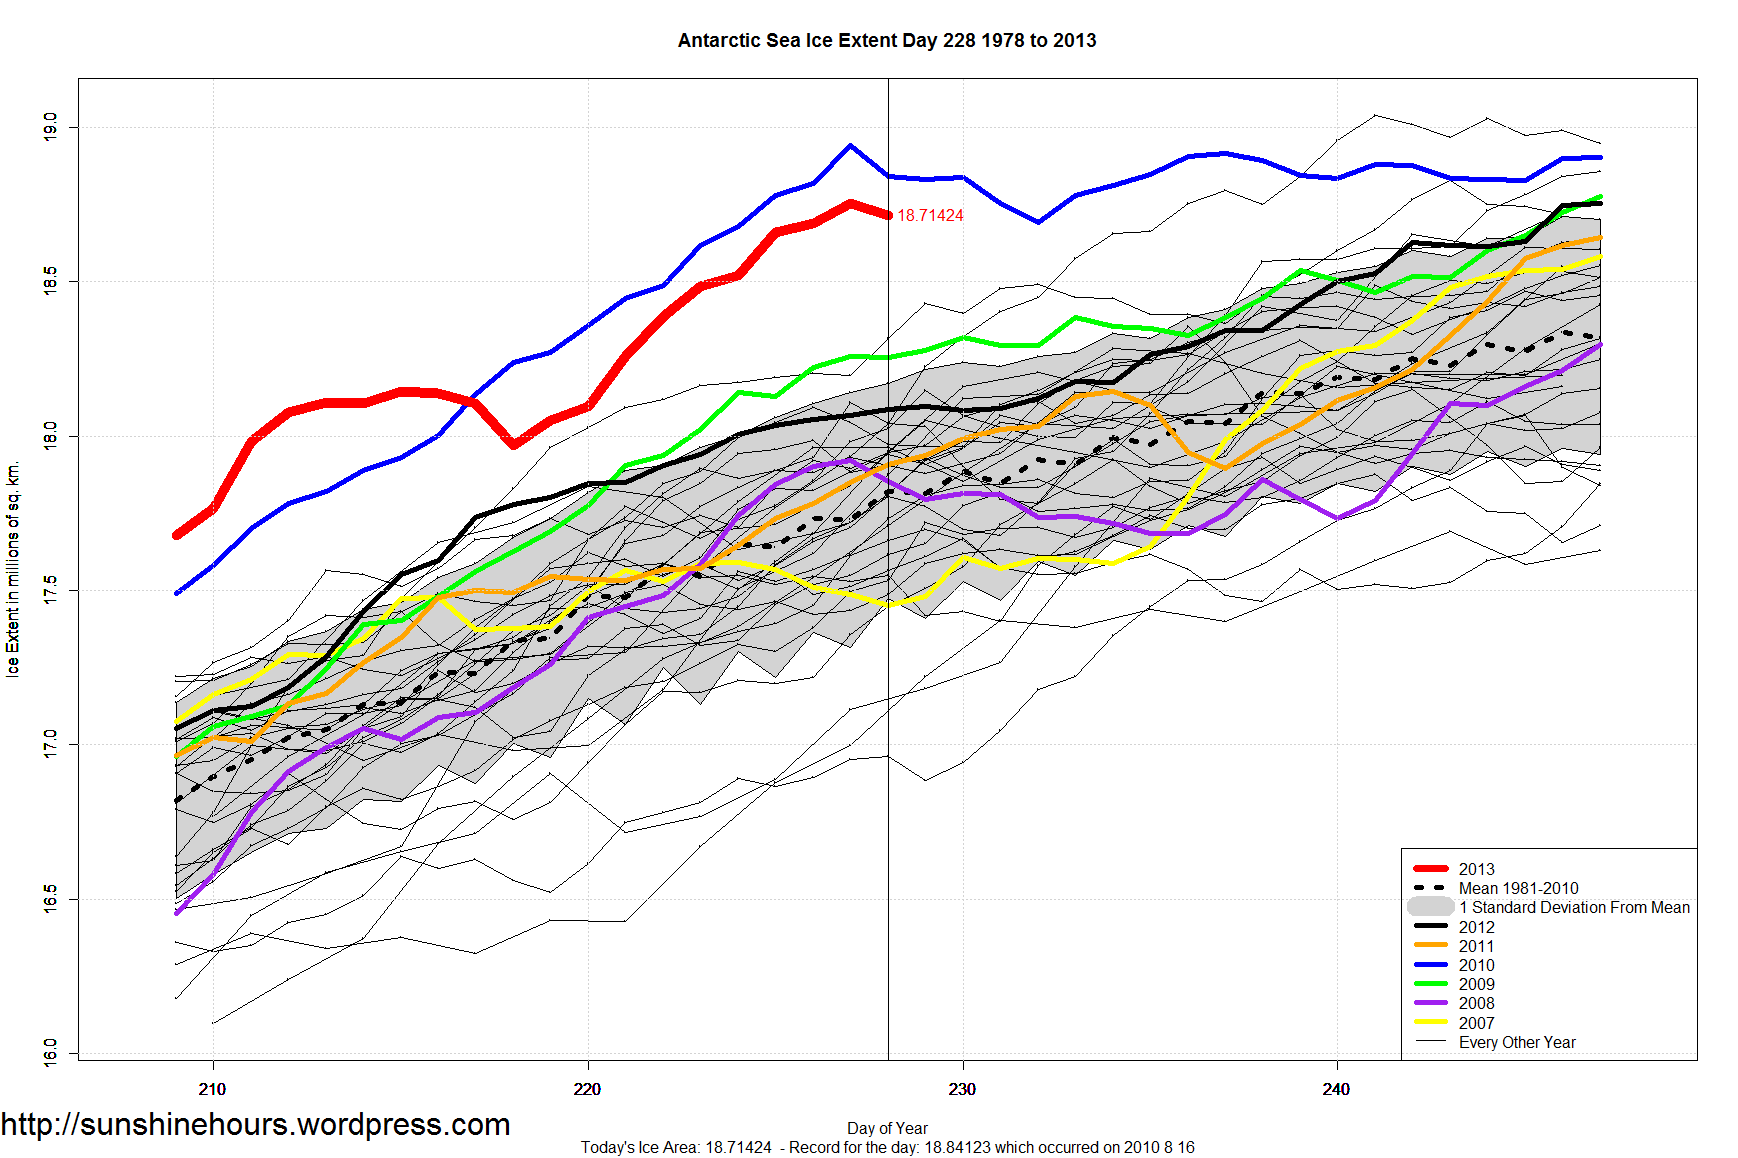
Antarctic Sea Extent has been running parallel to 2010 about 100,000 sq km below the record, but 890,000 sq km above the 30 year mean.
2013 (up to day 227) has averaged 760,000 sq km above the long term average, good for 2nd place to 2008 which averaged 810,000 sq km up to day 227.
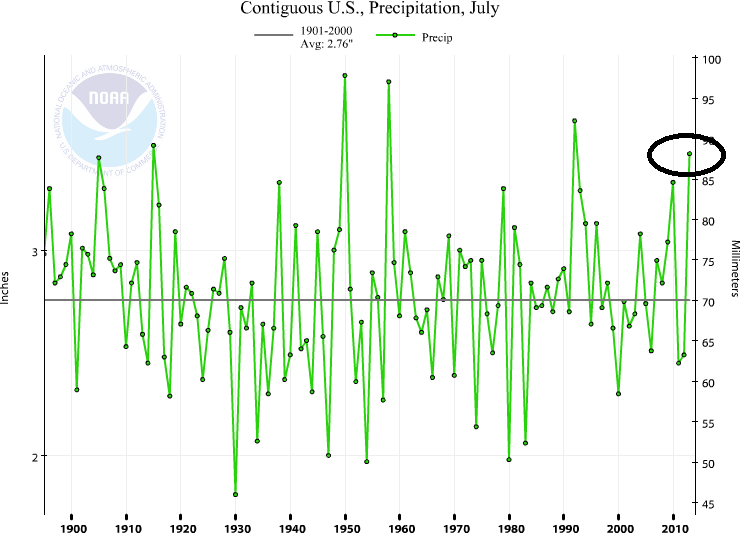
With all the claims about 2012 being the worst drought in USA history (total joke), I thought I would mention that July 2013 was the 5th wettest July ever according to the NOAA.
Only 1950, 1958, 1992 and 1915 were wetter. July 2013 was .71 inches above the 1901 – 2000 average. July 1930 was the driest.
The 1895 to 2013 trend for precipitation in July is 0. Flat. No trend at all. Perfectly average.
Year To Date precipitation for 2013 is 23rd wettest. 1.54″ above the long term average.
Alabama had the 5th coldest July since 1895 according to the NOAA.
July 2013 in Alabama was tied for 5th coldest with 1911.
Only 4 July’s were colder. 1967,1947,1994 and 1972. The two warmest July’s were 1930 and 1932.
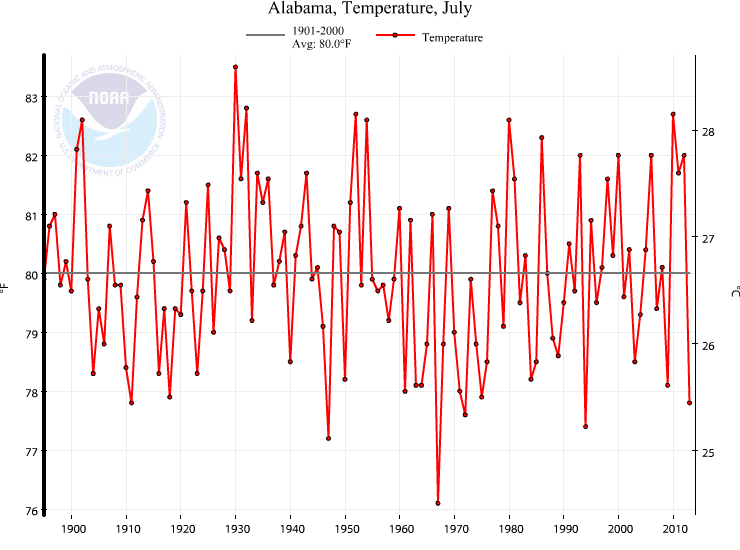
Even with all the manipulation of NOAA data to cool the past and warm the present, there were 29 July’s warmer than July 2013 in the USA according to the NOAA.
These July’s were warmer than July 2013.
1901,1917,1921,1930,1931,1933,1934,1935,1936,1937,1939,1954,1955,1964,1966,1977,1980,1988,1998,1999,2001,2002,2003,2005,2006,2007,2010,2011,2012
1936 was the 2nd warmest. 1934 was the 4th warmest. And 1901 was the 6th warmest. According to the NOAA. I suspect 1936 was really the warmest, but NOAA data says otherwise today.
The USA population (along with UHI) has risen from 128 million in 1936 to 319 million.
