⚠️ 🏔️ Avalanche caught on camera: Snow came crashing down in Colorado near I-70 in Ten Mile Canyon outside Copper Mountain this afternoon. | Hear from the man who saw it all and took this video tonight on FOX31. pic.twitter.com/MPk3D9Raxe
— FOX31 Denver KDVR (@KDVR) March 3, 2019
UK Antarctic meteorite hunt bags large haul
Space rocks!
The first British-led expedition to gather meteorites in the Antarctic has returned with a haul of 36 space rocks.
Manchester University’s Dr Katherine Joy was dropped in the deep field with British Antarctic Survey guide Julie Baum for four weeks.
The pair spent their days near the Shackleton mountains running across the ice sheet in skidoos looking for out-of-place objects.
The meteorites ranged from tiny flecks to some that were as big as a melon.
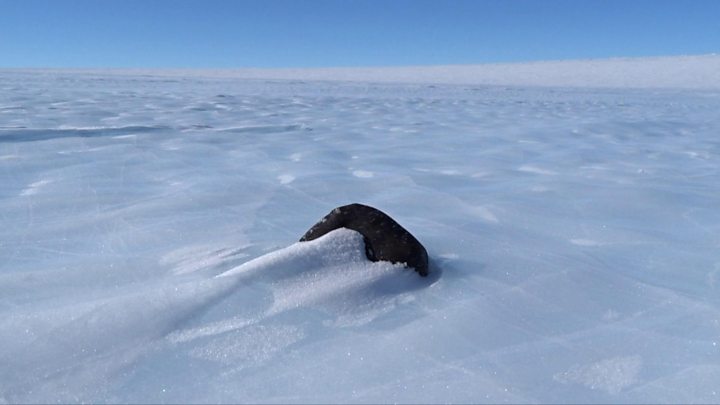
Some two-thirds of the meteorites in the world’s collections have been picked up in the Antarctic. It’s the contrast of black on white that makes the continent such a productive hunting ground.
“As soon as you spot a black rock you know. You dart towards it and your heart picks up a beat,” Dr Joy told BBC News.
“They look black because they’re burnt up as they come down through Earth’s atmosphere. They have a very characteristic exterior colour, and they have a kind of cracked surface where that exterior has expanded and contracted during the violent atmospheric entry.”
Read the rest
Antarctic Minimum Approaching – Day 59 – 2019
This post may seem familiar.
The most current Antarctic Sea Ice Extent data is from day 61.
I thought day 49 was the minimum. I was wrong. It may be day 59 … and I could still be wrong.
Antarctic minimum is approaching (or may have occurred) 2017 and 2018 were lowest minimums. 2019 is 7th lowest (although that may change a bit).
That kind of oscillation is “normal” and getting larger. The oscillation graph is just Day 99 but thats close to the normal day of min.

| Year | Min | Max | day of Max | day of Min | Avg Anomaly |
| 2017 | 2.08 | 18.145 | 282 | 60 | -0.904021753581 |
| 2018 | 2.15 | 18.222 | 273 | 49 | -0.715287507005 |
| 1997 | 2.264 | 18.792 | 265 | 58 | -0.262895726184 |
| 1993 | 2.281 | 18.71 | 263 | 50 | -0.233008054951 |
| 2011 | 2.319 | 18.954 | 266 | 53 | -0.152375178238 |
| 1984 | 2.382 | 18.37 | 266 | 58 | -0.20397636284 |
| 2019 | 2.444 | 59 | |||
| 2006 | 2.487 | 19.36 | 264 | 51 | -0.192035452211 |
| 1992 | 2.492 | 18.467 | 255 | 54 | -0.241630203122 |
| 1980 | 2.521 | 19.092 | 267 | 57 | -0.390551802967 |
| 1991 | 2.554 | 18.671 | 273 | 58 | -0.108073808375 |
| 2000 | 2.582 | 19.159 | 272 | 49 | 0.106979086495 |
| 1996 | 2.597 | 18.831 | 267 | 56 | 0.12888072584 |
| 1985 | 2.602 | 18.931 | 254 | 50 | -0.045367912714 |
| 2016 | 2.616 | 18.581 | 242 | 48 | -0.438132935363 |
| 1988 | 2.639 | 18.785 | 277 | 55 | -0.142789879716 |
| 2009 | 2.671 | 19.299 | 267 | 53 | 0.395643999844 |
| 1981 | 2.694 | 18.856 | 261 | 51 | -0.210032677284 |
| 2002 | 2.697 | 18.116 | 252 | 51 | -0.4313395618 |
| 1999 | 2.707 | 18.981 | 273 | 51 | 0.107734410803 |
| 1989 | 2.723 | 18.274 | 266 | 51 | -0.227268328923 |
| 2007 | 2.723 | 19.086 | 272 | 50 | 0.034159068337 |
| 1998 | 2.772 | 19.244 | 258 | 56 | 0.085424821762 |
| 1990 | 2.784 | 18.379 | 273 | 53 | -0.24335326043 |
| 2005 | 2.804 | 19.295 | 272 | 49 | 0.041931671077 |
| 2010 | 2.842 | 18.998 | 249 | 47 | 0.453843999844 |
| 1983 | 2.843 | 18.811 | 263 | 55 | -0.256928852148 |
| 1982 | 2.89 | 18.55 | 246 | 54 | -0.021131648978 |
| 1979 | 2.911 | 18.361 | 256 | 48 | 0.039939779594 |
| 1986 | 2.953 | 18.027 | 261 | 65 | -0.555519016082 |
| 1987 | 3.01 | 18.524 | 258 | 52 | -0.249198161098 |
| 1994 | 3.083 | 18.827 | 243 | 43 | 0.121022082036 |
| 2012 | 3.111 | 19.478 | 266 | 54 | 0.364189469009 |
| 2004 | 3.259 | 19.124 | 252 | 51 | 0.321249578299 |
| 1995 | 3.33 | 18.762 | 269 | 55 | 0.141808383406 |
| 2001 | 3.441 | 18.494 | 271 | 50 | 0.019676876556 |
| 2015 | 3.544 | 18.912 | 275 | 49 | 0.761153588885 |
| 2014 | 3.548 | 20.201 | 263 | 52 | 1.123178246419 |
| 2003 | 3.626 | 18.68 | 268 | 48 | 0.316339890255 |
| 2013 | 3.679 | 19.608 | 274 | 50 | 0.870657698474 |
| 2008 | 3.692 | 18.298 | 247 | 51 | 0.599159414364 |
Sea Ice Extent (Global Antarctic and Arctic) – Day 61 – 2019


Arctic Sea Ice Volume 02-Mar-2019


From DMI
Sea Ice Extent (Global Antarctic and Arctic) – Day 60 – 2019


Arctic Sea Ice Volume 01-Mar-2019


From DMI
Who Will Pay For Roads and Bridges If Electric Cars Get Market Share?
U.S. roads and bridges are in abysmal shape – and that was before the recent winter storms made things even worse.
In fact, the government rates over one-quarter of all urban interstates as in fair or poor condition and one-third of U.S. bridges need repair.
To fix the potholes and crumbling roads, federal, state and local governments rely on fuel taxes, which raise more than US$80 billion a year and pay for around three-quarters of what the U.S. spends on building new roads and maintaining them.
I recently purchased an electric car, the Tesla Model 3. While swerving down a particularly rutted highway in New York, the economist in me began to wonder, what will happen to the roads as fewer and fewer cars run on gasoline? Who will pay to fix the streets?
Fuel taxes 101
Every time you go to the pump, each gallon of fuel you purchase puts money into a variety of pockets.
About half goes to the drillers that extract oil from the earth. Just under a quarter pays the refineries to turn crude into gasoline. And around 6 percent goes to distributors.
The rest, or typically about 20 percent of every gallon of gas, goes to various governments to maintain and enhance the U.S. transportation’s infrastructure.
Currently, the federal government charges 18.4 cents per gallon of gasoline, which provides 85 percent to 90 percent of the Highway Trust Fund that finances most federal spending on highways and mass transit.
Read more at: https://phys.org/news/2019-02-electric-cars-america-crumbling-roads.html#jCp
Oops
Why Renewables Can’t Save the Planet
Obvious to some, but here is a great essay.
“As for house cats, they don’t kill big, rare, threatened birds. “
“In fact, wind turbines are the most serious new threat to important bird species to emerge in decades. The rapidly spinning turbines act like an apex predator which big birds never evolved to deal with.
Solar farms have similarly large ecological impacts. Building a solar farm is a lot like building any other kind of farm. You have to clear the whole area of wildlife.
In order to build one of the biggest solar farms in California the developers hired biologists to pull threatened desert tortoises from their burrows, put them on the back of pickup trucks, transport them, and cage them in pens where many ended up dying.”
As we were learning of these impacts, it gradually dawned on me that there was no amount of technological innovation that could solve the fundamental problem with renewables.

You can make solar panels cheaper and wind turbines bigger, but you can’t make the sun shine more regularly or the wind blow more reliably. I came to understand the environmental implications of the physics of energy. In order to produce significant amounts of electricity from weak energy flows, you just have to spread them over enormous areas. In other words, the trouble with renewables isn’t fundamentally technical—it’s natural.
Read it all at Quillette.
