Sea Ice Extent (Global Antarctic and Arctic) – Day 97 – 2016

Day 96 saw the NSIDC publish two sets of data for Antarctica. One was a sudden huge jump and the later one was a big drop.
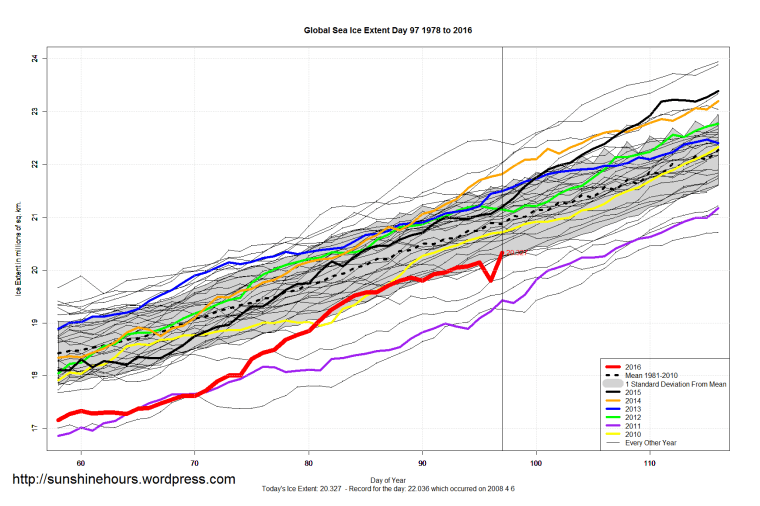
Here is day 97:

Global_Sea_Ice_Extent_Zoomed_2016_Day_97_1981-2010

Antarctic_Sea_Ice_Extent_Zoomed_2016_Day_97_1981-2010

Arctic_Sea_Ice_Extent_Zoomed_2016_Day_97_1981-2010


South / North

Sea Ice Extent (Global Antarctic and Arctic) – Day 96 – 2016

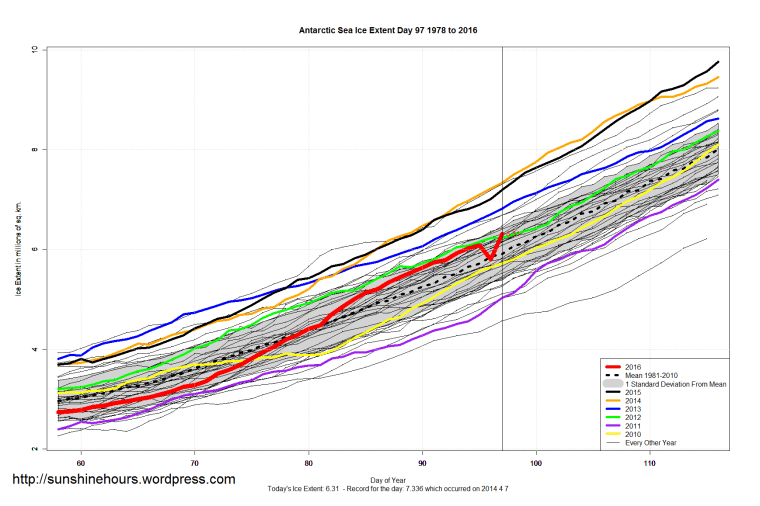
UPDATE 2: They updated the data, at 3:22 down to 5.786 (which is a 300,000 sq km drop from the day before. Not likely.

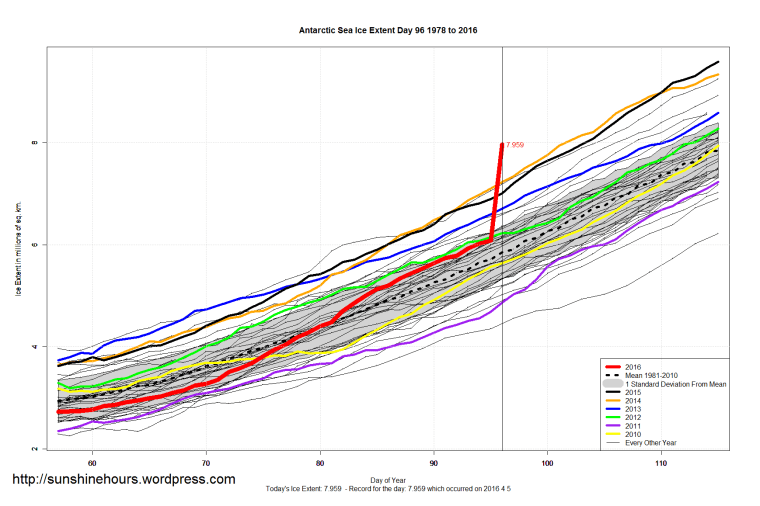
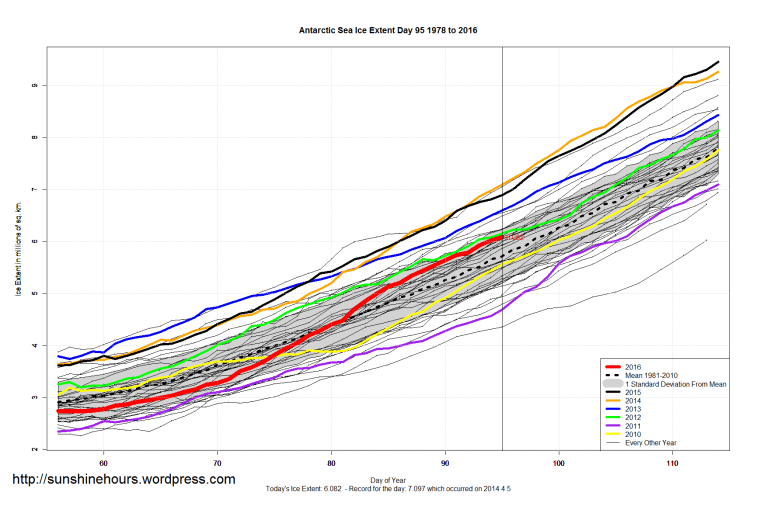
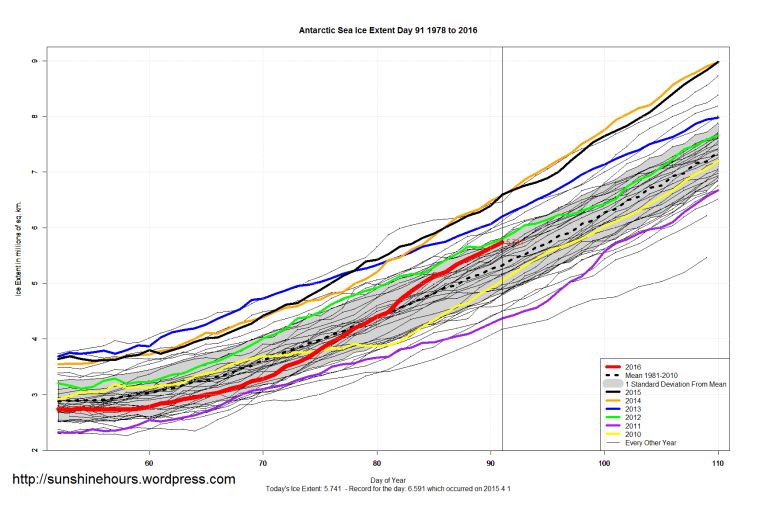
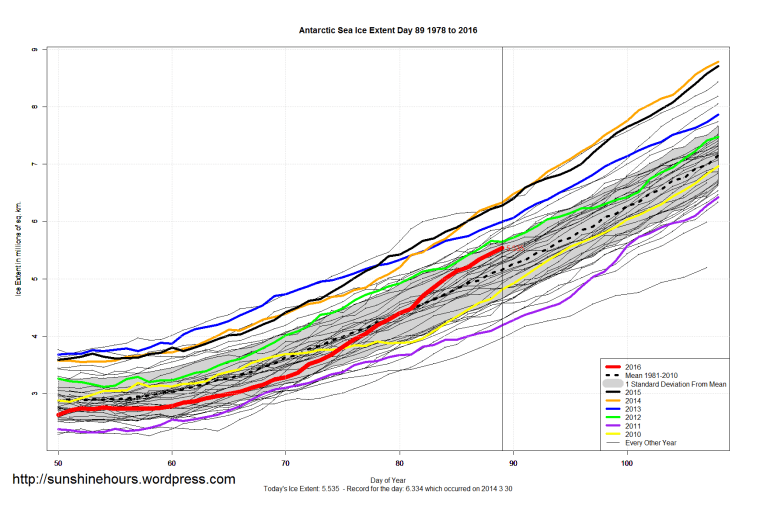
On day 96 the Antarctic sea ice extent took an unlikely jump from 6.082 million sq km to 7.959.

Sometimes they correct it the next day. Sometimes they don’t.

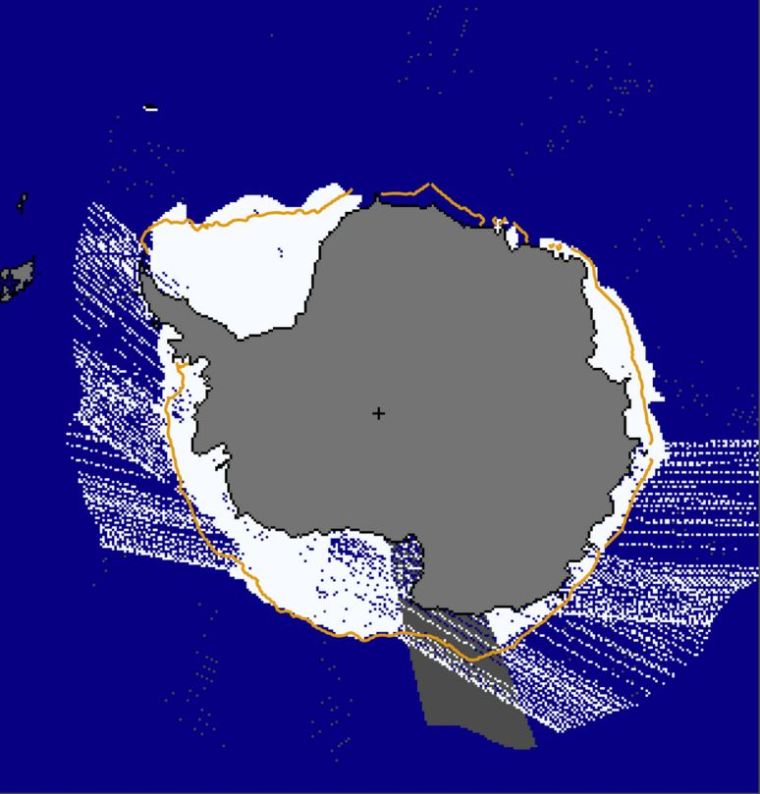
UPDATE: The “stuttering” in the daily Antarctic image. (Thanks AZ1971)

Antarctic_Sea_Ice


Global_Sea_Ice_Extent_Zoomed_2016_Day_96_1981-2010 Antarctic_Sea_Ice_Extent_Zoomed_2016_Day_96_1981-2010 Arctic_Sea_Ice_Extent_Zoomed_2016_Day_96_1981-2010


South / North

Sea Ice Extent (Global Antarctic and Arctic) – Day 95 – 2016

Change in the last 10 days Antarctic (blue is gain / red is melt):

2016 Antarctic Ice Loss or Gain Last 10 Days (Up To Day 95 )

Change in the last 10 days Arctic:

2016 Arctic Ice Loss or Gain Last 10 Days (Up To Day 95 )

Global

Global_Sea_Ice_Extent_Zoomed_2016_Day_95_1981-2010

Antarctic

Antarctic_Sea_Ice_Extent_Zoomed_2016_Day_95_1981-2010

Arctic

Arctic_Sea_Ice_Extent_Zoomed_2016_Day_95_1981-2010

South / North

Sea Ice Extent (Global Antarctic and Arctic) – Day 93 – 2016 (No Data Yet)

The data for day 93 has not been uploaded to the website. It is late.


South / North

Arctic Sea Ice Extent Since 2005 With 0 Shown on Y Axis

Arctic Sea Ice Extent By Month from 2005 with 0 shown on the Y axis. Red line shows an increasing ice trend.

Does this look like doom for the Arctic to you?

Average Arctic Sea Ice Extent by Month Since 2005


The latest South / North