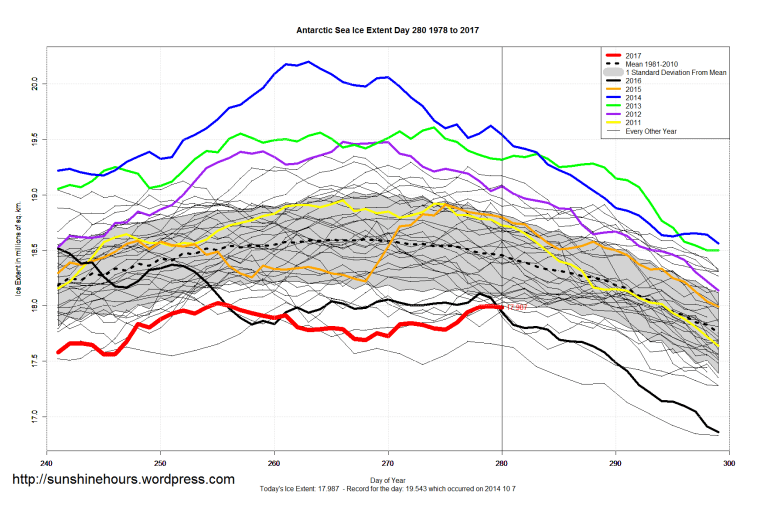
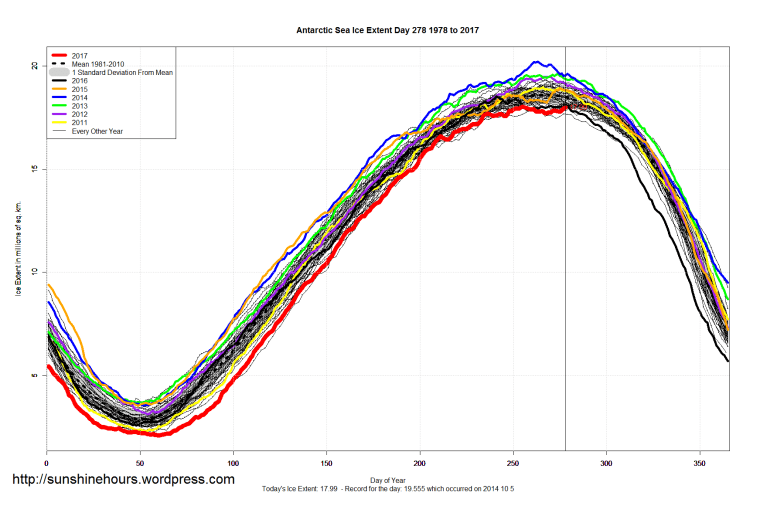
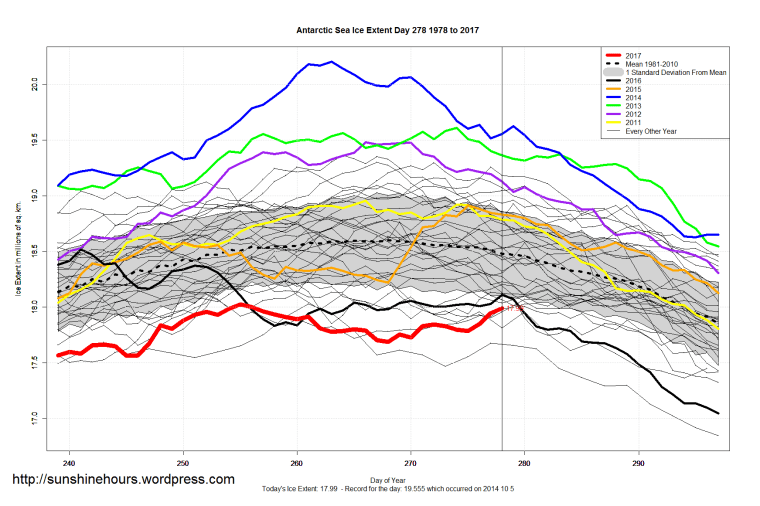
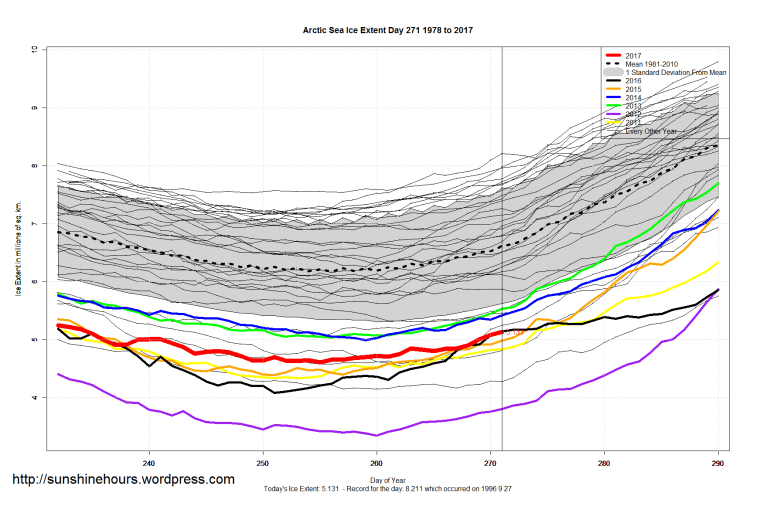
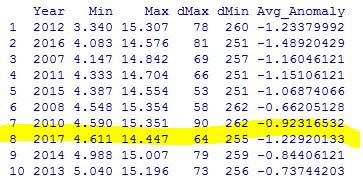
A late surge in Antarctica means 2017 won’t be the lowest maximum. That honor stays with 1986.
These are the Antarctica records for max and min sorted by max descending.
(Preliminary for 2017 because it may climb some more)
| Year | Min | Max | day Max | day Min | Avg Anomaly |
| 2014 | 3.548 | 20.201 | 263 | 52 | 1.146198915341 |
| 2013 | 3.679 | 19.608 | 274 | 50 | 0.893678367396 |
| 2012 | 3.111 | 19.478 | 266 | 54 | 0.387147239929 |
| 2006 | 2.487 | 19.36 | 264 | 51 | -0.169014783289 |
| 2009 | 2.671 | 19.299 | 267 | 53 | 0.418664668766 |
| 2005 | 2.804 | 19.295 | 272 | 49 | 0.064952339999 |
| 1998 | 2.772 | 19.244 | 258 | 56 | 0.108445490684 |
| 2000 | 2.582 | 19.159 | 272 | 49 | 0.129936857415 |
| 2004 | 3.259 | 19.124 | 252 | 51 | 0.344207349218 |
| 1980 | 2.521 | 19.092 | 267 | 57 | -0.380114783289 |
| 2007 | 2.723 | 19.086 | 272 | 50 | 0.057179737259 |
| 2010 | 2.842 | 18.998 | 249 | 47 | 0.476864668766 |
| 1999 | 2.707 | 18.981 | 273 | 51 | 0.130755079725 |
| 2011 | 2.319 | 18.954 | 266 | 53 | -0.129354509316 |
| 1985 | 2.602 | 18.931 | 254 | 50 | -0.009151681391 |
| 2015 | 3.544 | 18.912 | 275 | 49 | 0.784128253241 |
| 1981 | 2.694 | 18.856 | 261 | 51 | -0.200536701097 |
| 1996 | 2.597 | 18.831 | 267 | 56 | 0.151838496759 |
| 1994 | 3.083 | 18.827 | 243 | 43 | 0.144042750958 |
| 1983 | 2.843 | 18.811 | 263 | 55 | -0.247642180549 |
| 1997 | 2.264 | 18.792 | 265 | 58 | -0.239875057261 |
| 1988 | 2.639 | 18.785 | 277 | 55 | -0.119385162225 |
| 1995 | 3.33 | 18.762 | 269 | 55 | 0.164829052328 |
| 1993 | 2.281 | 18.71 | 263 | 50 | -0.209987386028 |
| 2003 | 3.626 | 18.68 | 268 | 48 | 0.339360559177 |
| 1991 | 2.554 | 18.671 | 273 | 58 | -0.085053139453 |
| 1982 | 2.89 | 18.55 | 246 | 54 | 0.016407547259 |
| 1987 | 3.01 | 18.524 | 258 | 52 | -0.184921590324 |
| 2016 | 2.578 | 18.518 | 241 | 48 | -0.46177898958 |
| 2001 | 3.441 | 18.494 | 271 | 50 | 0.042697545478 |
| 1992 | 2.492 | 18.467 | 255 | 54 | -0.218672432202 |
| 1990 | 2.784 | 18.379 | 273 | 53 | -0.220332591508 |
| 1984 | 2.382 | 18.37 | 266 | 58 | -0.168233781332 |
| 1979 | 2.911 | 18.361 | 256 | 48 | 0.078581100978 |
| 2008 | 3.692 | 18.298 | 247 | 51 | 0.622117185284 |
| 1989 | 2.723 | 18.274 | 266 | 51 | -0.204247660001 |
| 2002 | 2.697 | 18.116 | 252 | 51 | -0.408318892878 |
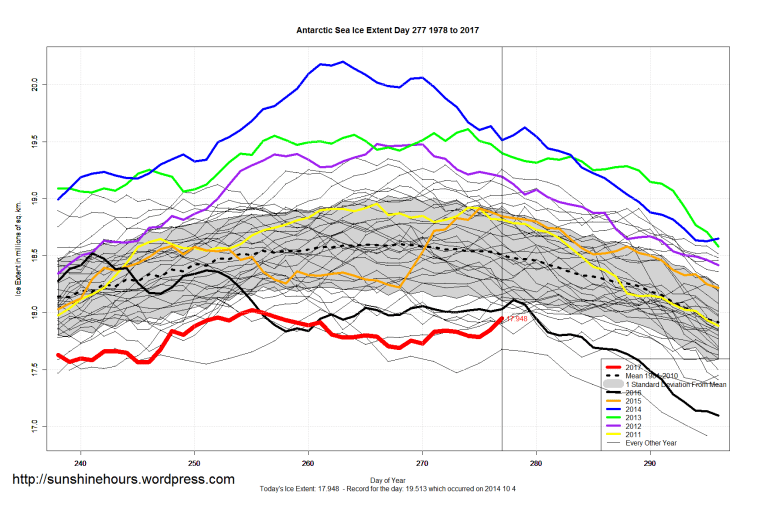
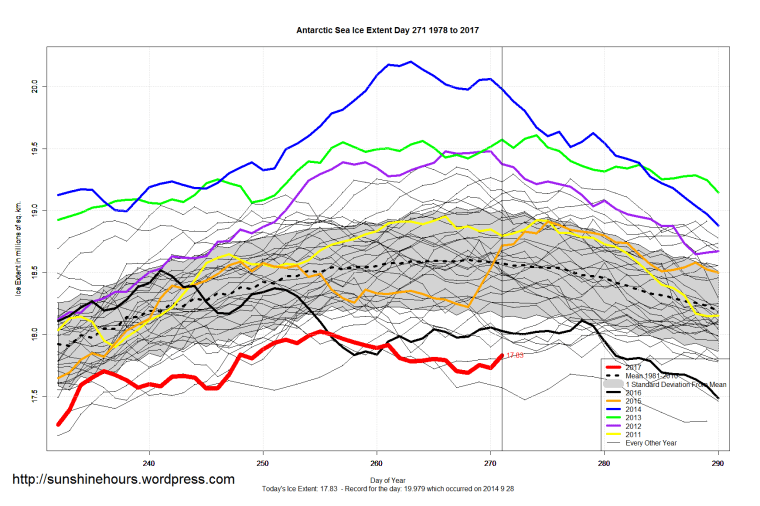
| 2017 | 2.075 | 18.06 | 281 | 60 | |
| 1986 | 2.953 | 18.027 | 261 | 65 | -0.548503824385 |