Antarctic Sea Ice Extent Aug 21 2014 – 1,135,000 sq km above the 1981-2010 mean. Data for Day 232. Data here.
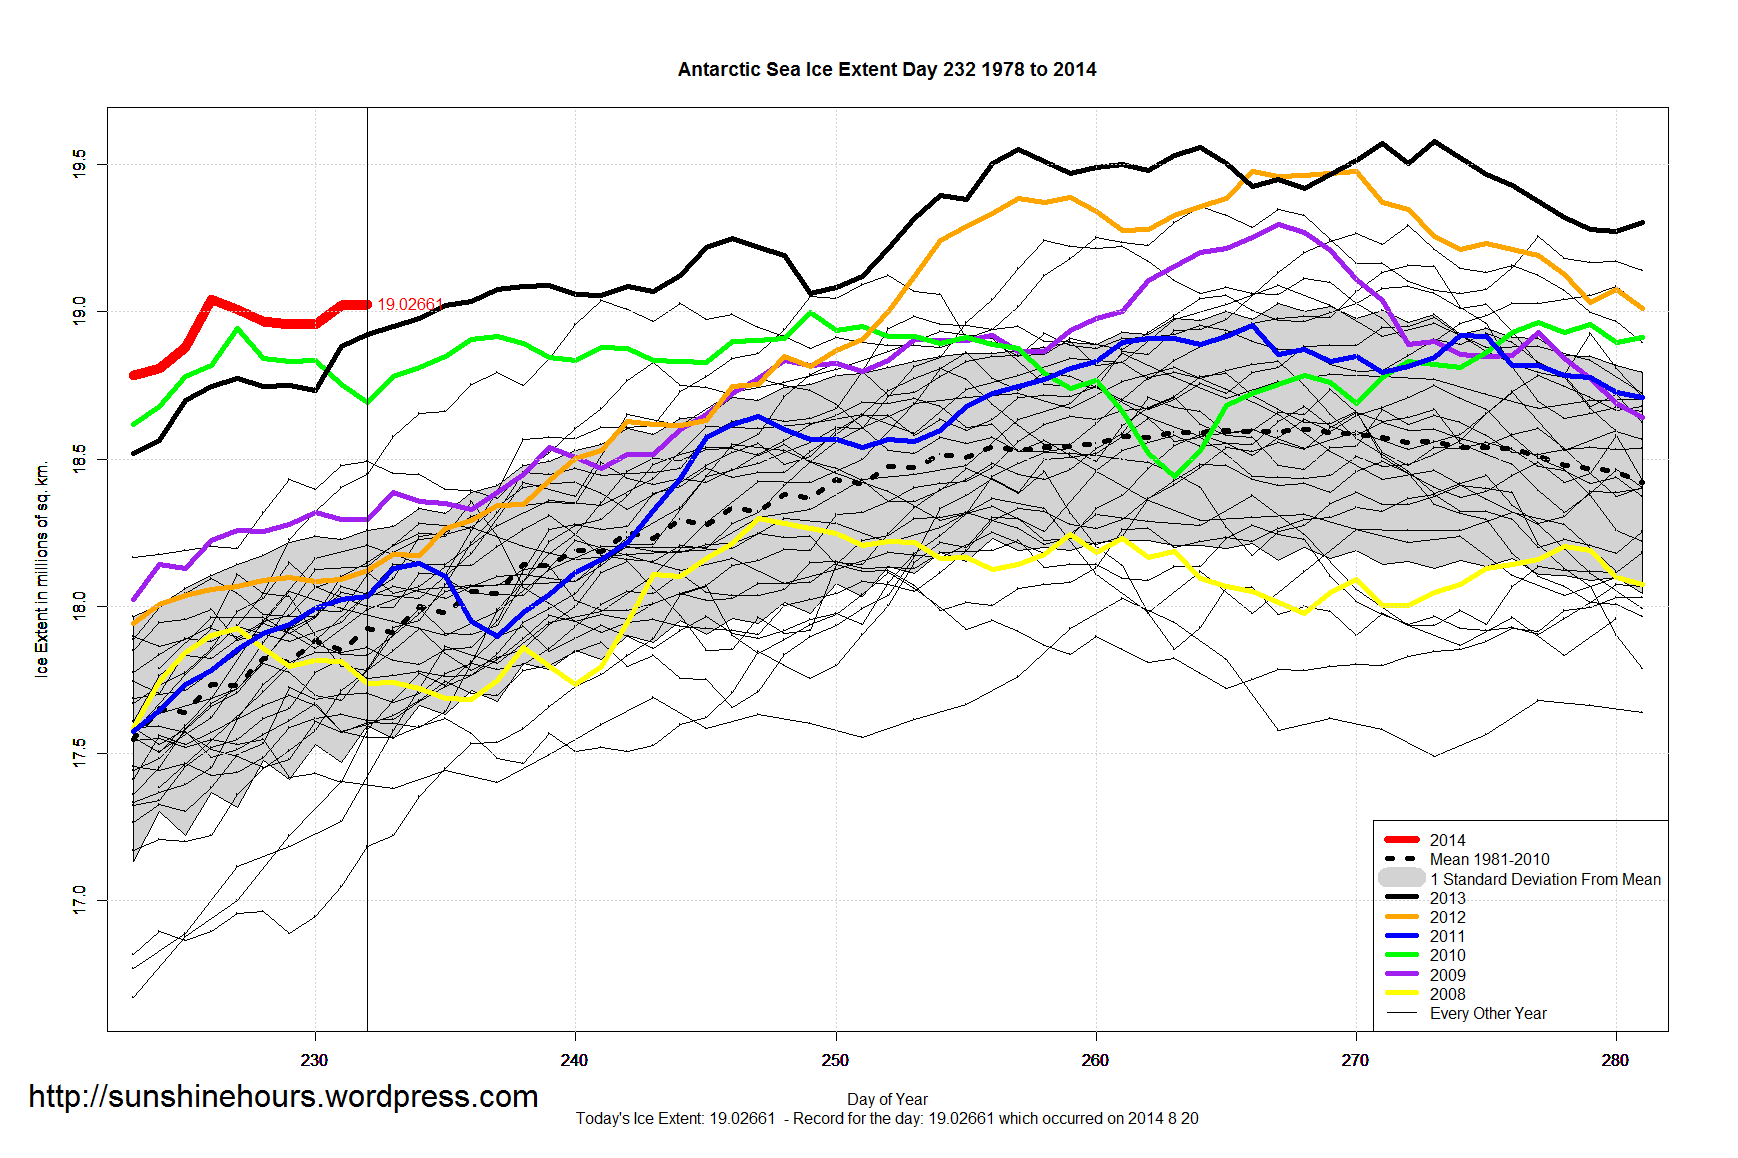

Antarctic Sea Ice Extent Aug 21 2014 – 1,135,000 sq km above the 1981-2010 mean. Data for Day 232. Data here.
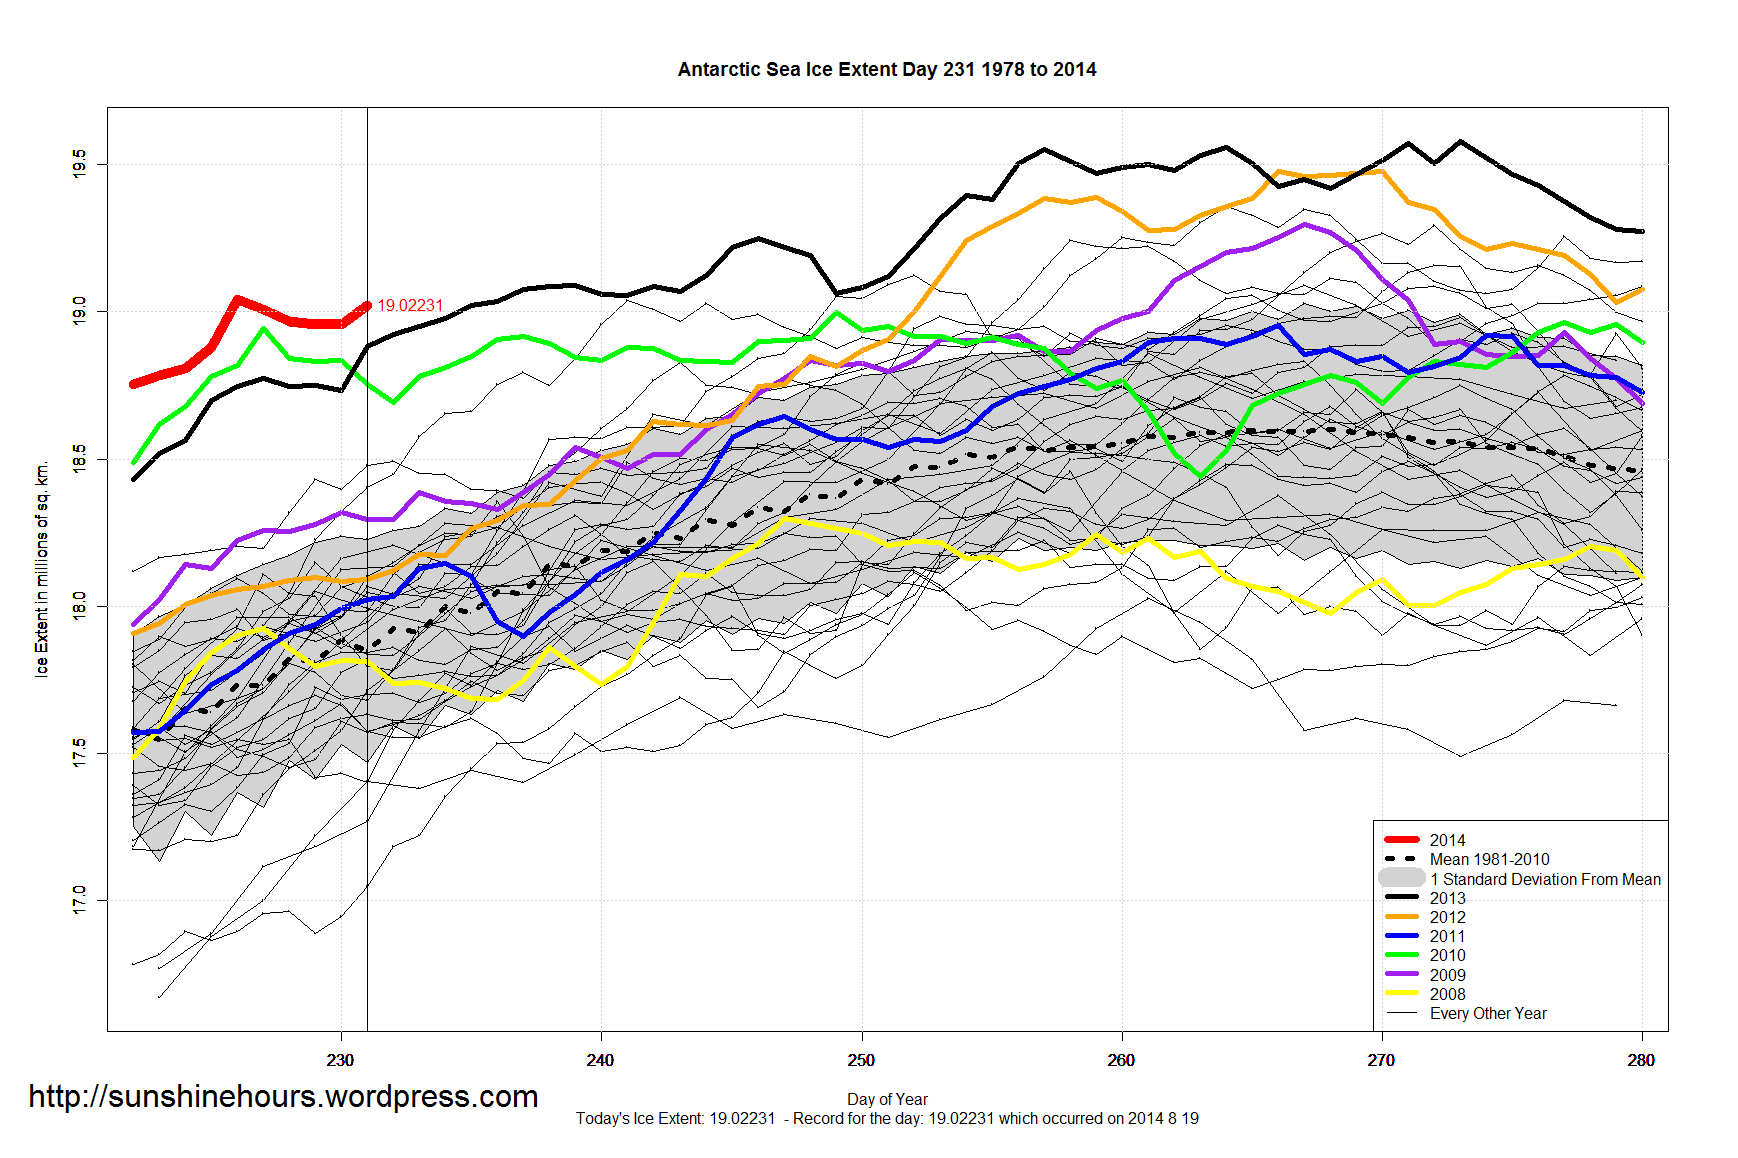
Antarctic Sea Ice Extent Aug 20 2014 – 1,156,000 sq km above the 1981-2010 mean. Data for Day 231. Data here.
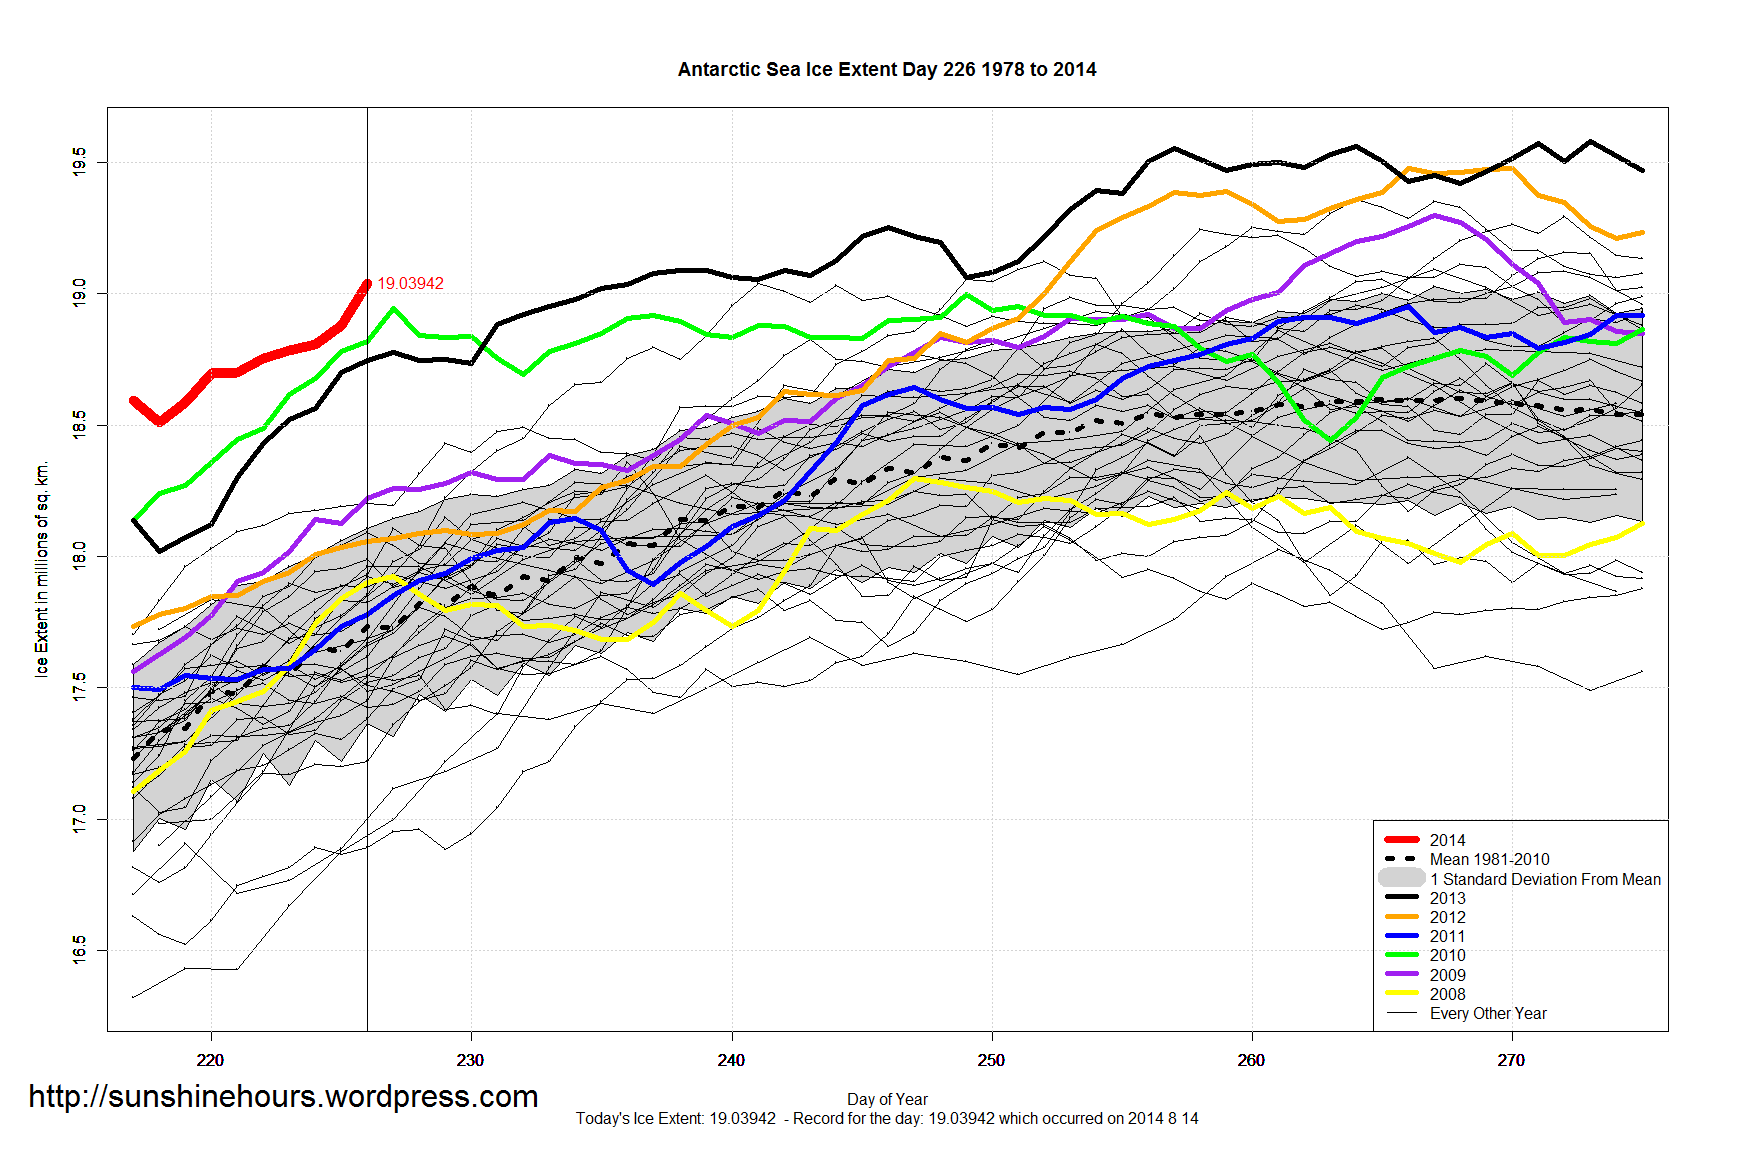
I forgot to mention that 2014 was the earliest to hit 19 million sq km by 9 days on Aug 14.

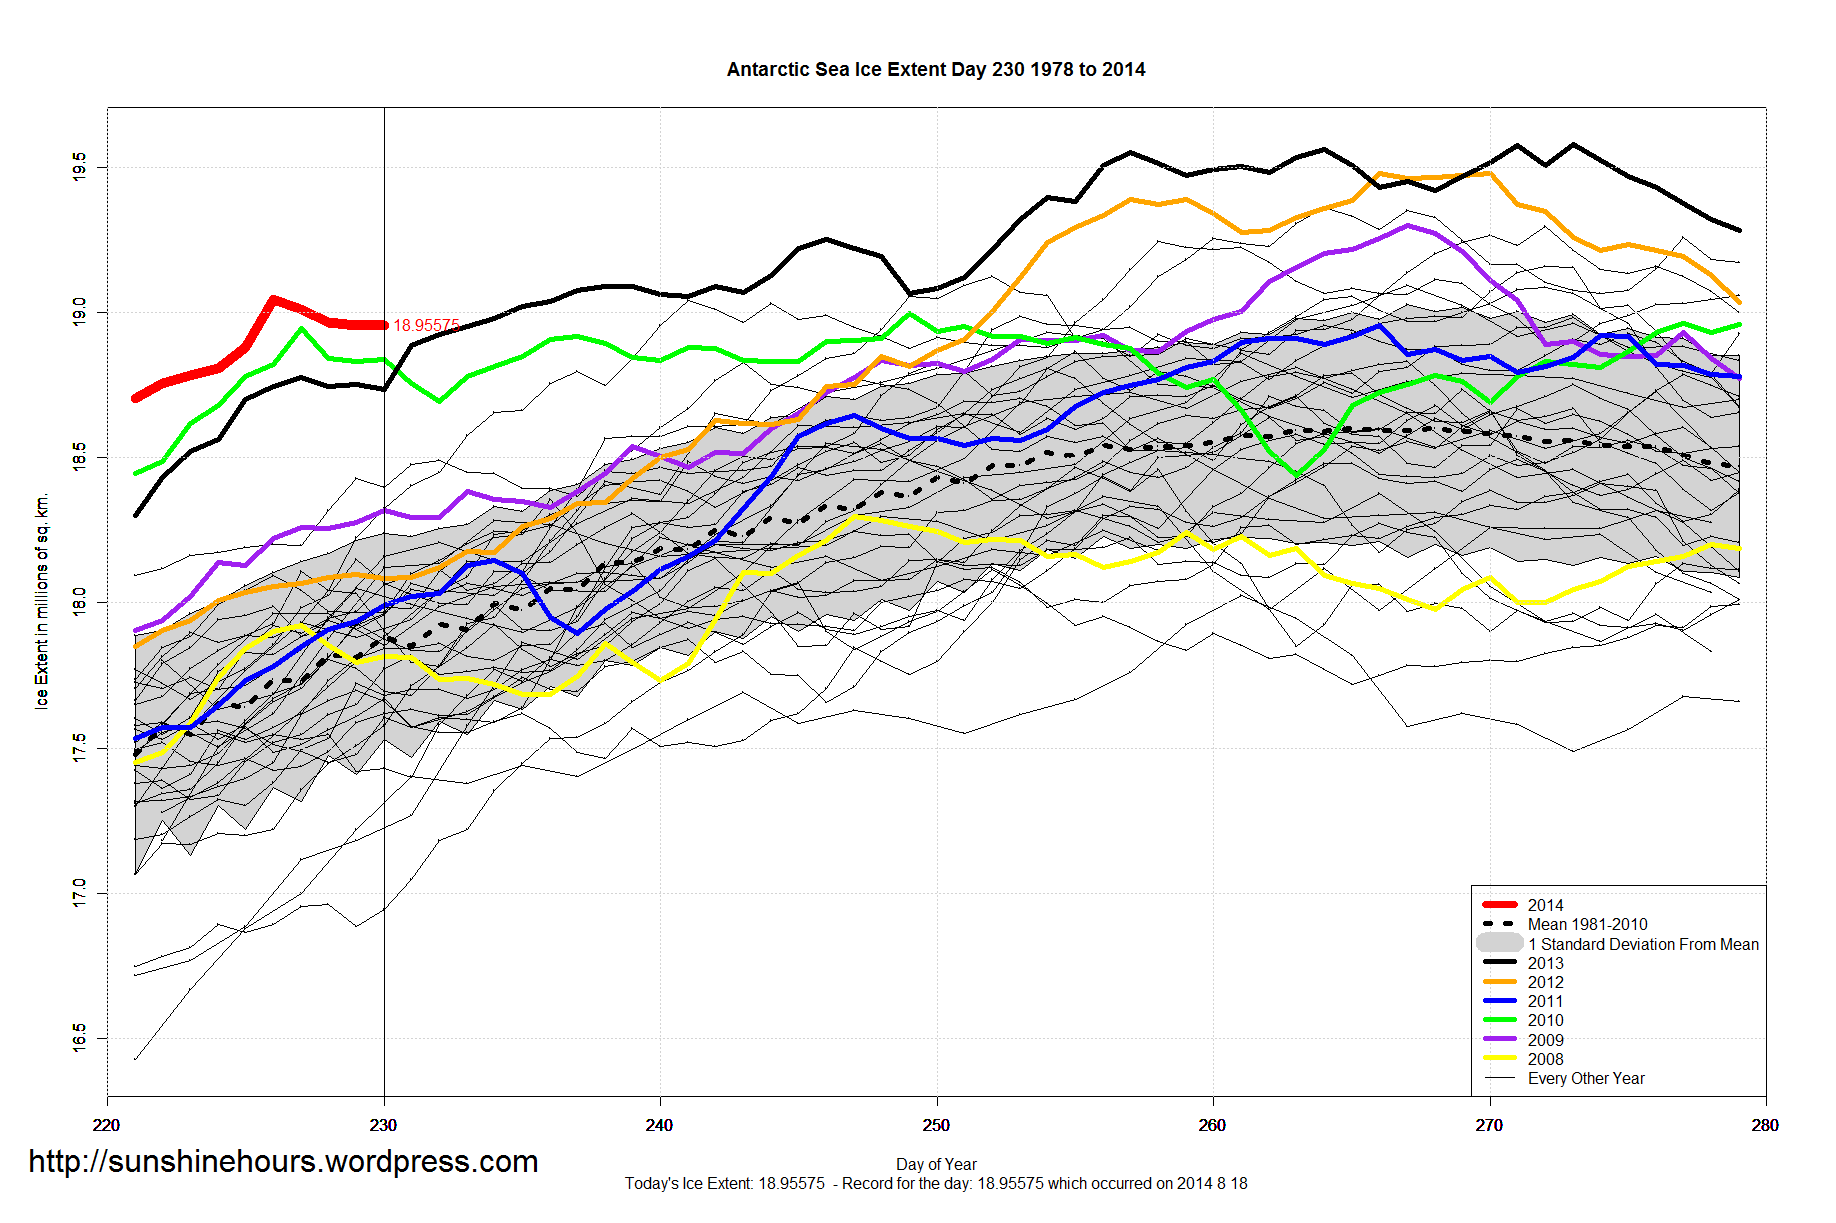
Antarctic Sea Ice Extent Aug 19 2014 – 1,108,000 sq km above the 1981-2010 mean. Data for Day 230. Data here.
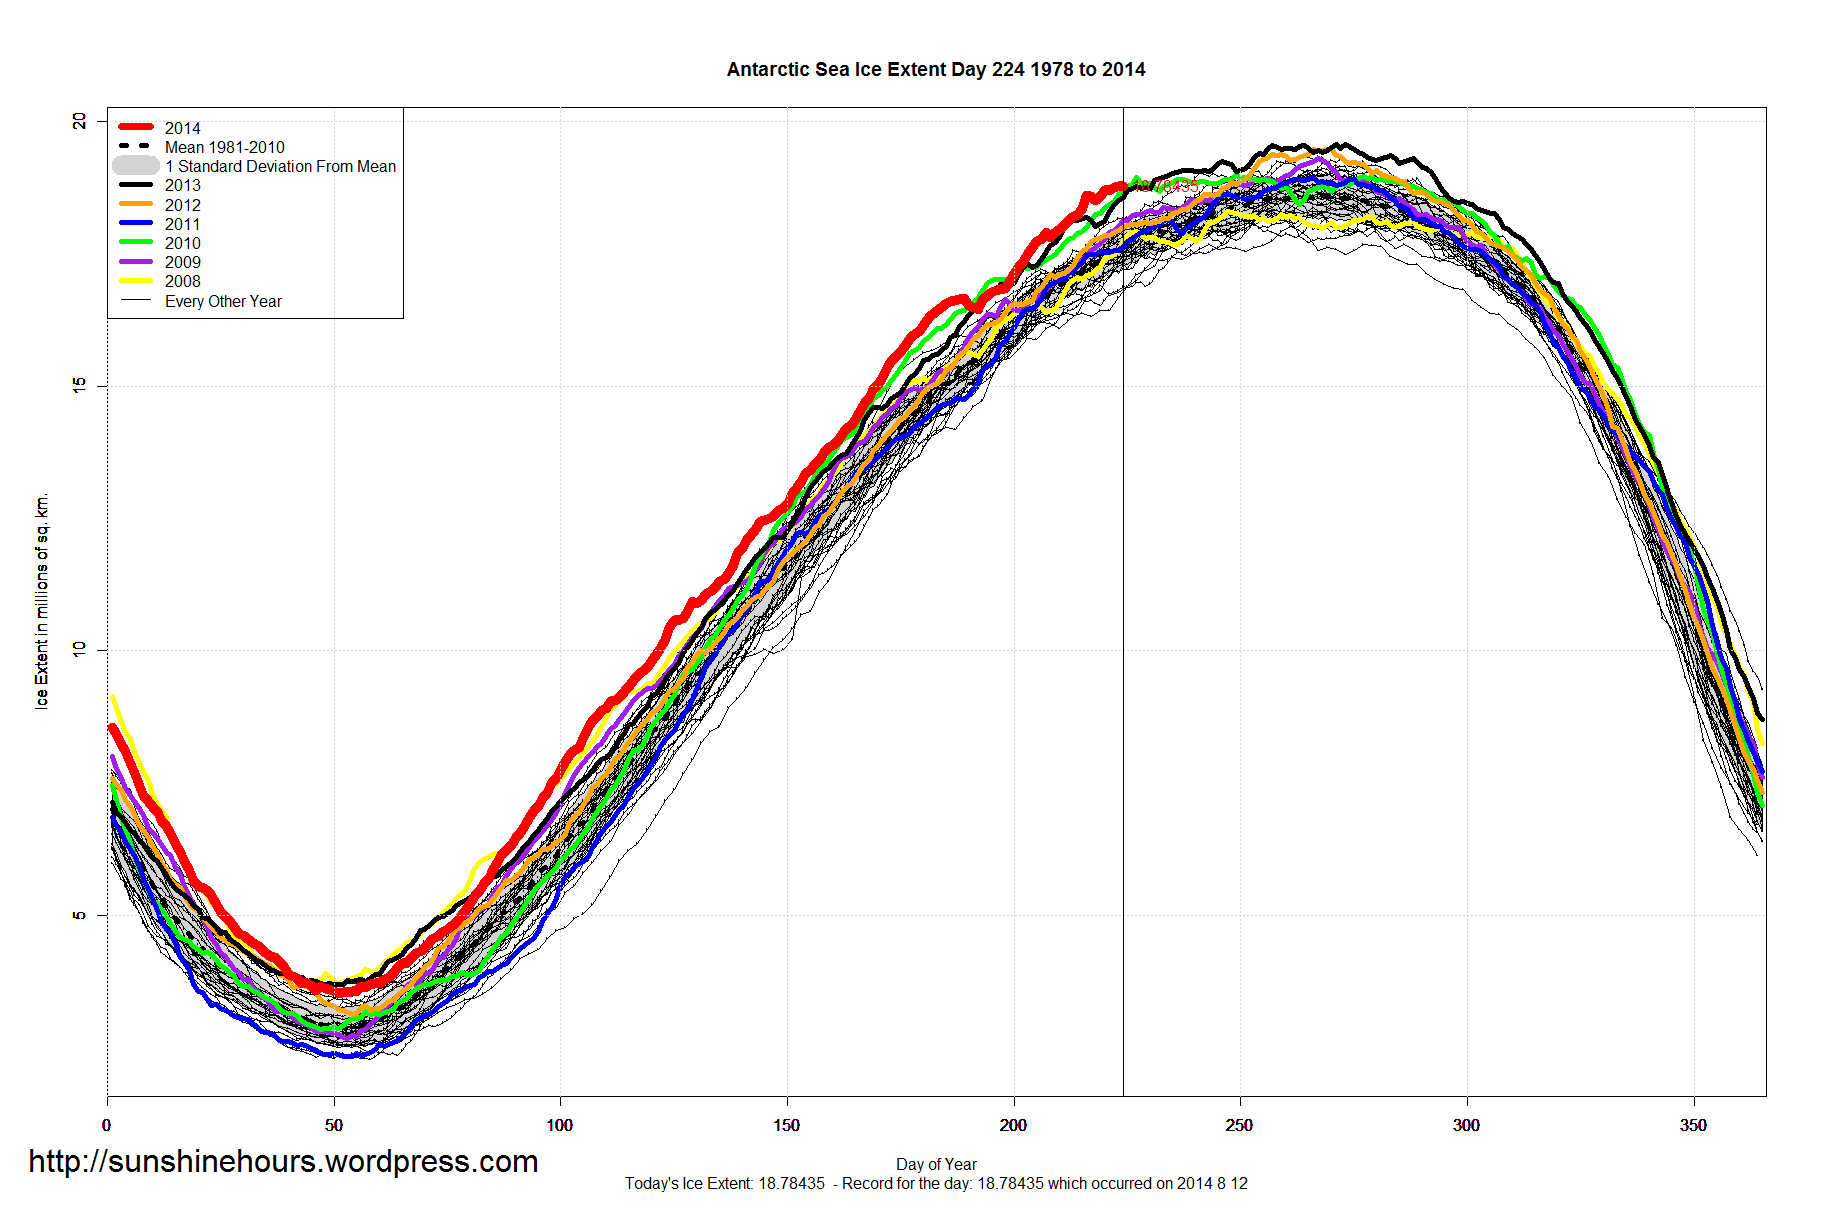
Not sure … will 2014 follow the black line or the green line?

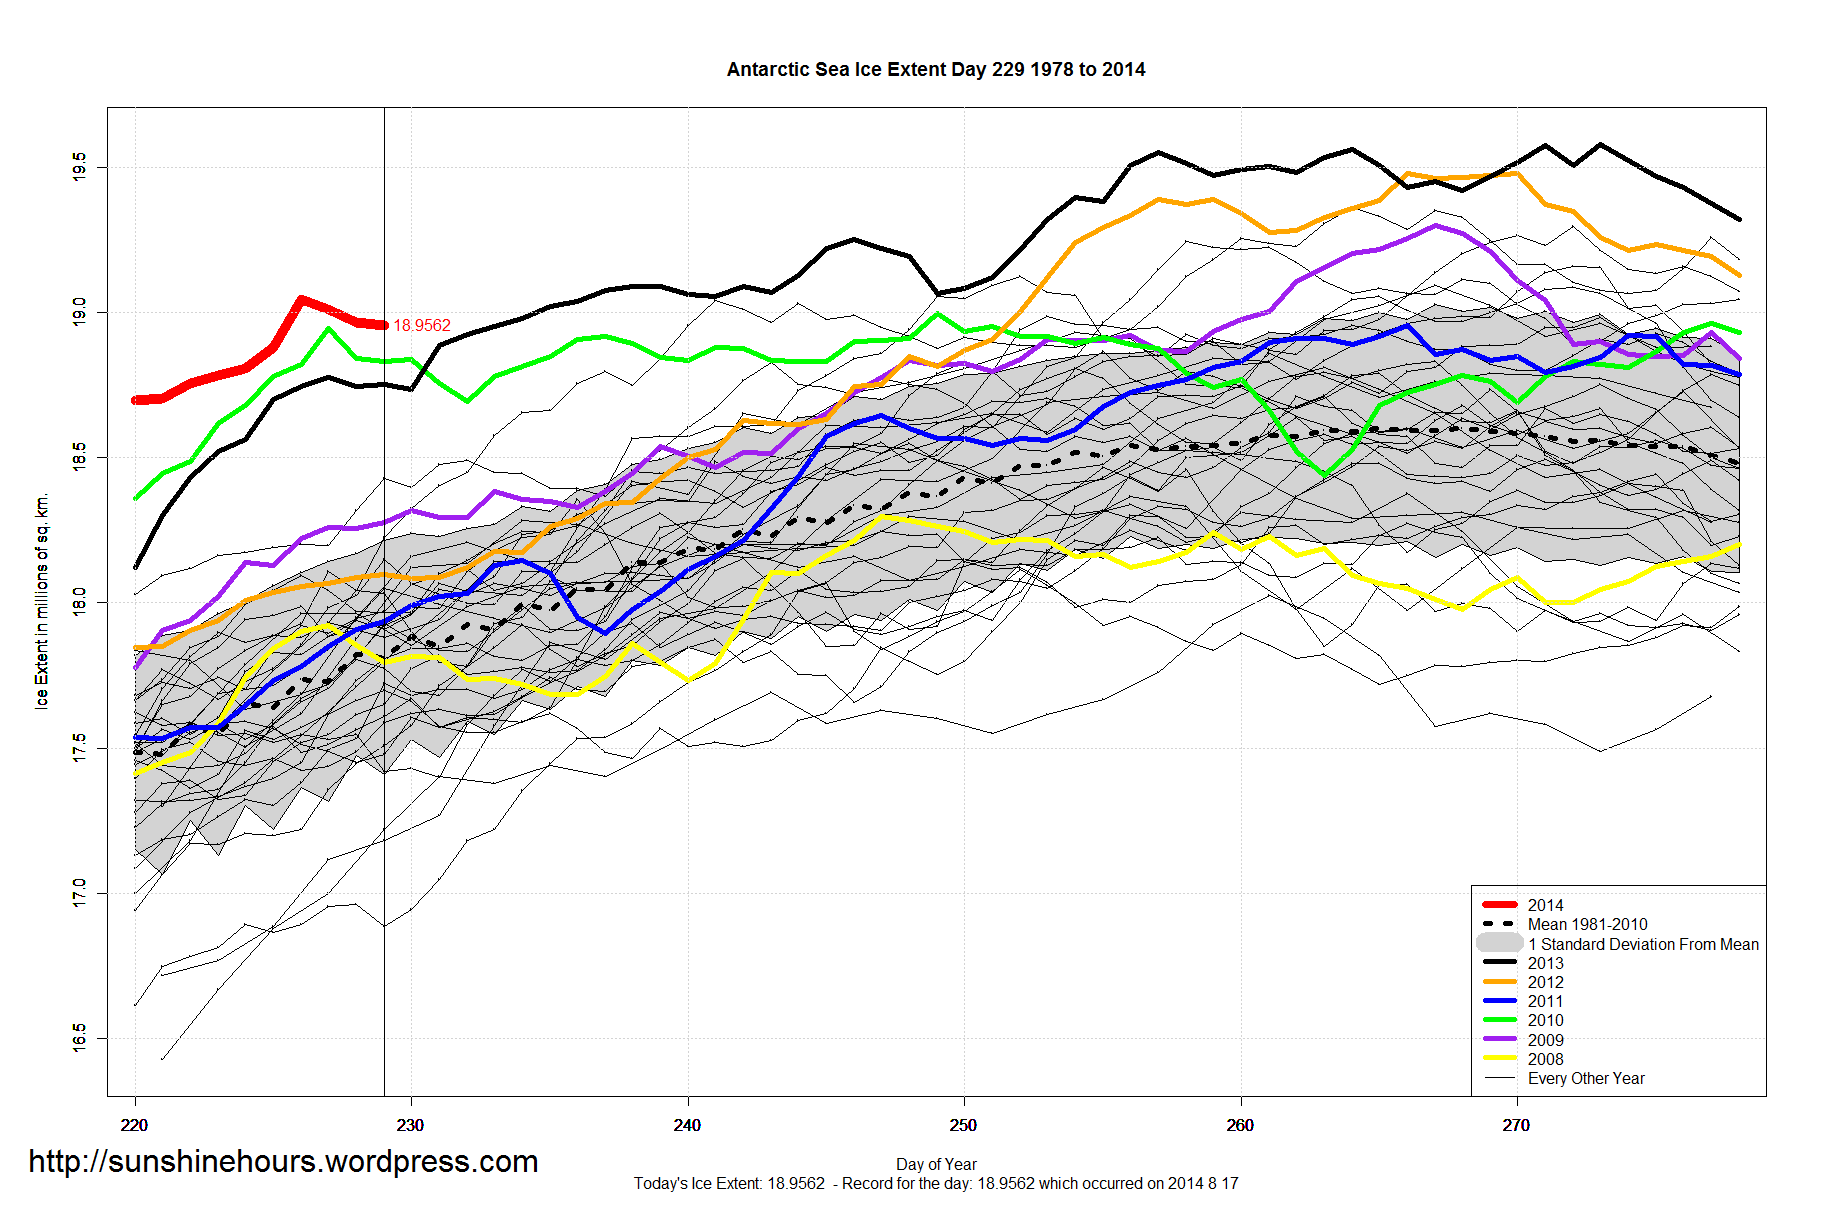
Antarctic Sea Ice Extent Aug 18 2014 – 1,132,000 sq km above the 1981-2010 mean. Data for Day 229. Data here.

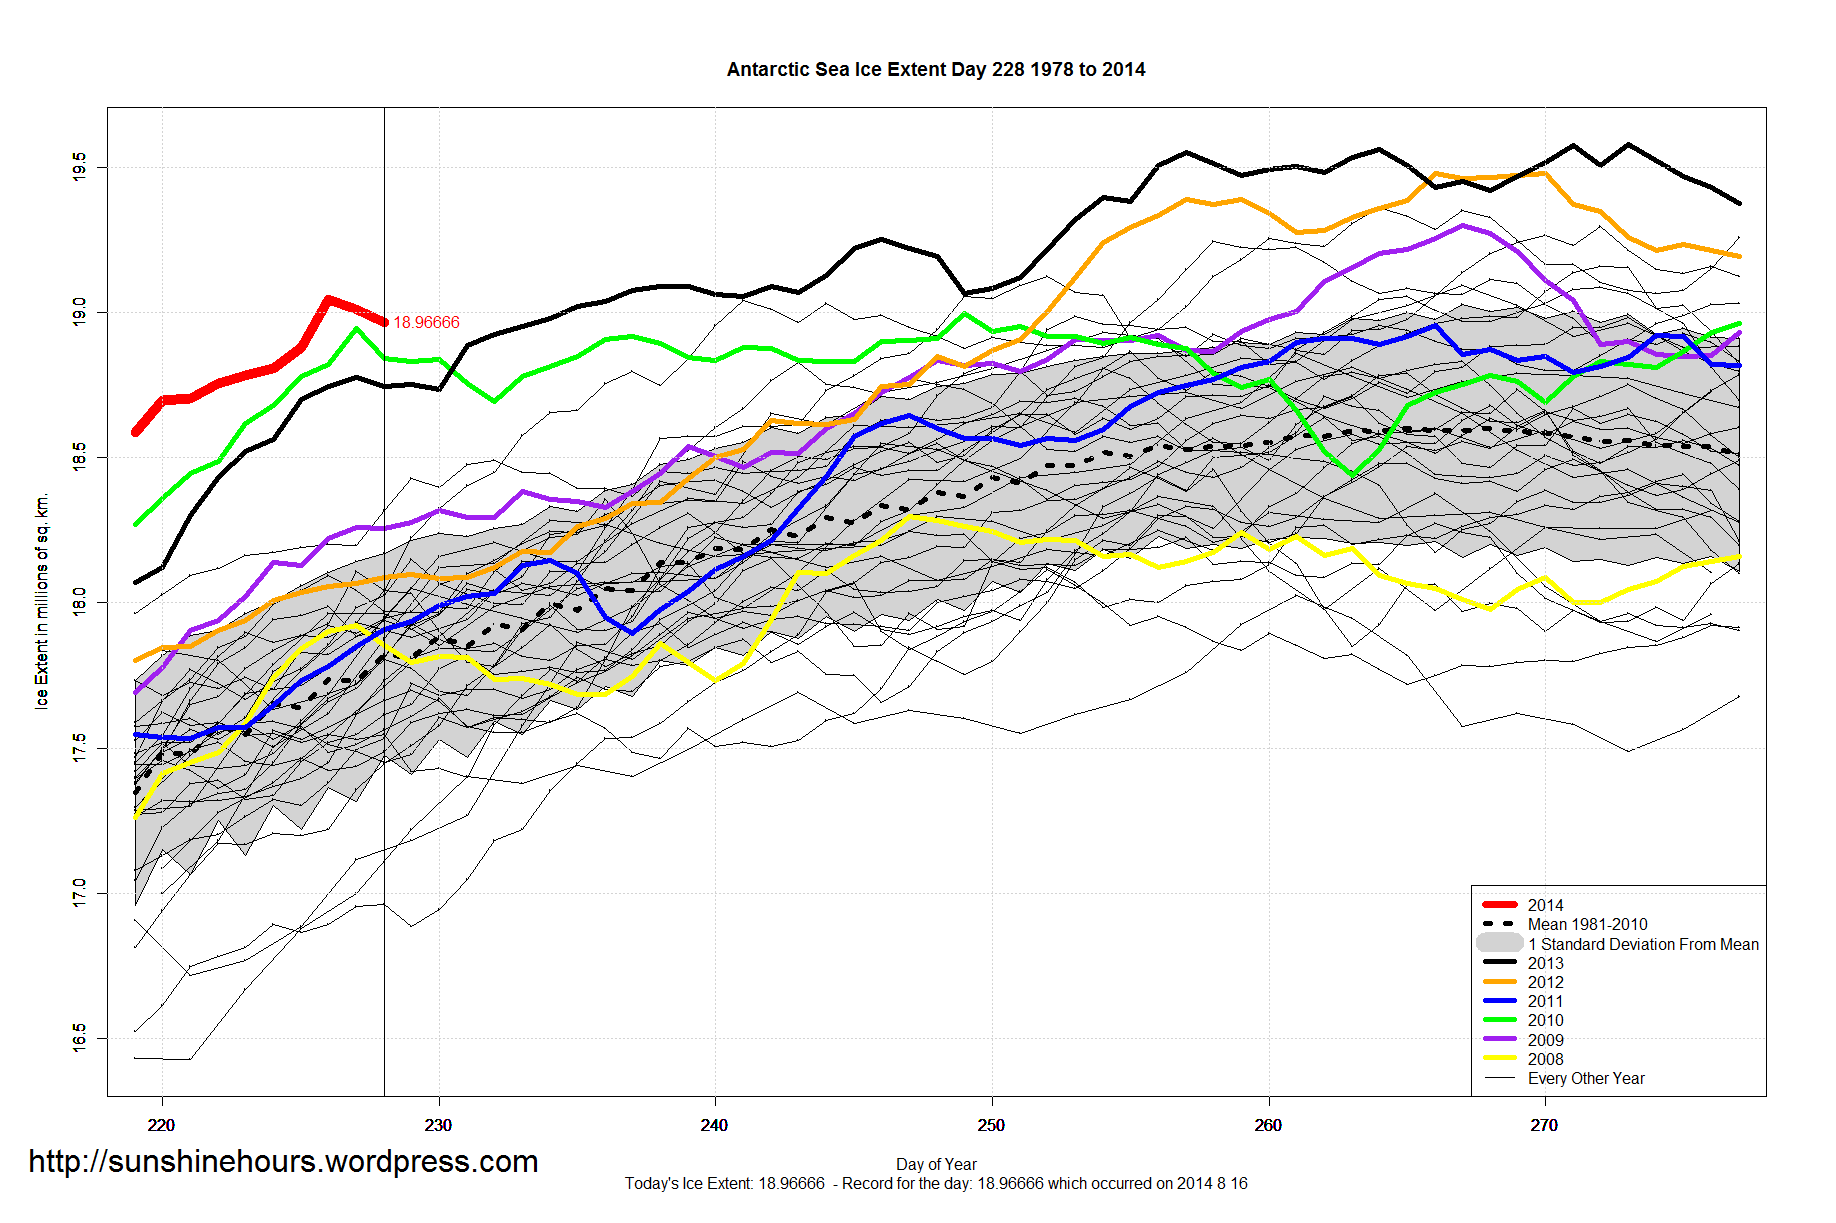
Antarctic Sea Ice Extent Aug 17 2014 – 1,186,000 sq km above the 1981-2010 mean. Data for Day 228. Data here.

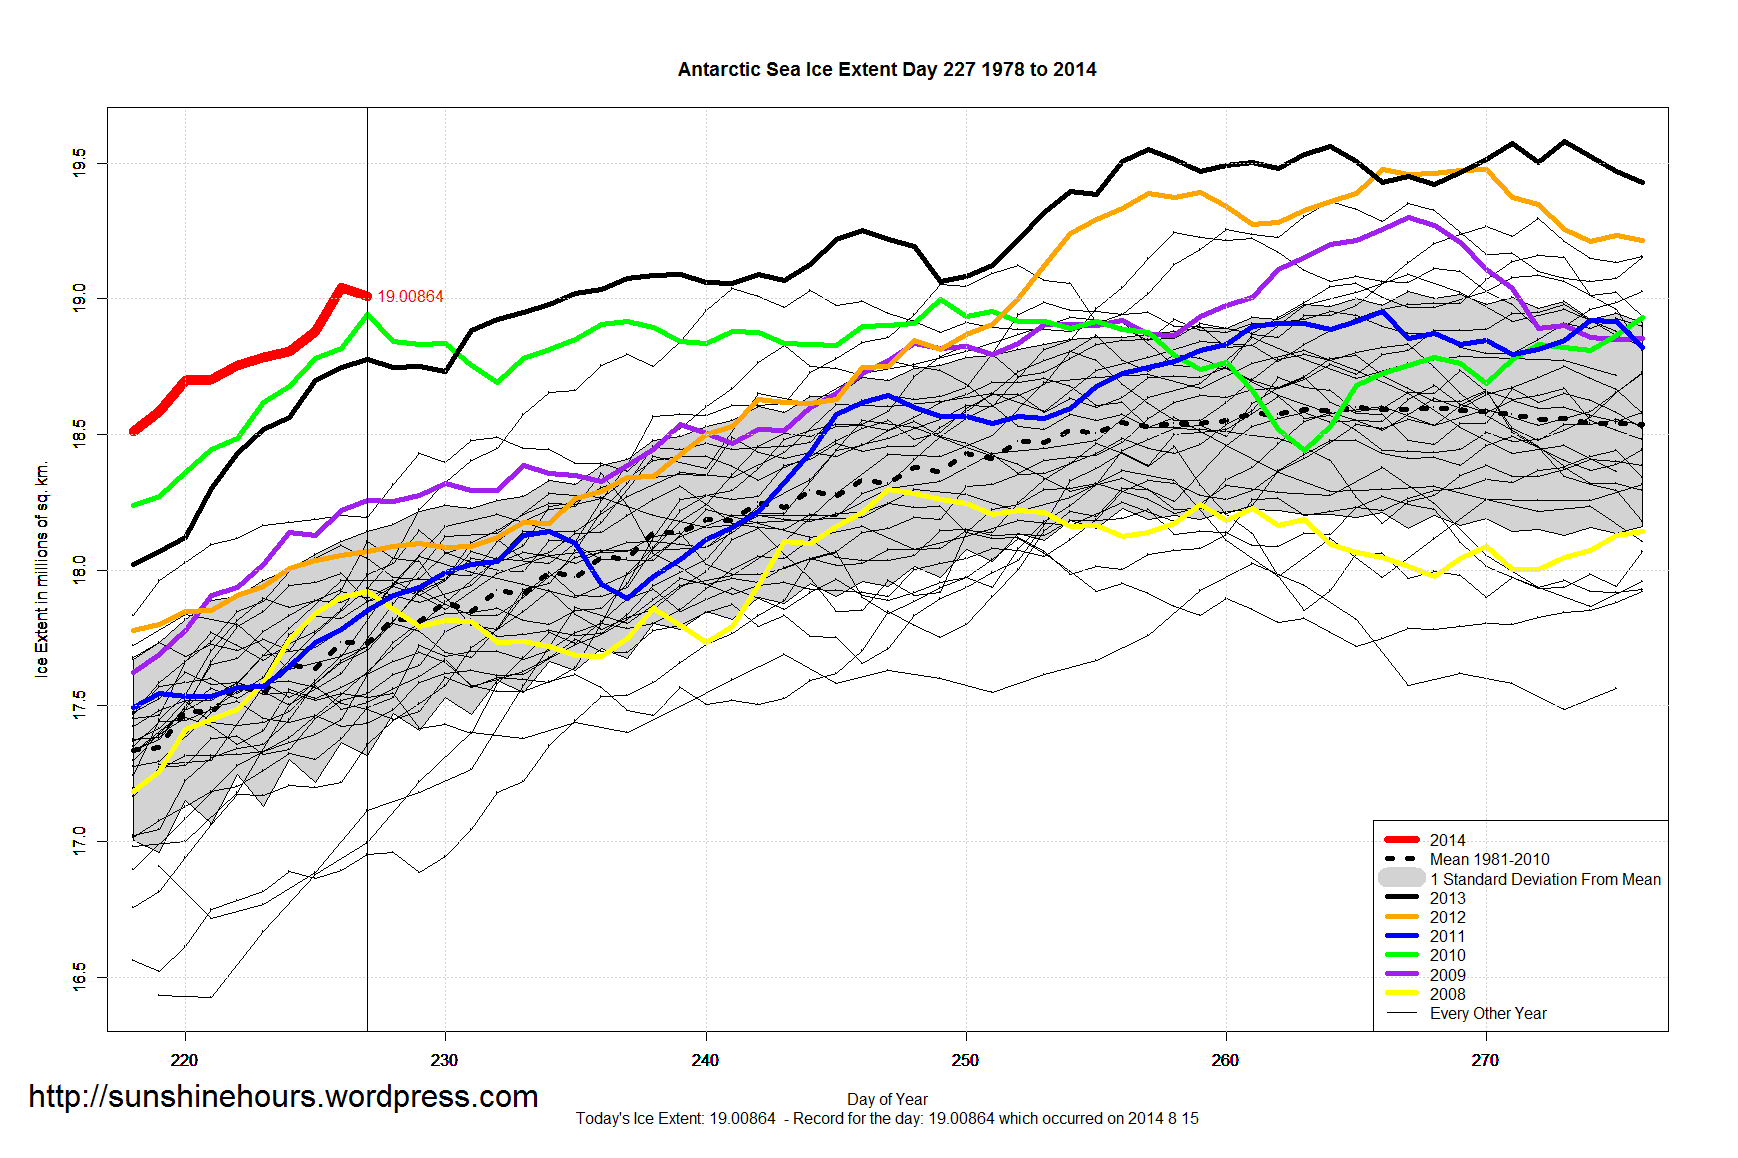
Antarctic Sea Ice Extent Aug 16 2014 – 1,271,000 sq km above the 1981-2010 mean. Data for Day 227. Data here.

Antarctic Sea Ice Extent is 1,354,000 sq km above the 1981-2010 mean. 148th daily record.

Antarctic Sea Ice Extent is 1,187,000 sq km above the 1981-2010 mean.
In 2010 (green line) , despite smashing previous records, the sea ice tailed away to normal levels. And in 2013 (black line), sea ice went on to break 2012’s record and then broke it again and again until it peaked on Sep 30.
So I make no predictions.
Antarctic Sea Ice Extent is 1,233,000 sq km above the 1981-2010 mean. That is the 145th daily record for 2014.

Antarctic Sea Ice Extent is 1,239,000 sq km above the 1981-2010 mean. That is the 144th daily record for 2014.

