
Tag: Global Sea Ice Extent
Sea Ice Day 302
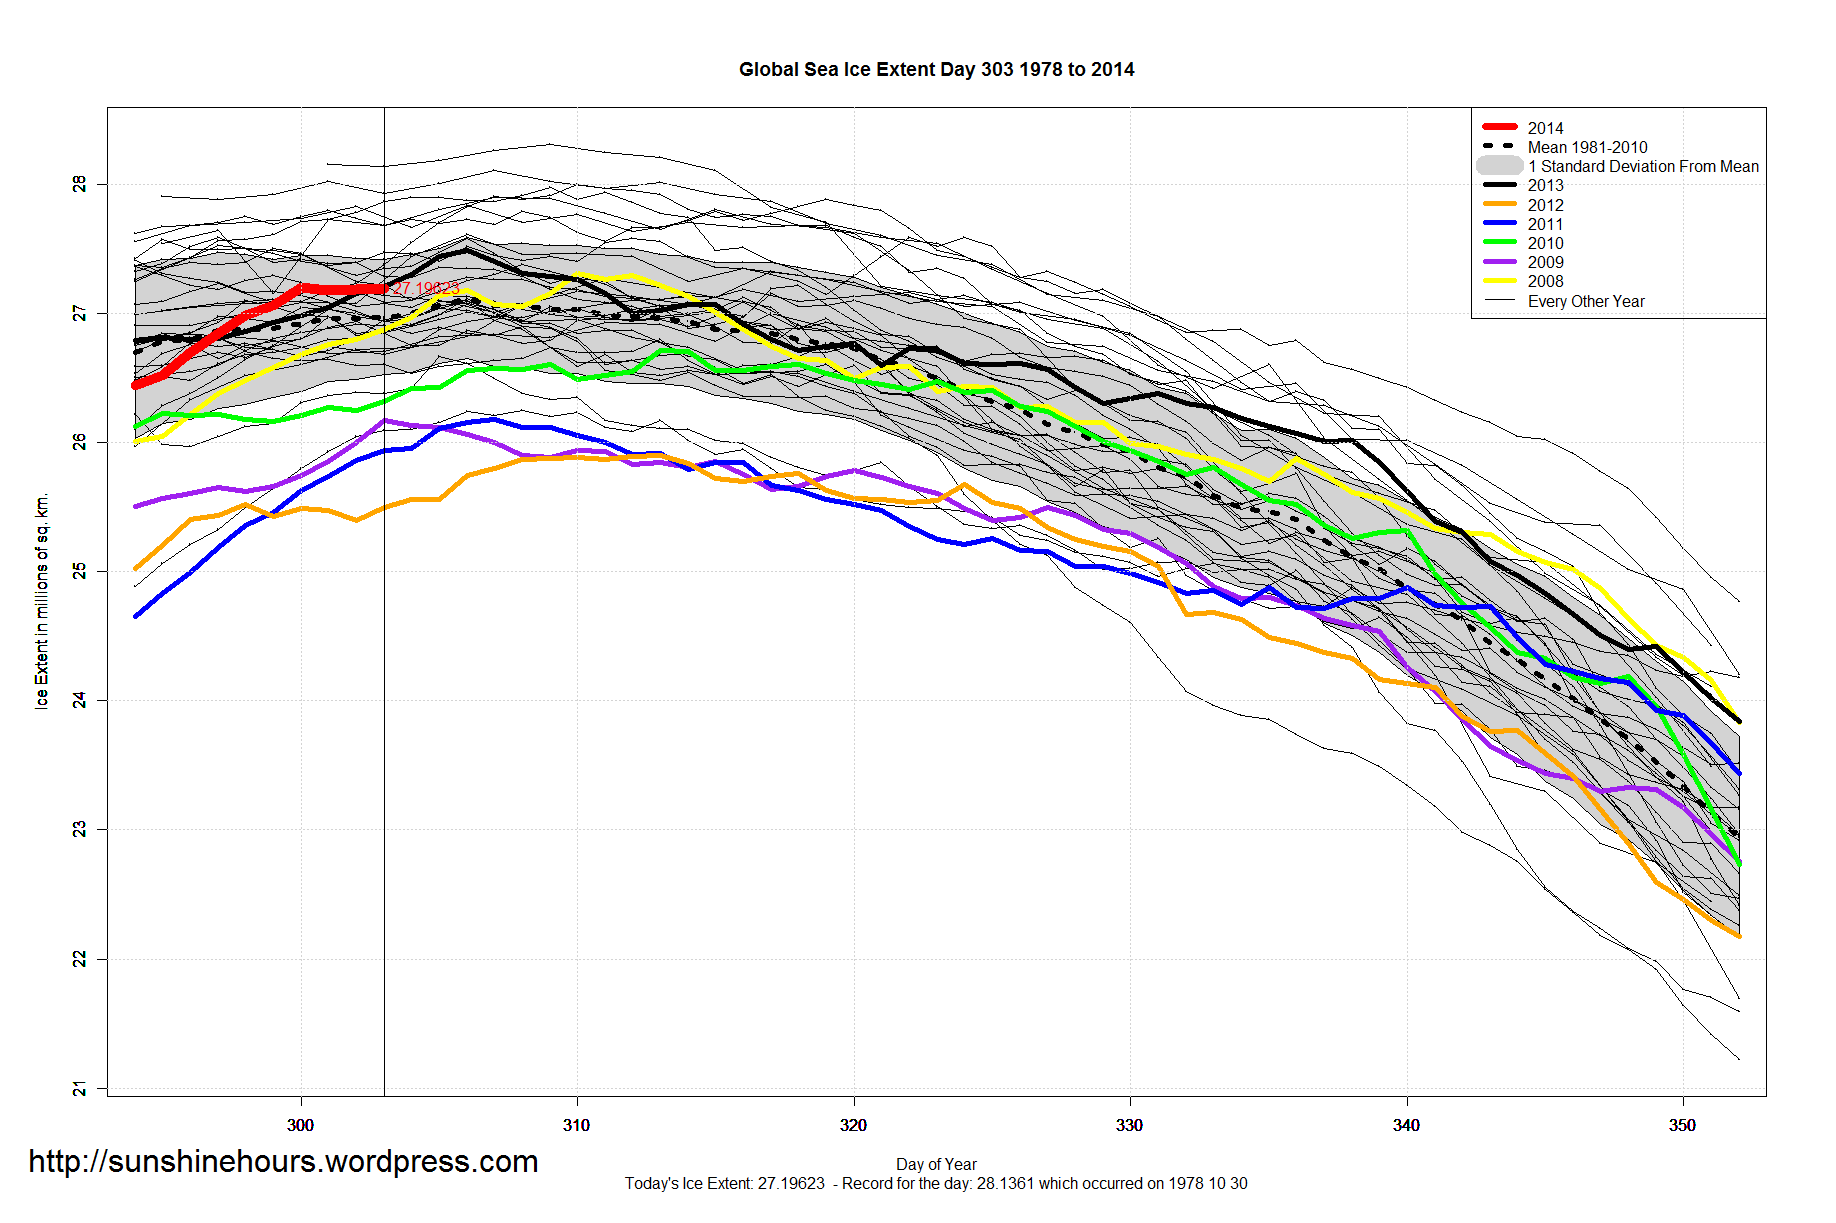
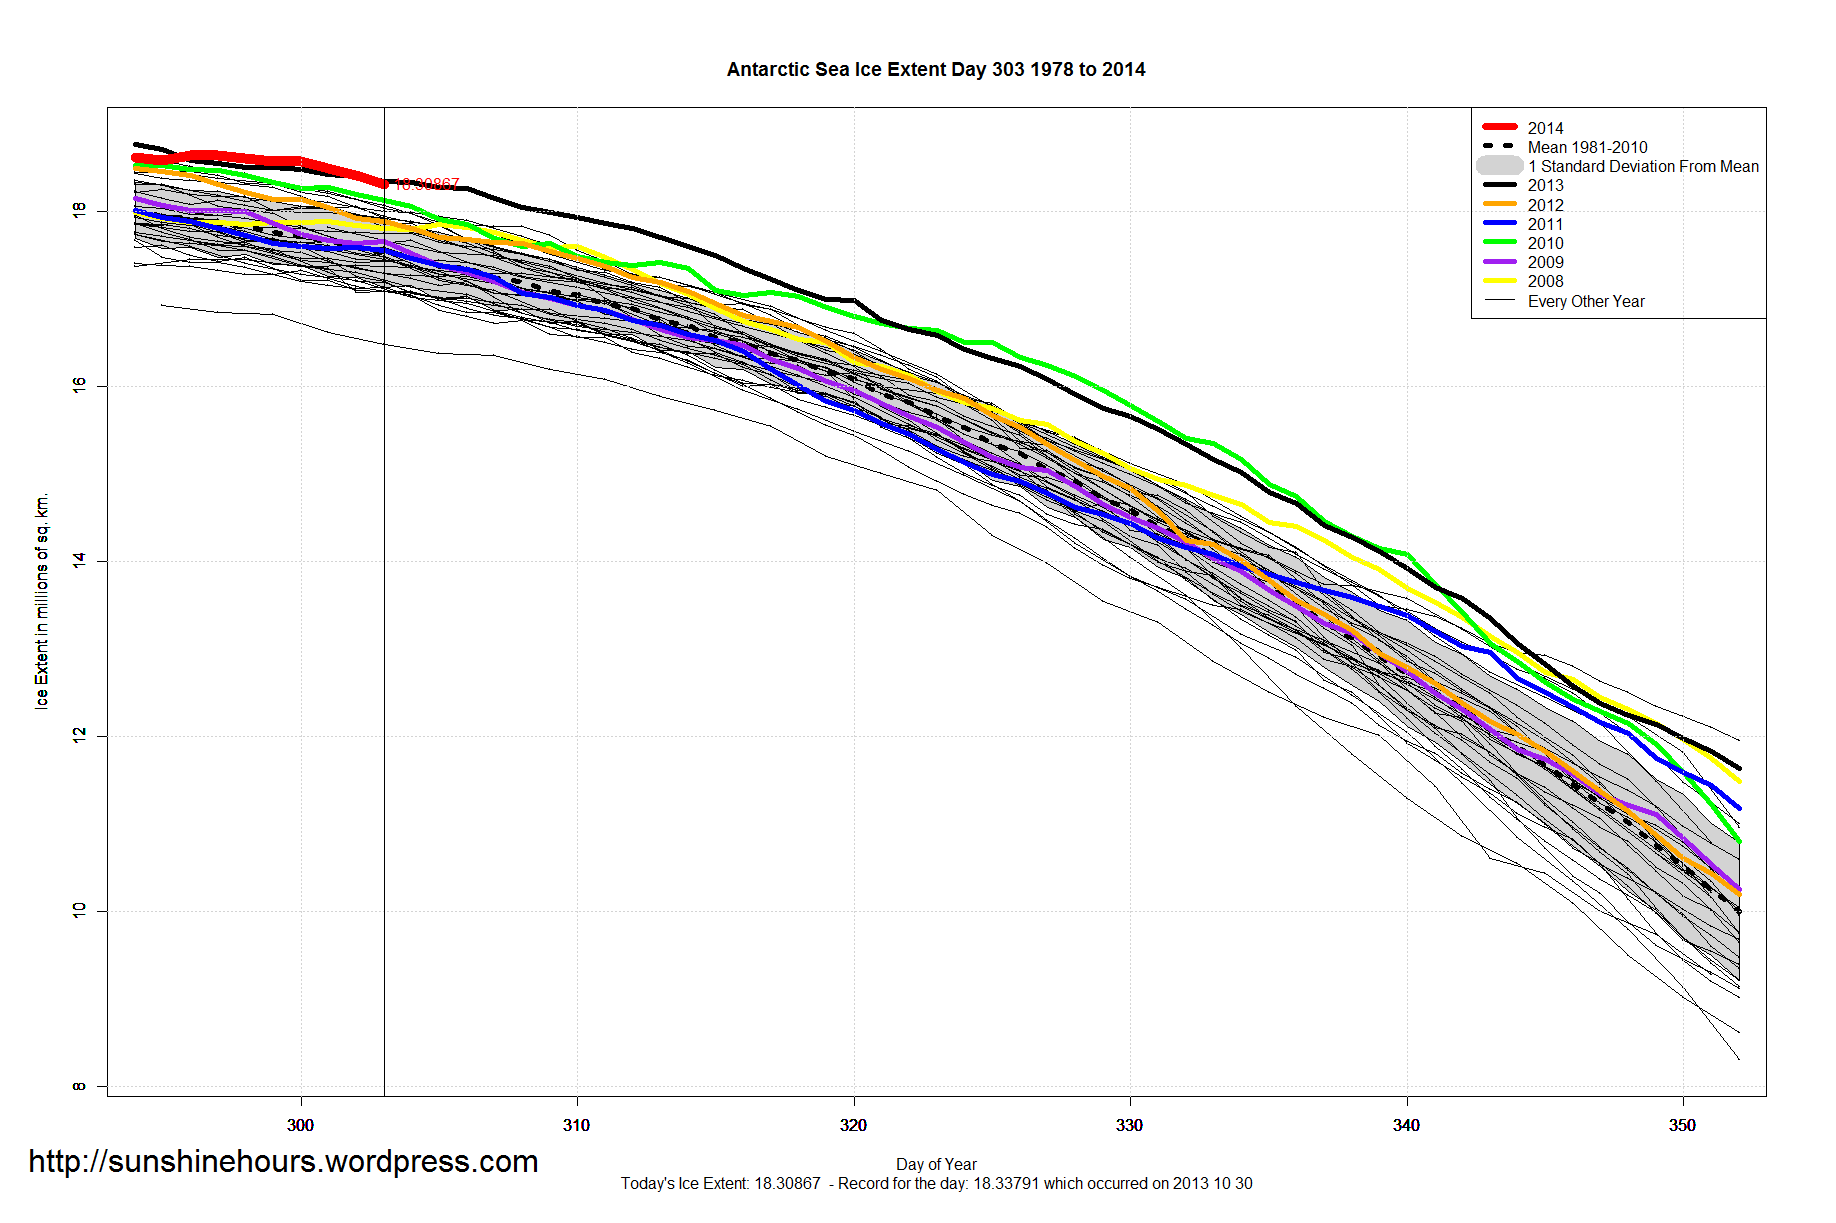
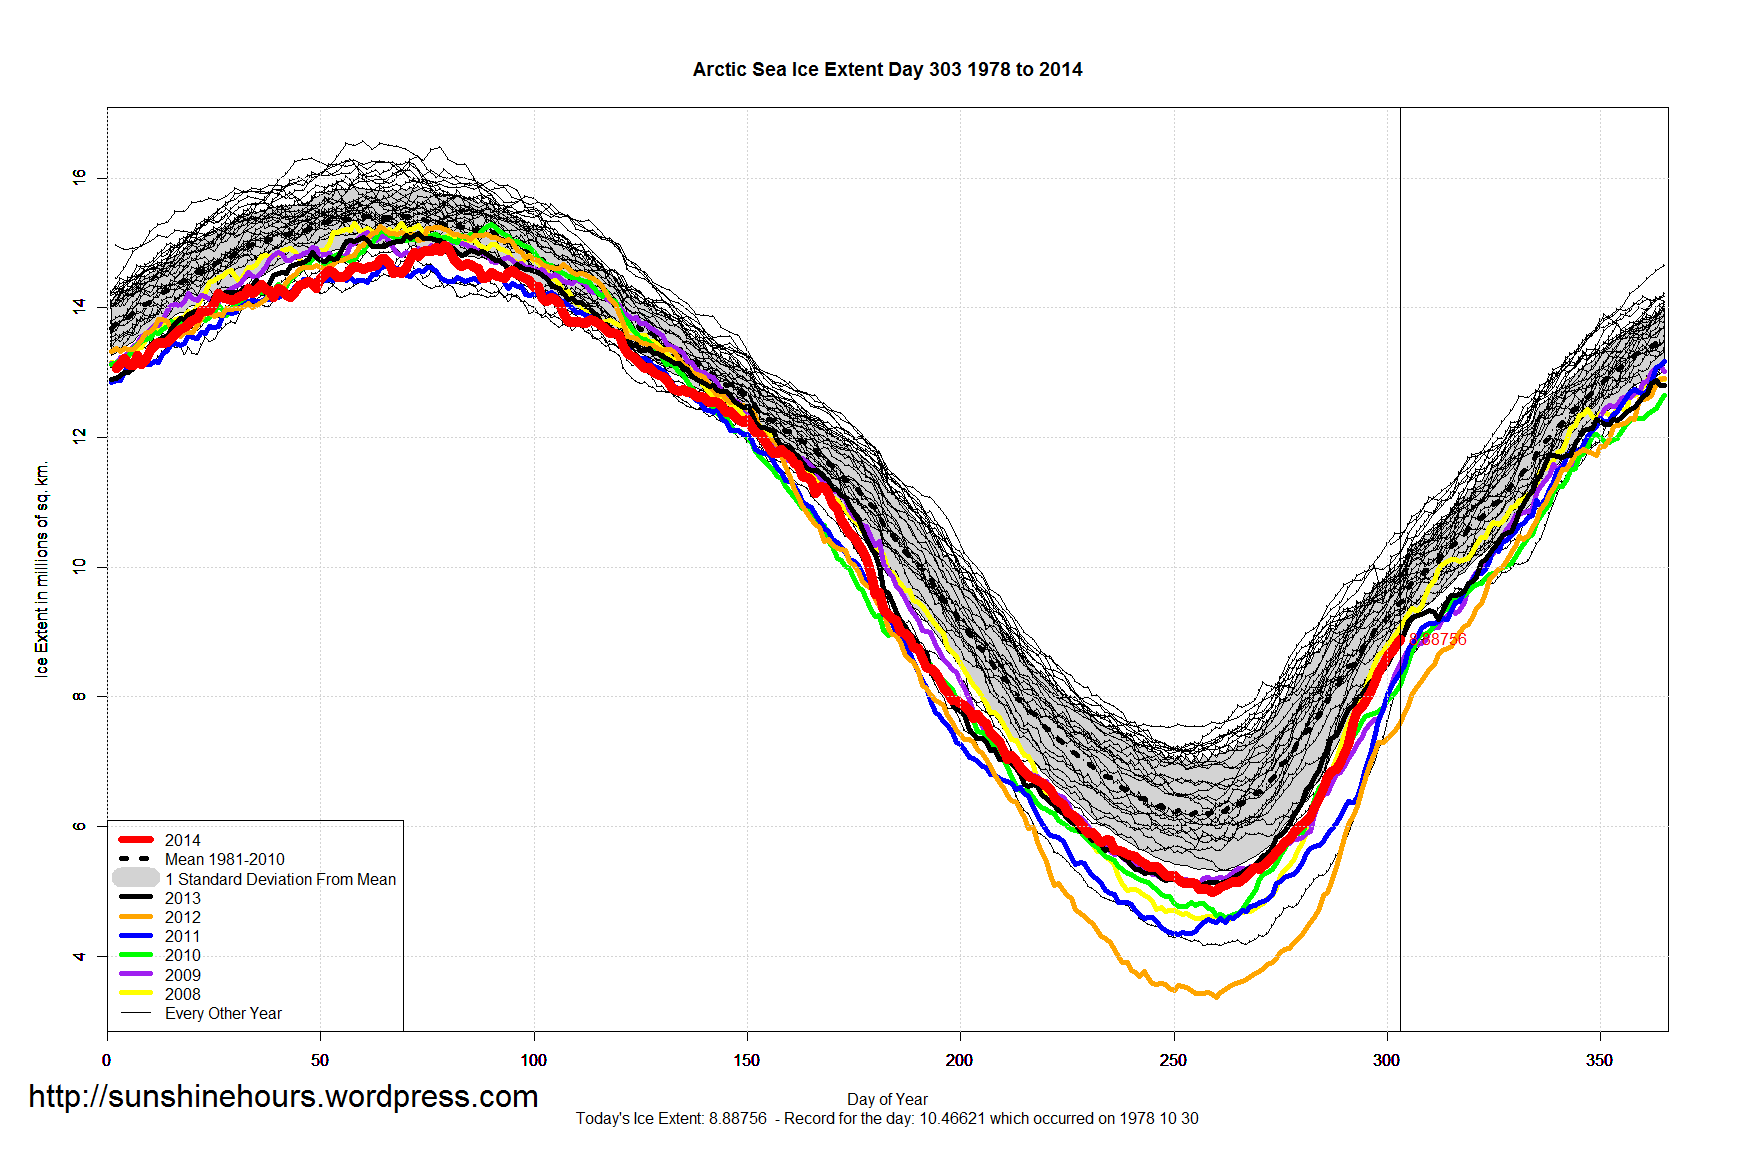
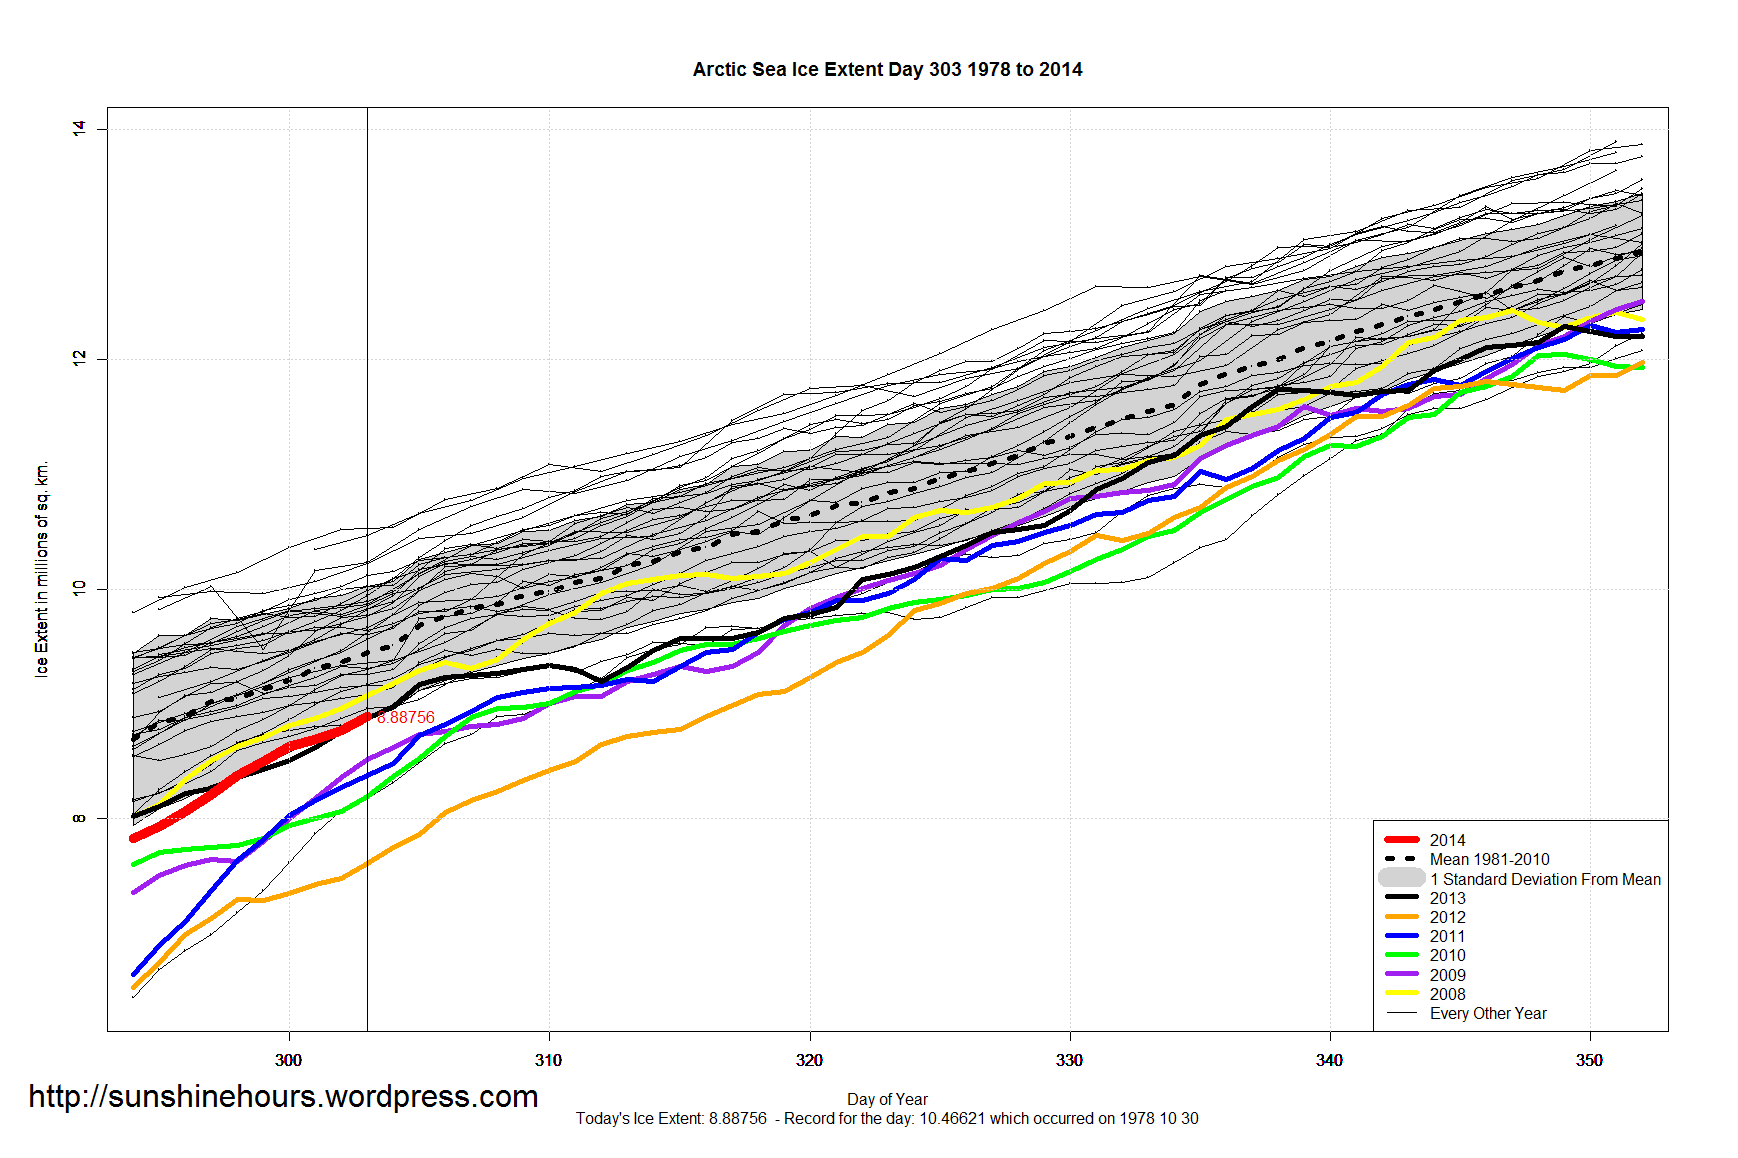
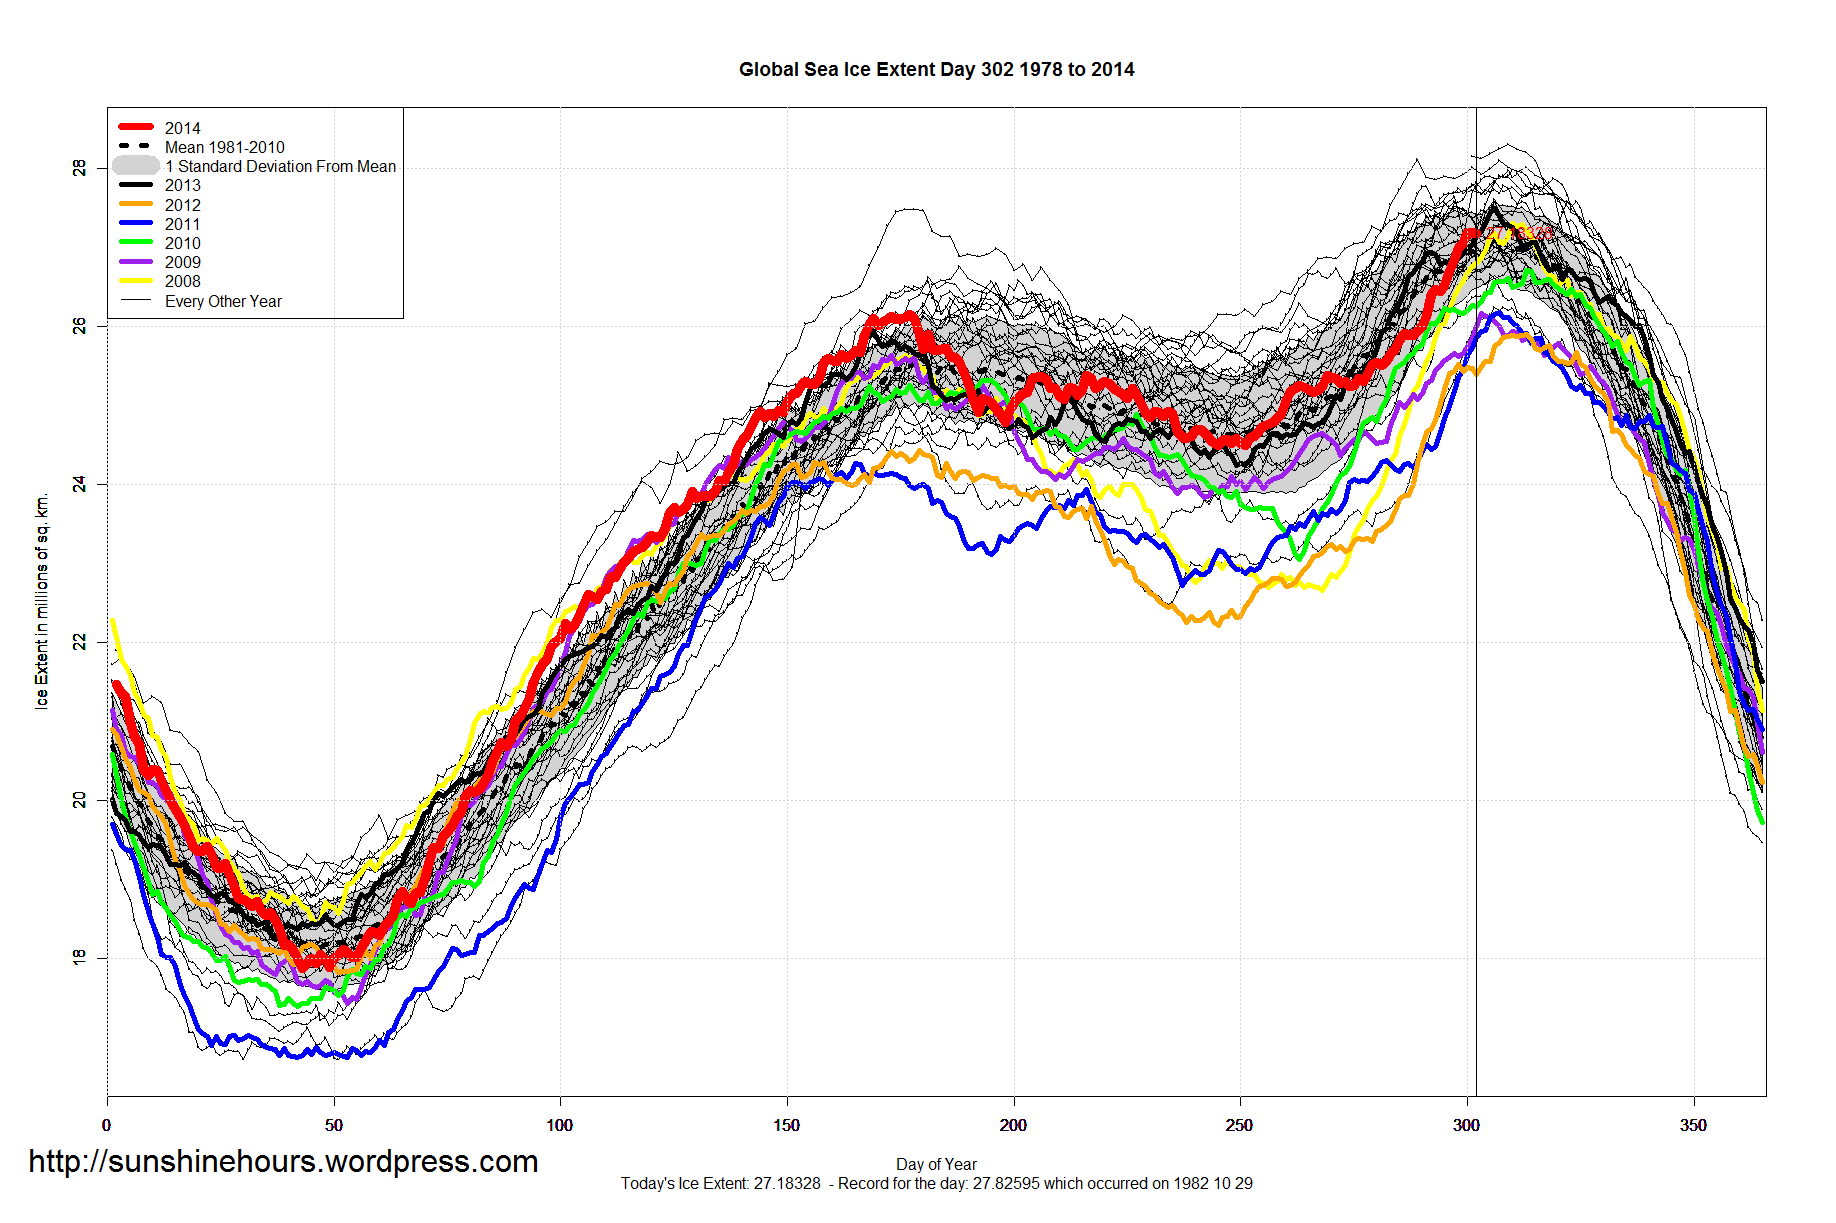
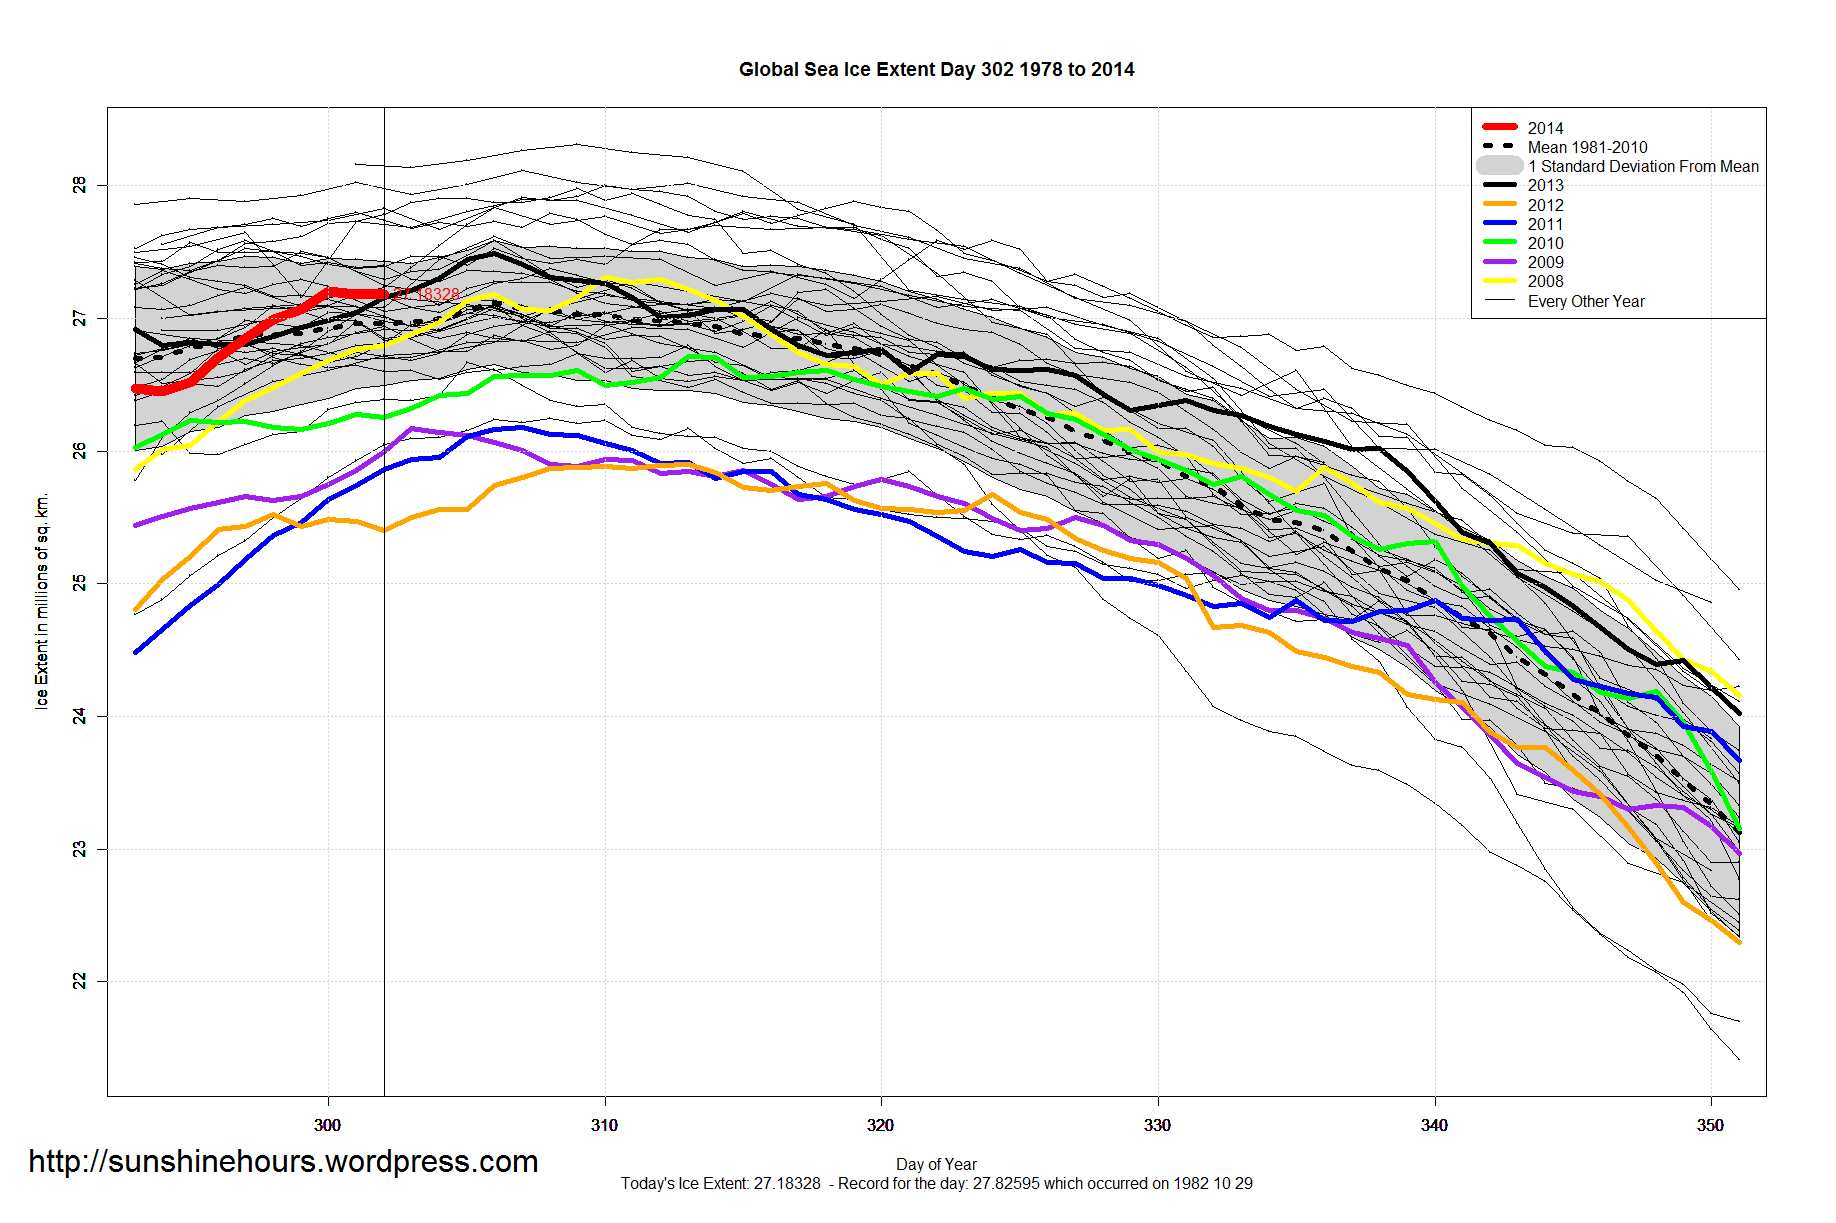
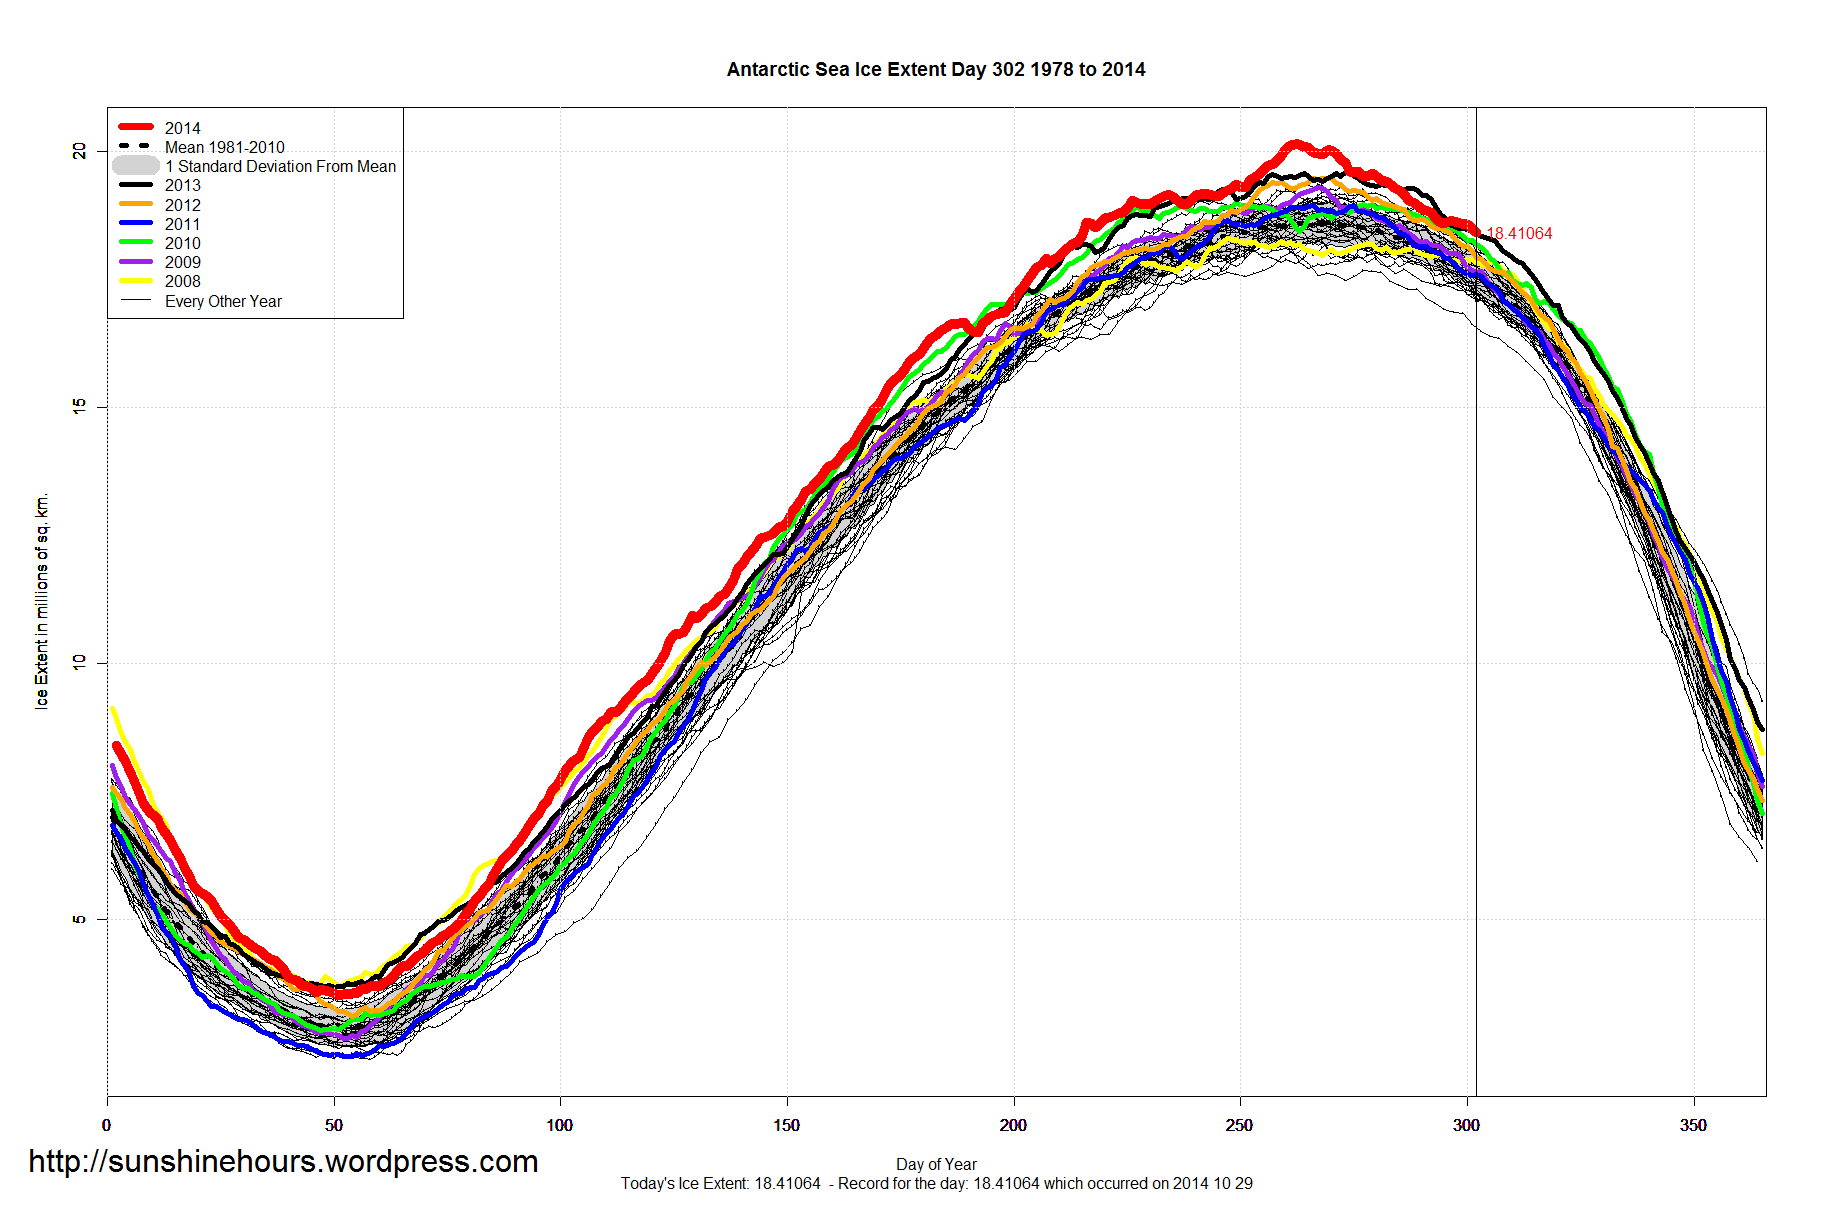
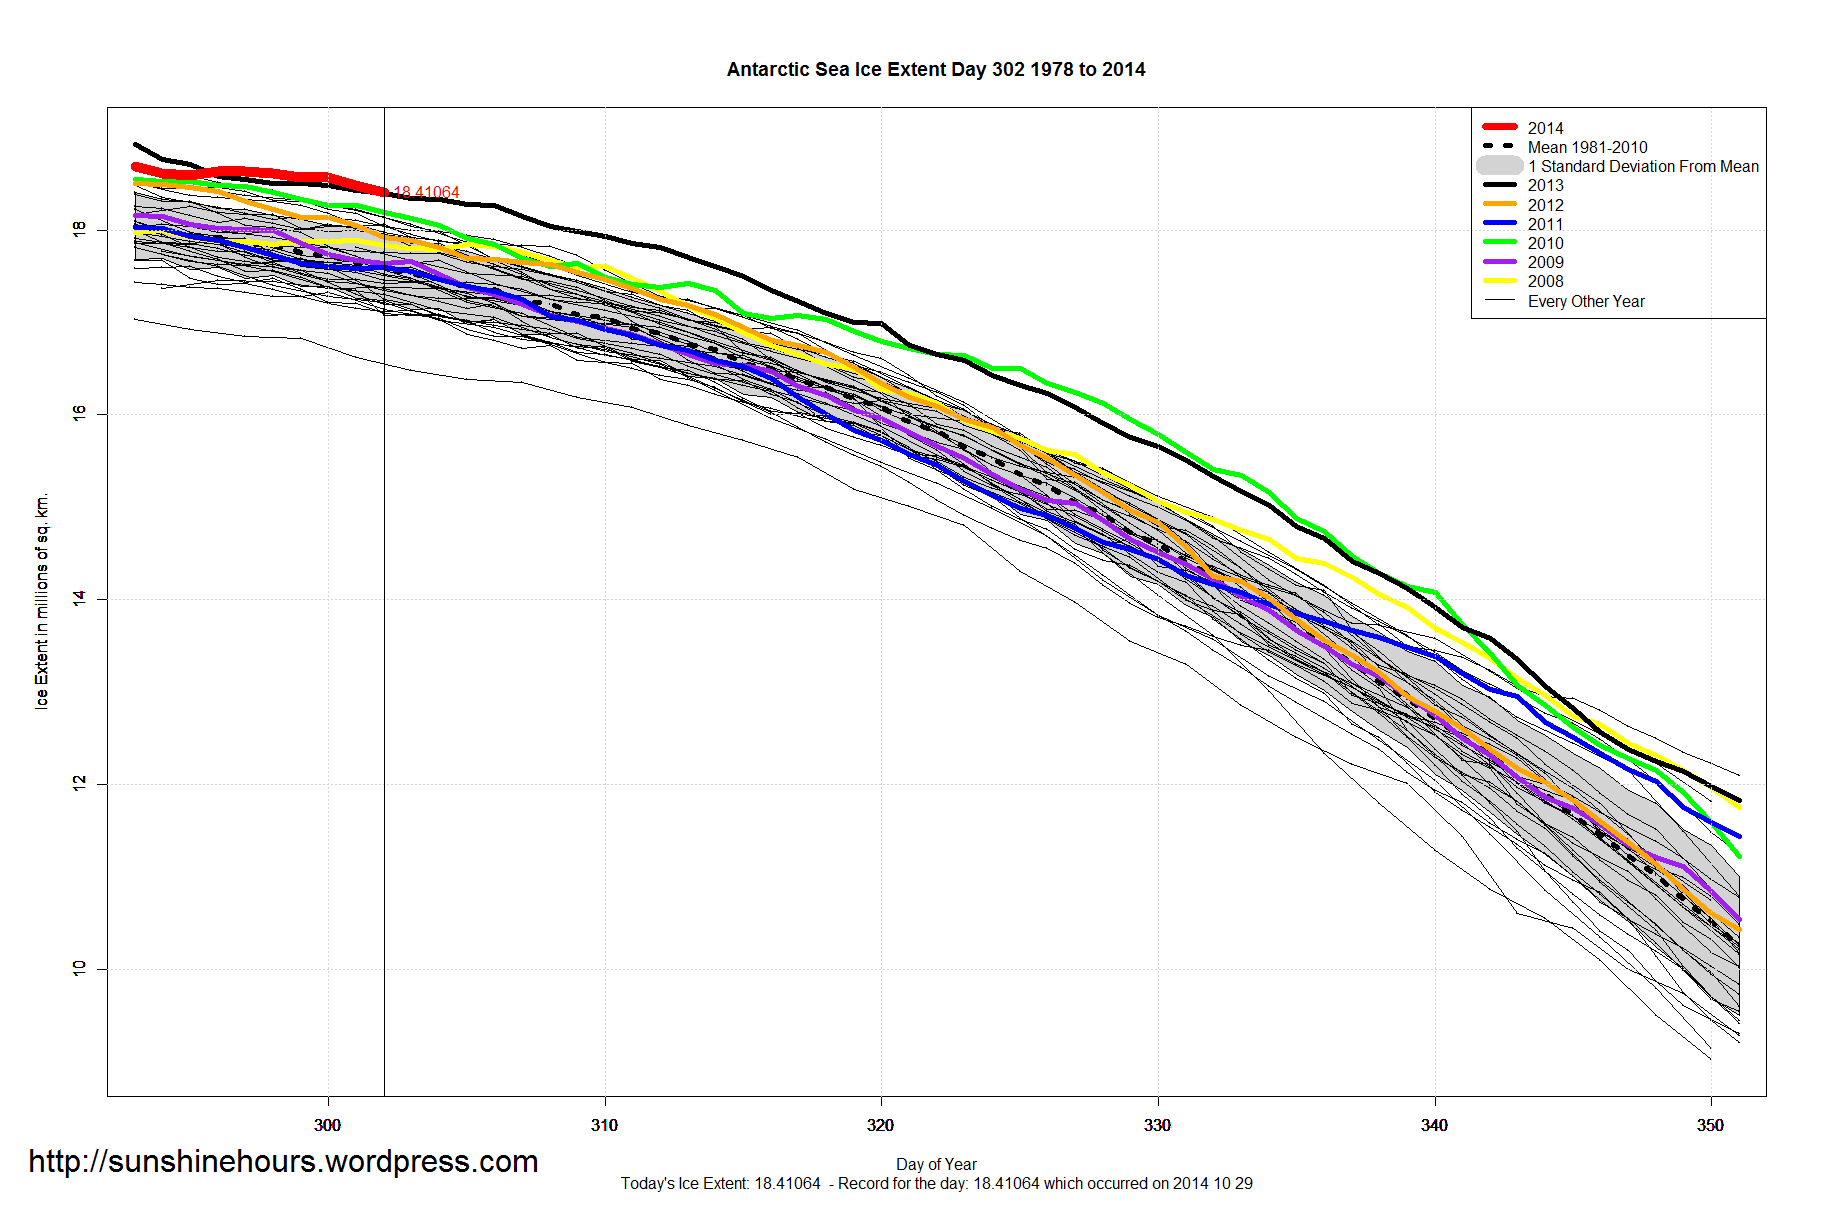
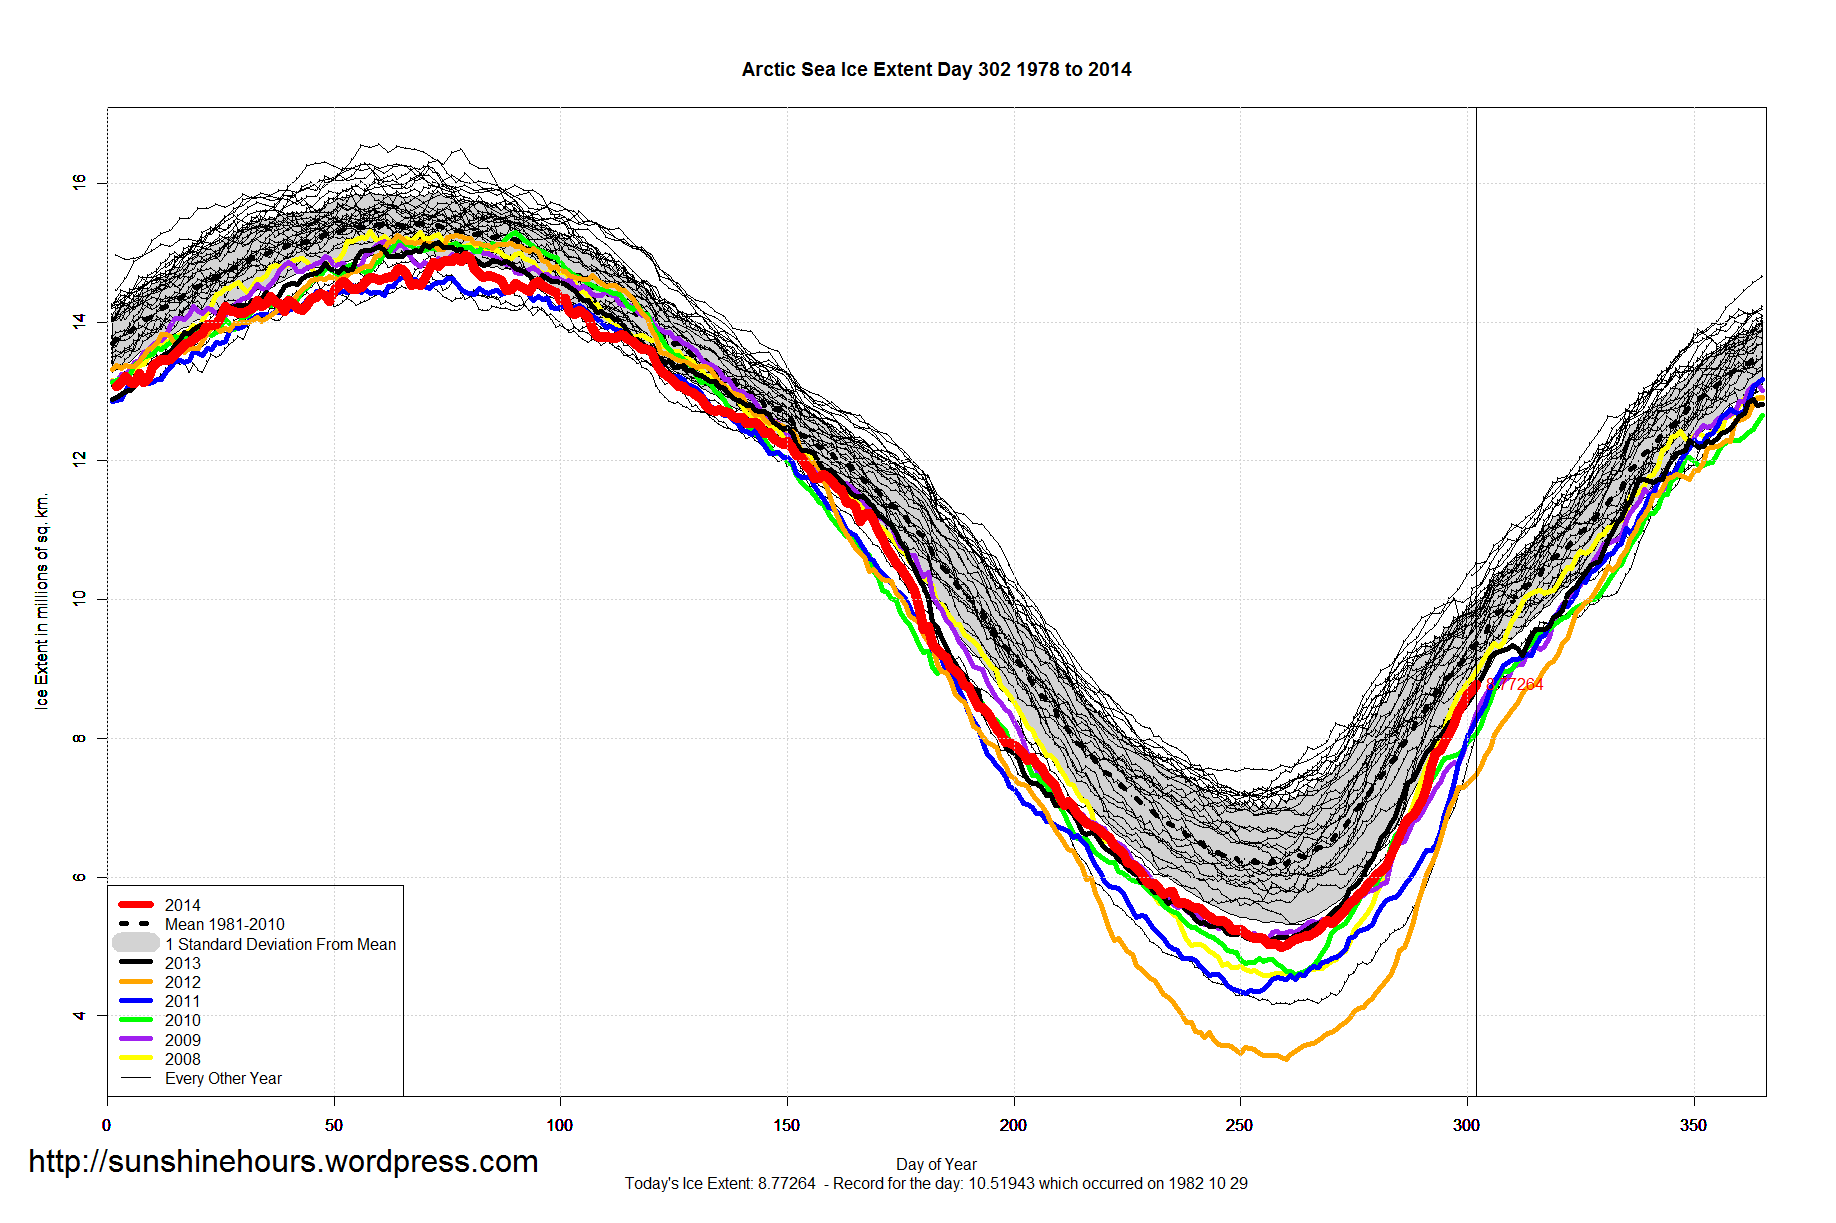
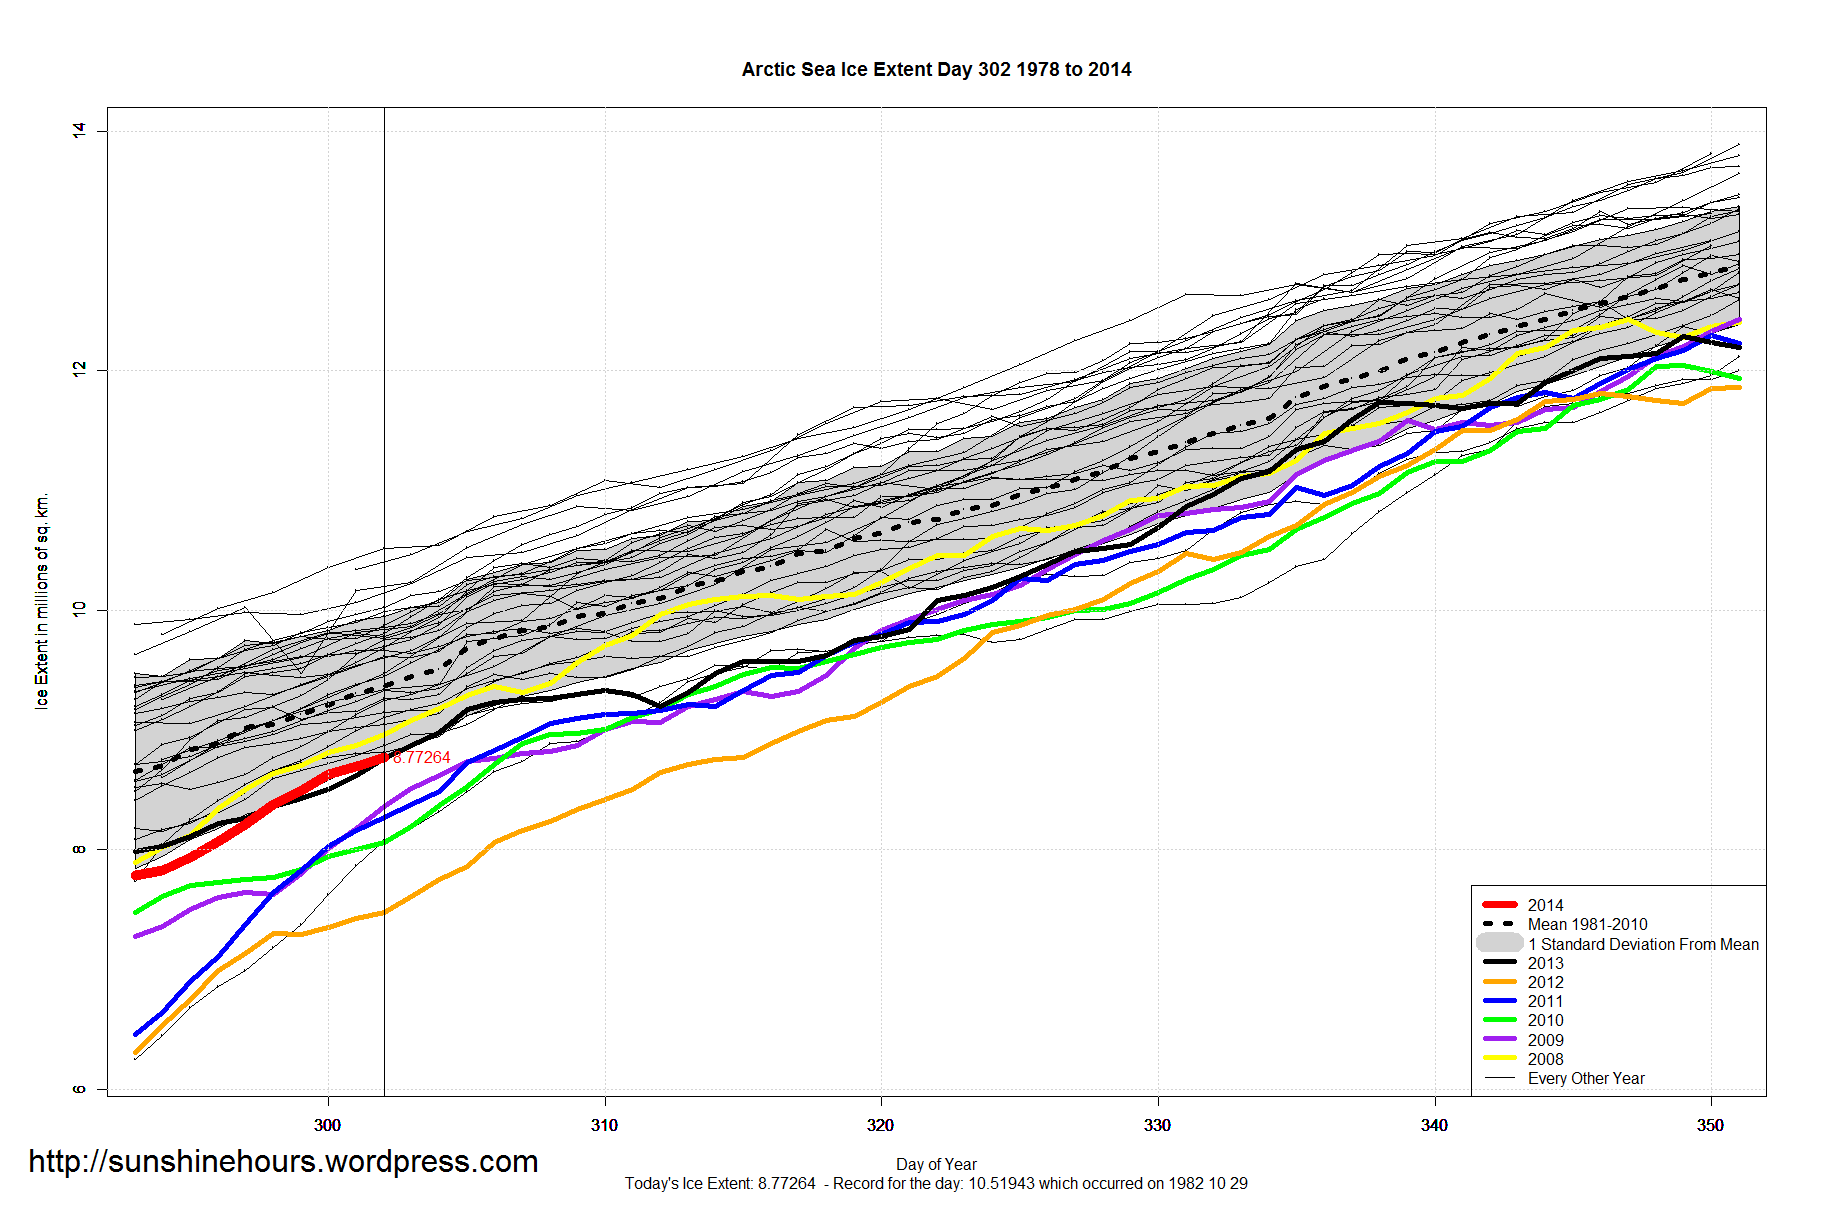
A quick update for sea ice extent for day 302 of 2014
- Global Sea Ice Extent is 201,000 sq km above the 1981-2010 mean.
- Antarctic Sea Ice Extent is 854,000 sq km above the 1981-2010 mean.
- Arctic Sea Ice Extent is -654,000 sq km below the 1981-2010 mean. T
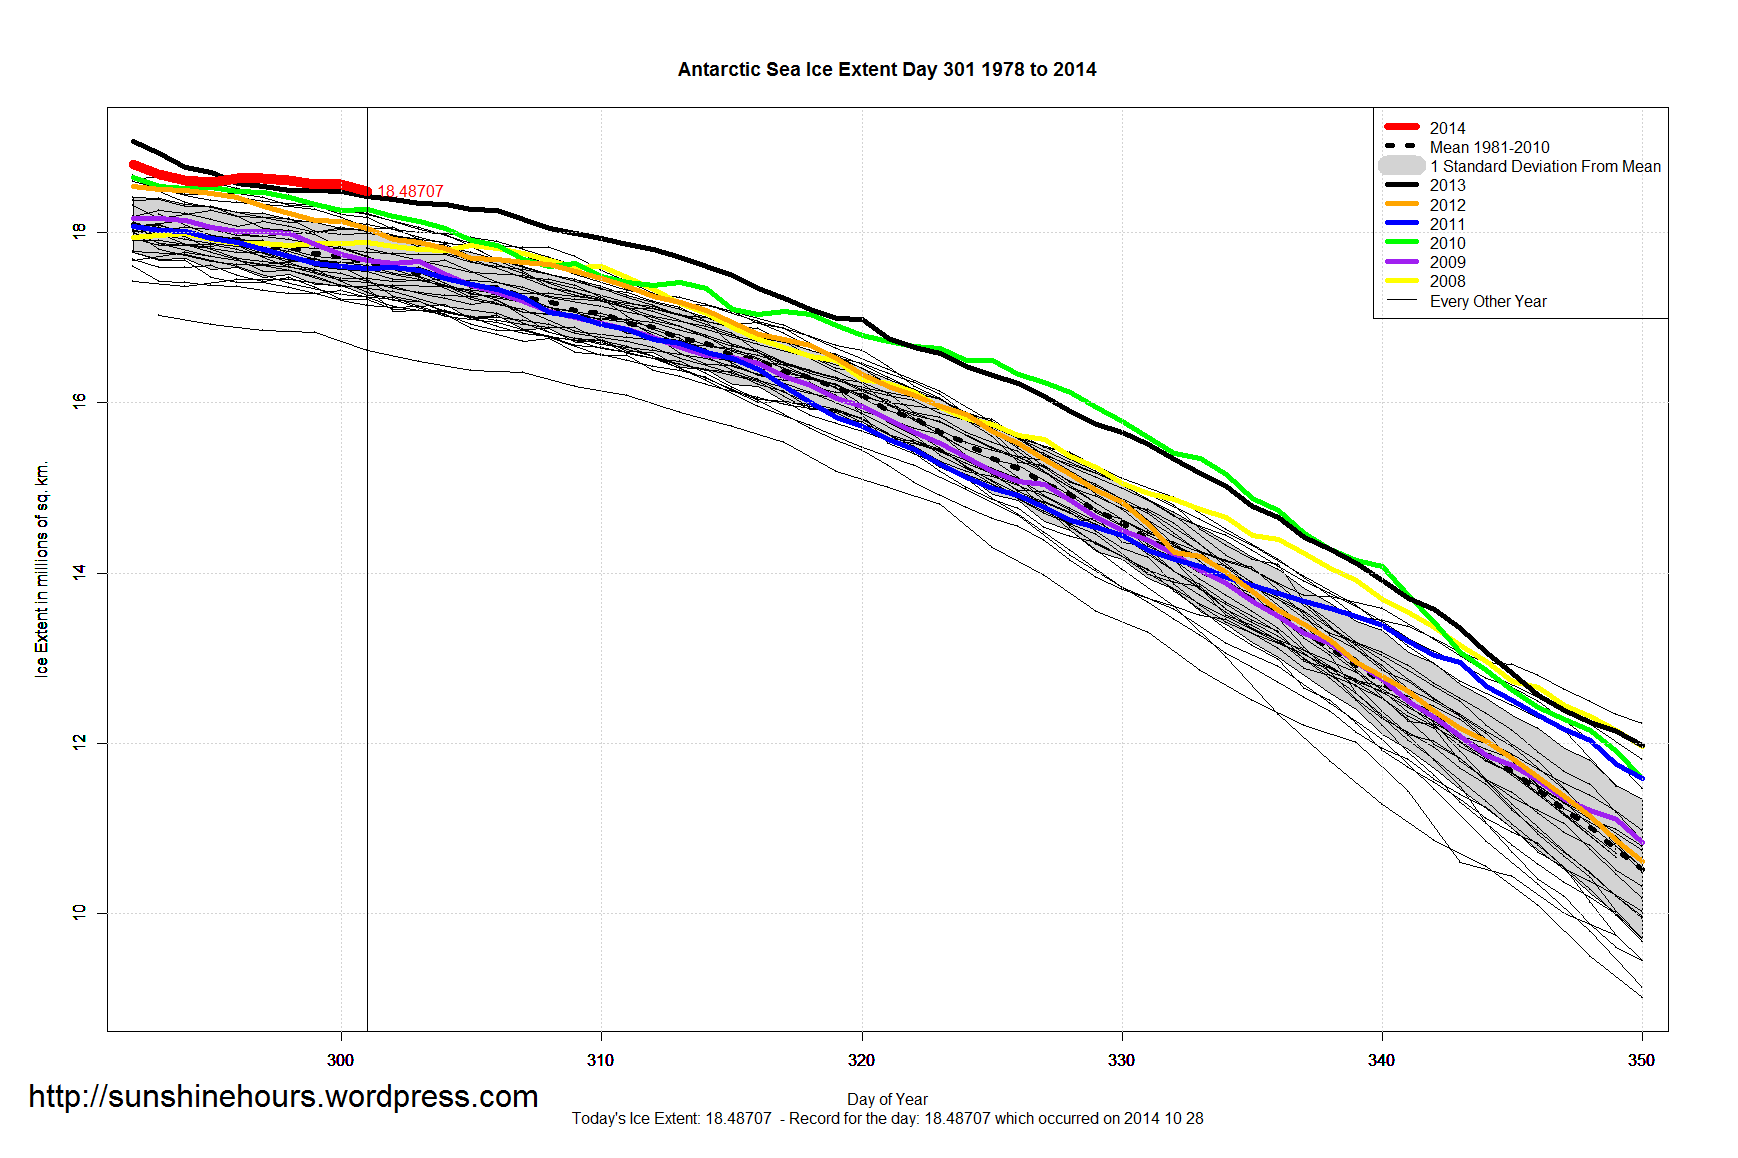
Sea Ice Day 301


Global Sea Ice Day 300 – Highest Since 1999

Global Sea Ice Extent Sep 28 2014 – 229,000 sq km above Normal
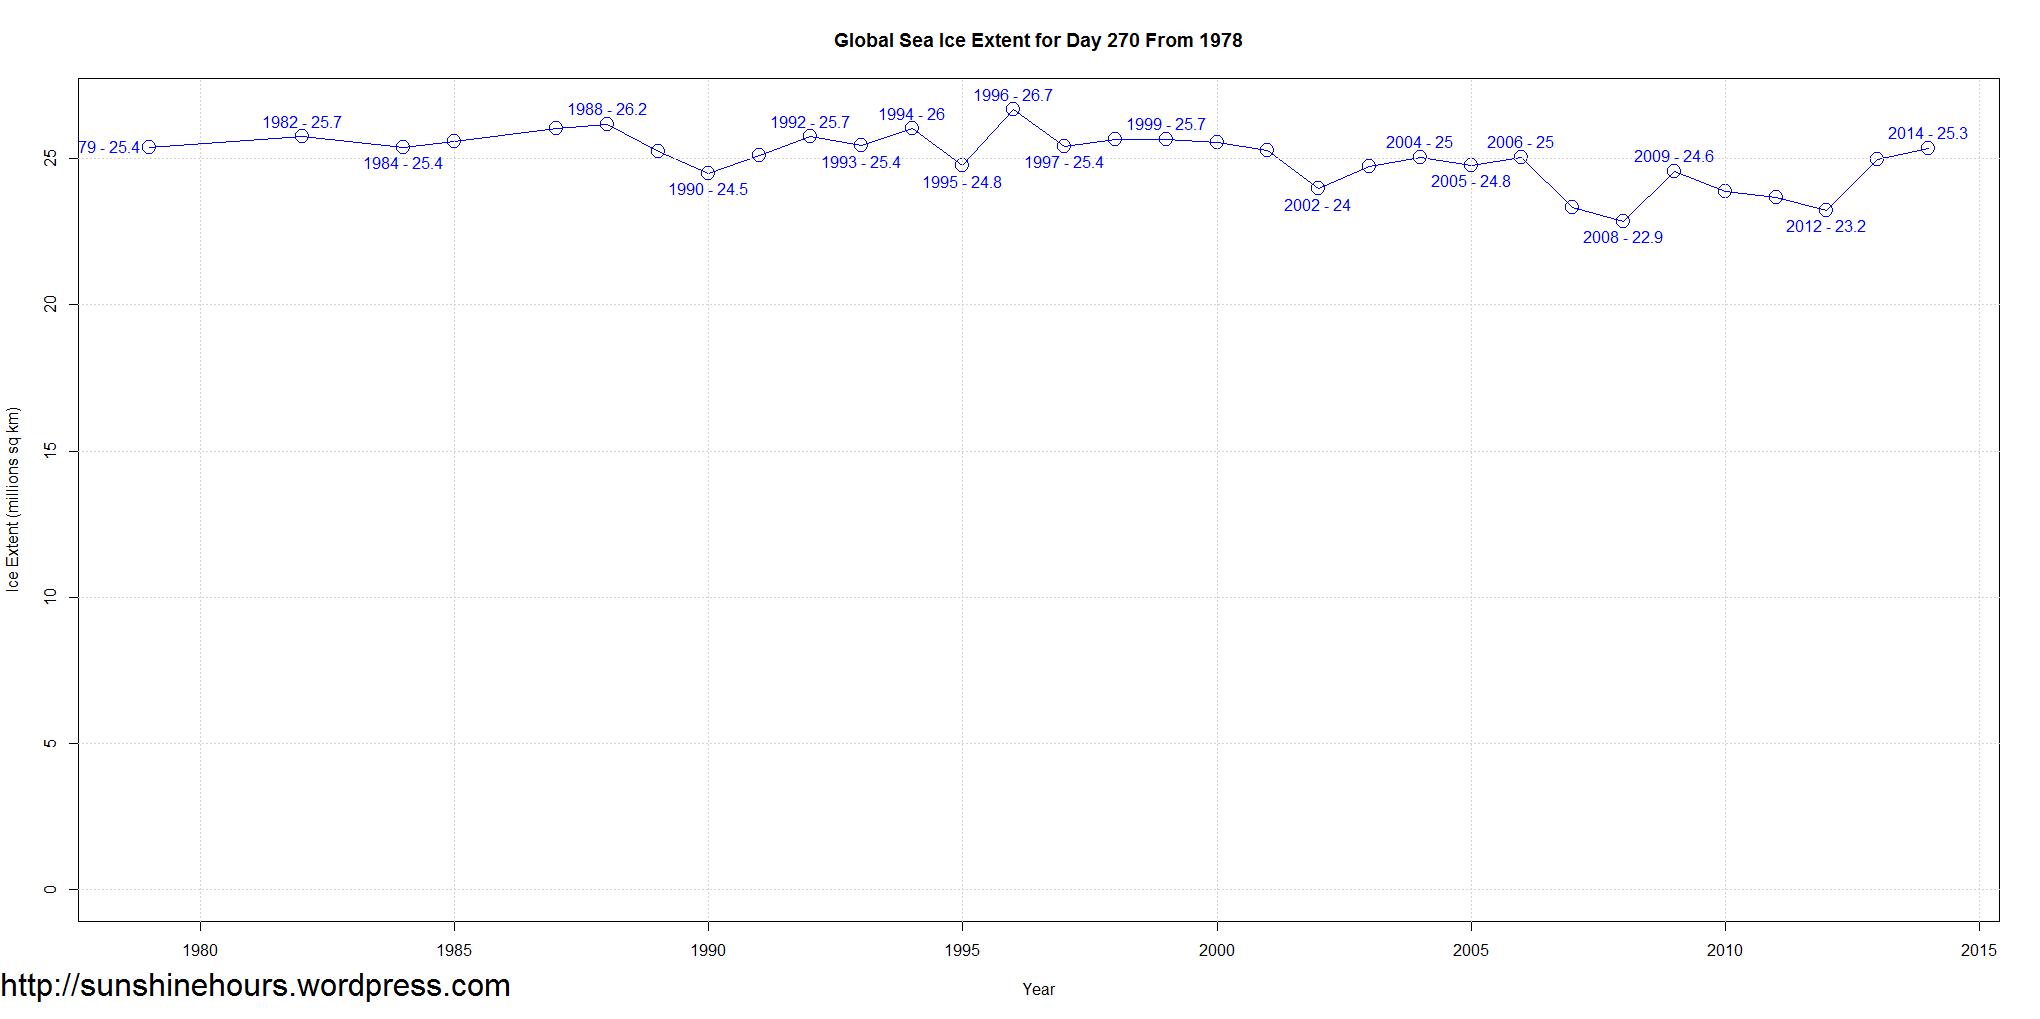
Global Sea Ice Extent Sep 28 2014 – 229,000 sq km above the 1981-2010 mean. Data for Day 270. Data here.
Global Sea Ice Extent for day 270 if you show the full x and y axis.


Global Sea Ice Extent Sep 23 2014 – 250,000 sq km above Normal
Global Sea Ice Extent Sep 23 2014 – 250,000 sq km above the 1981-2010 mean. Data for Day 265. Data here.


Global Sea Ice Extent Sep 22 2014 – Highest Since 1998
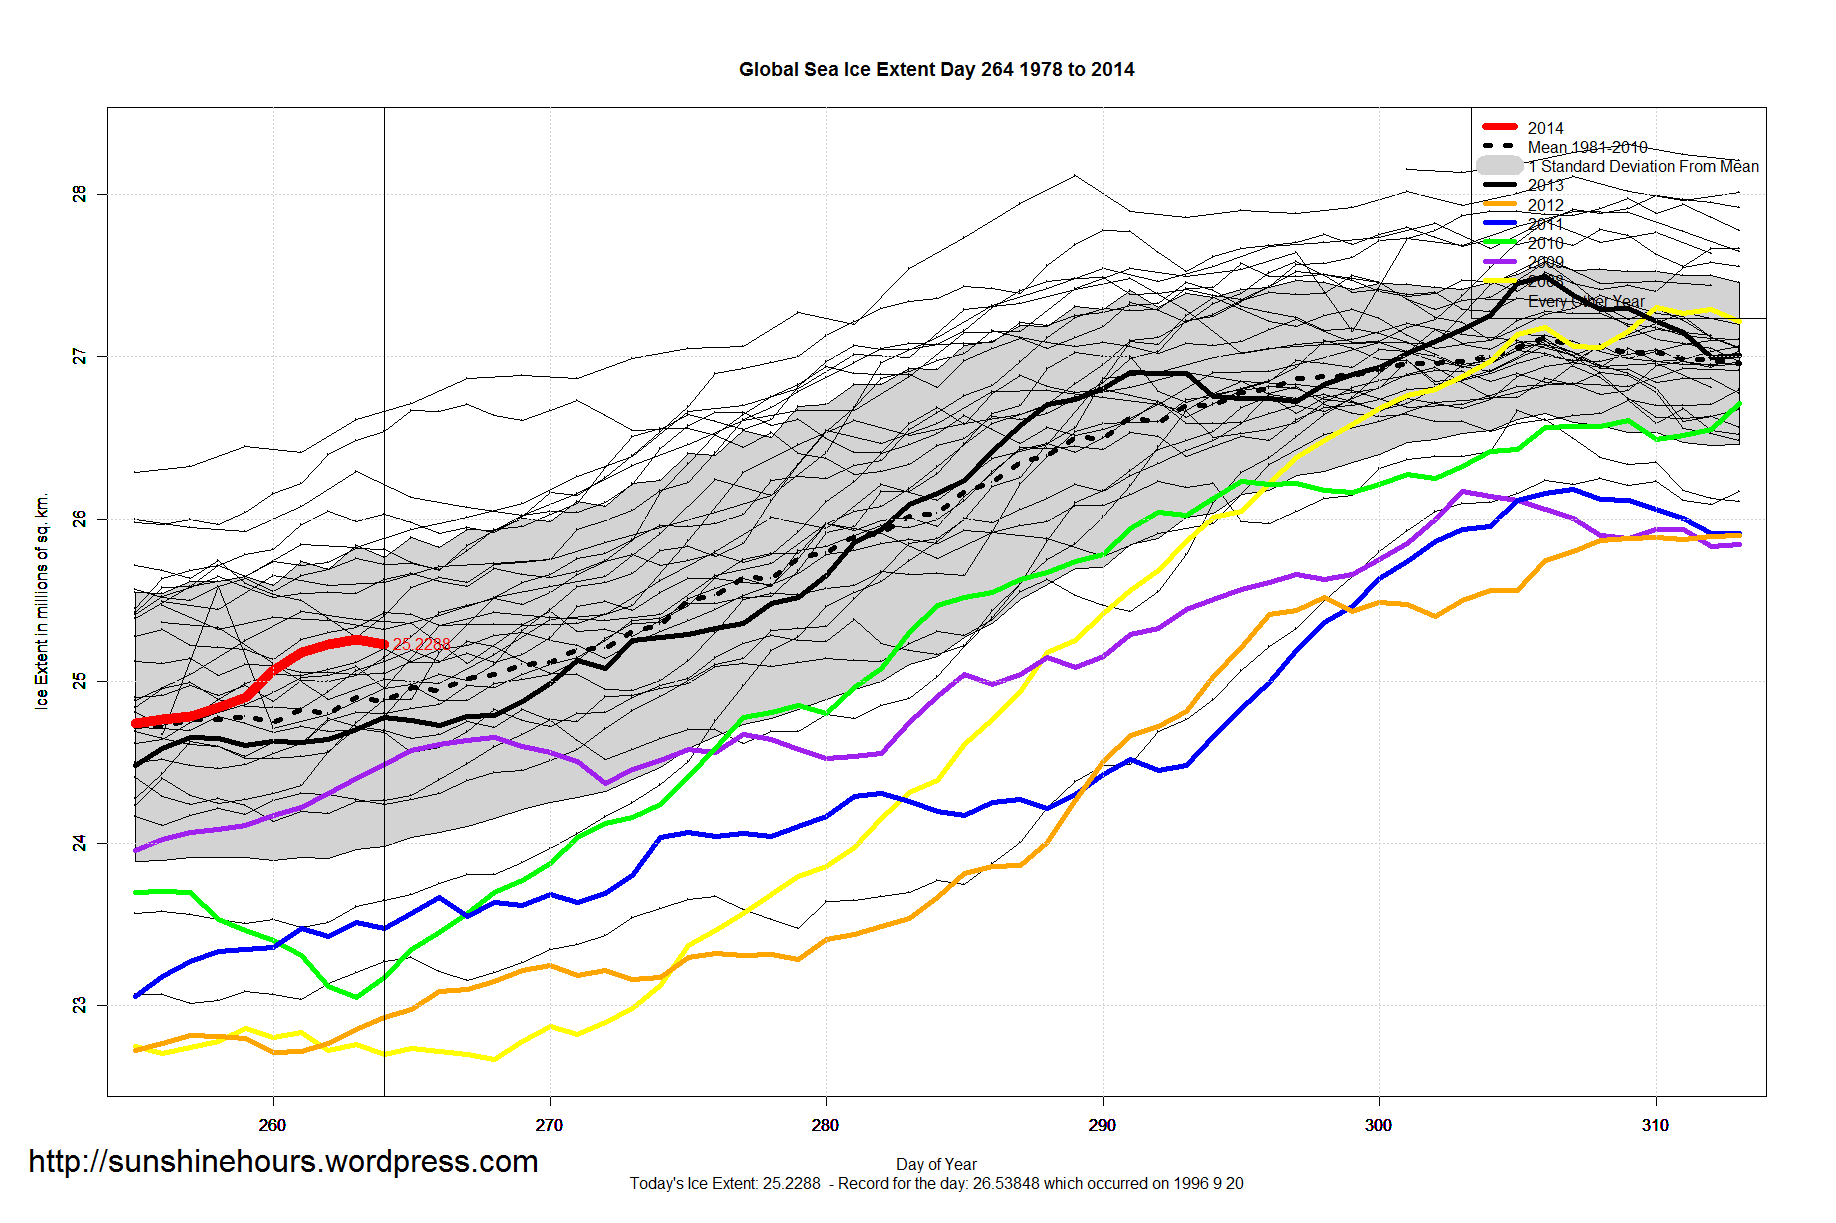
Global Sea Ice Extent Sep 22 2014 – 356,000 sq km above the 1981-2010 mean. Data for Day 264. Data here.
The last time there was more global sea ice extent on day 264 was 1998.
Years with less global sea ice on this day: 1979 1984 1989 1990 1991 1993 1995 1999 2000 2001 2002 2003 2004 2005 2006 2007 2008 2009 2010 2011 2012 2013

Sea Ice Data is late today – Aug 30 2014
Global Sea Ice Extent Aug 25 2014 – -103,000 sq km below Normal
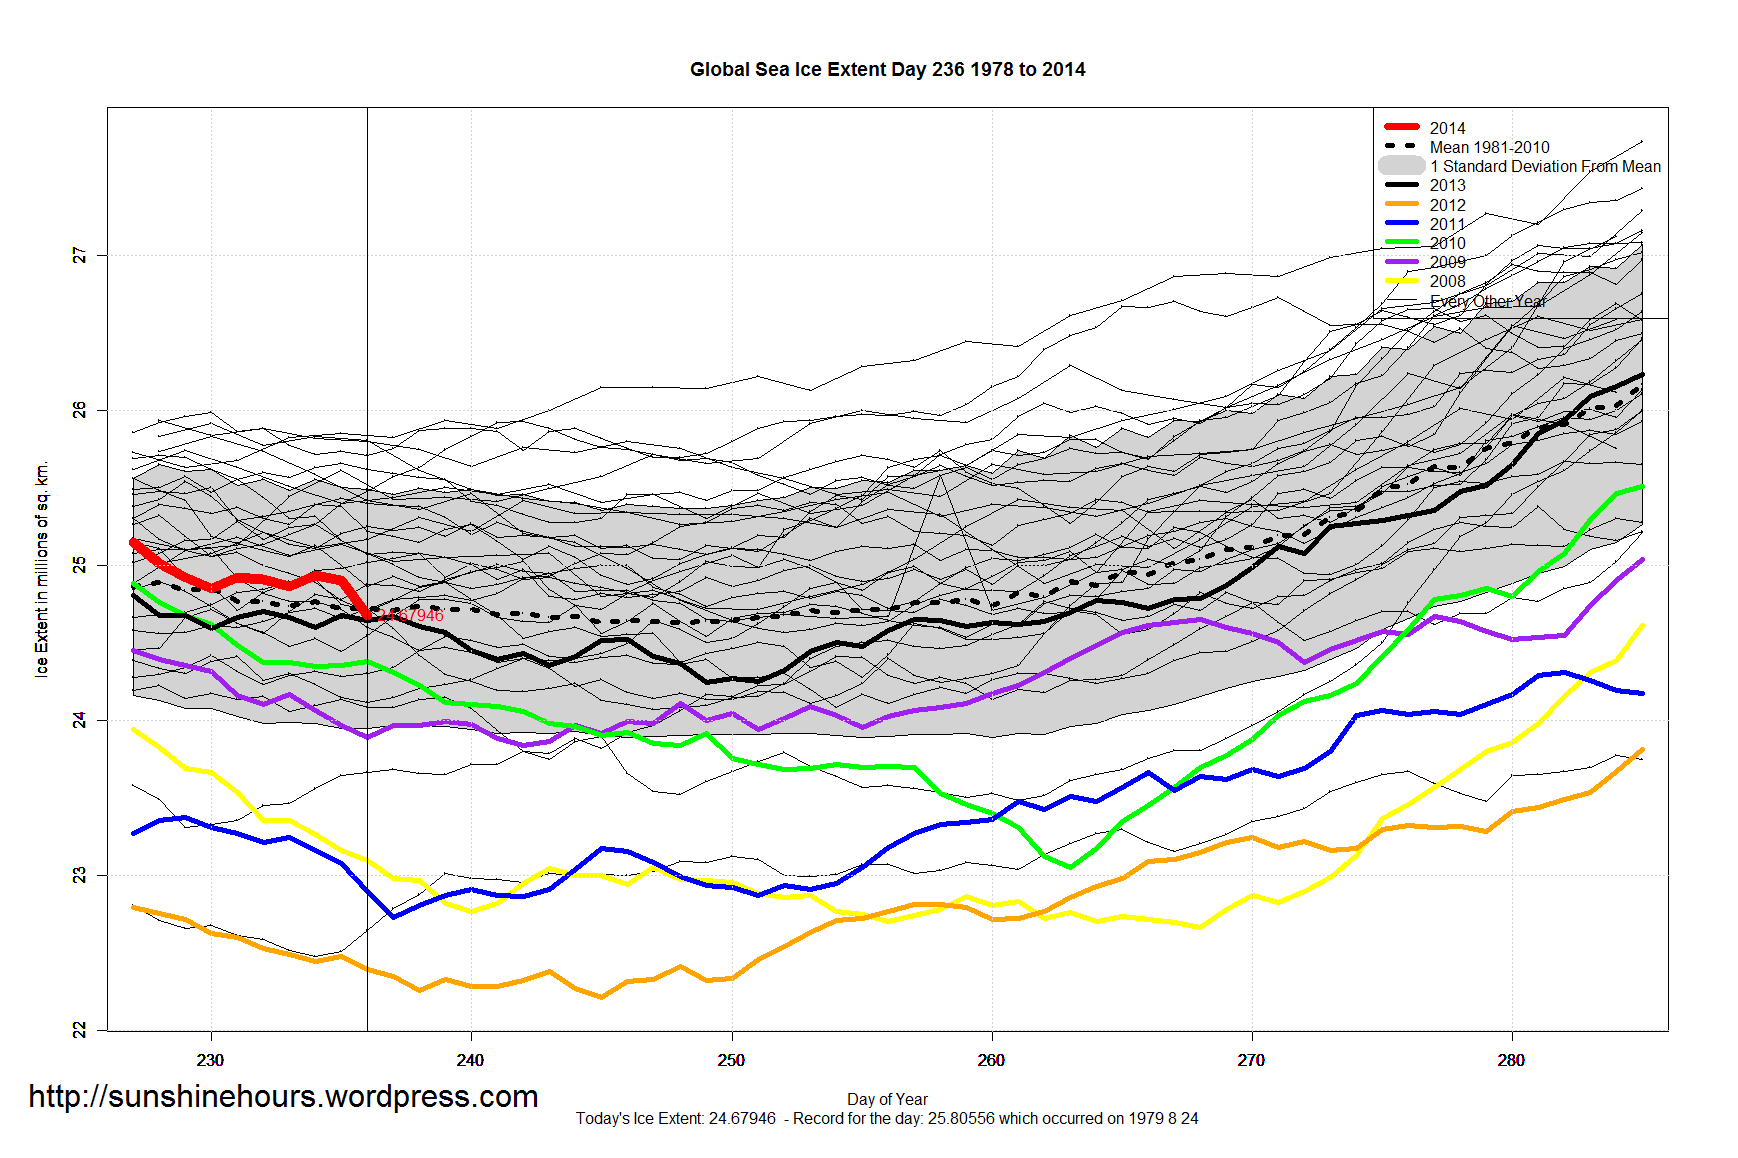
Global Sea Ice Extent Aug 25 2014 – -103,000 sq km below the 1981-2010 mean. Data for Day 236. Data here.

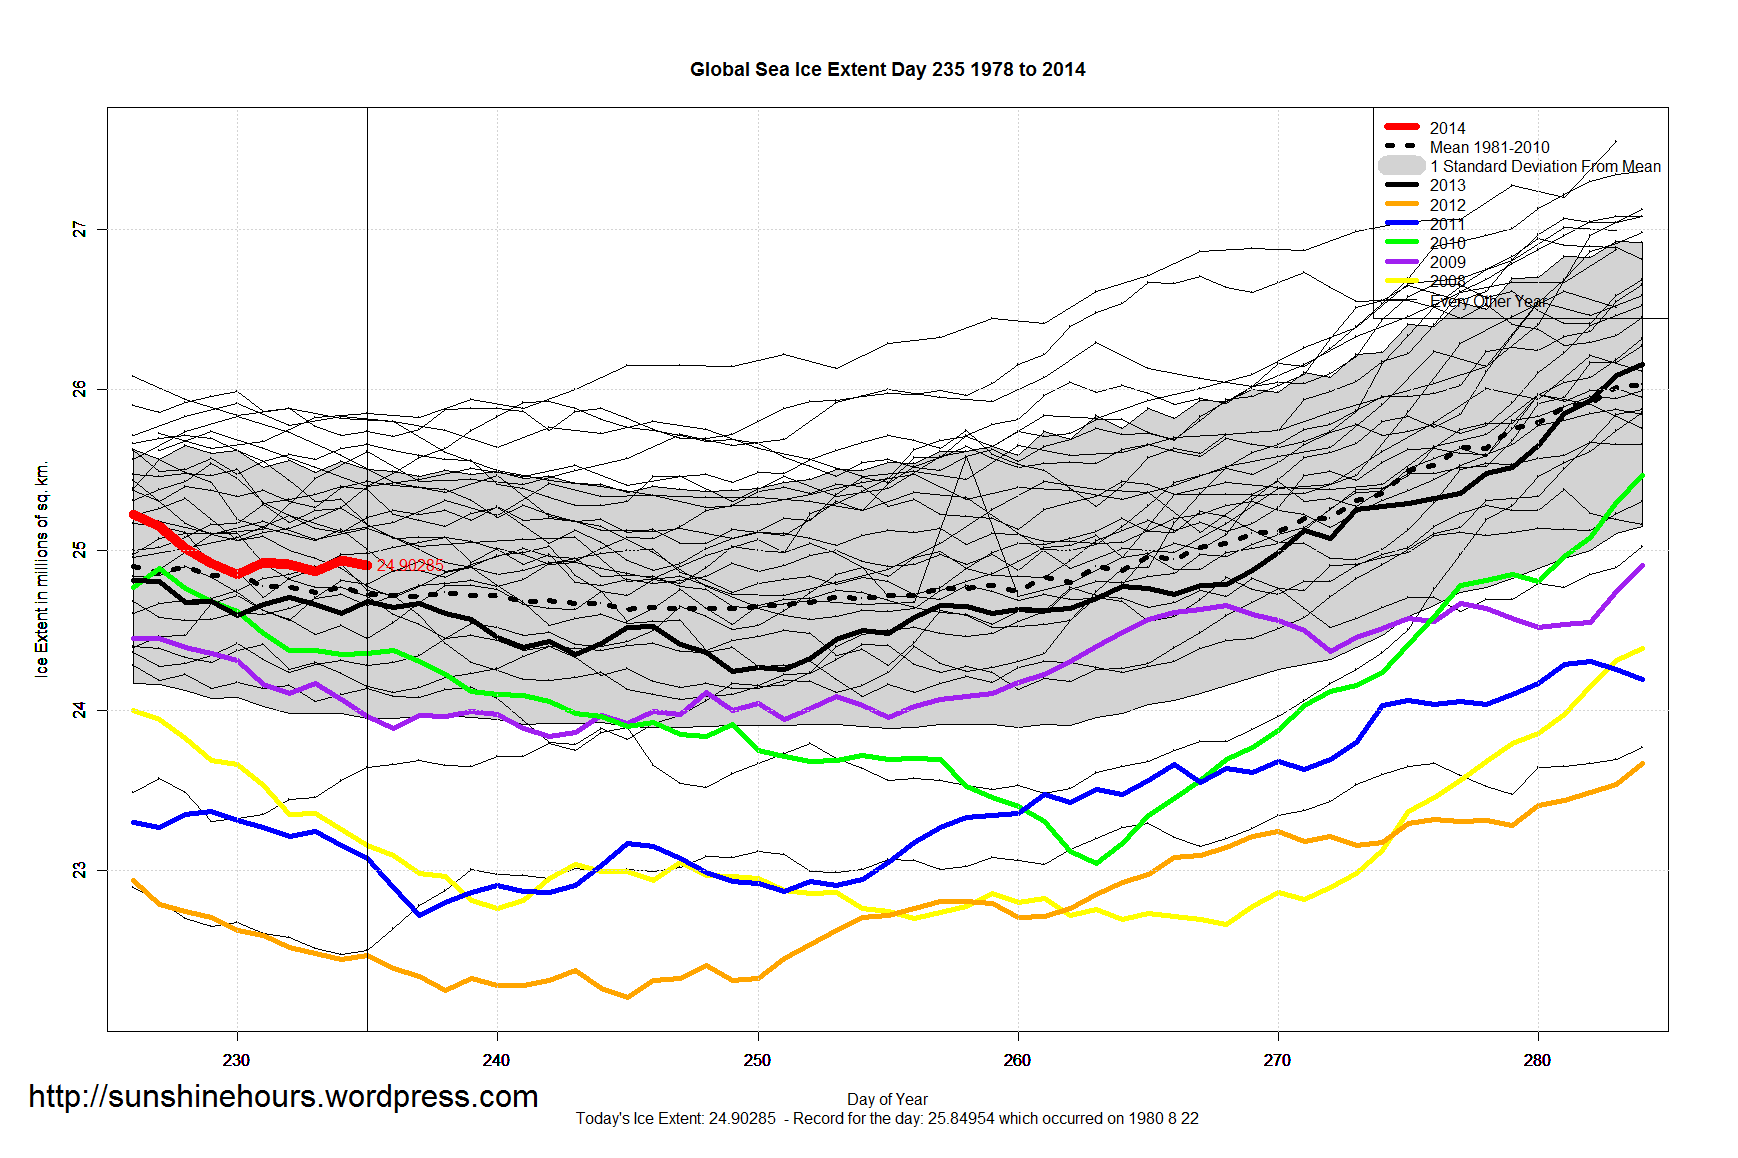
Global Sea Ice Extent Aug 24 2014 – 101,000 sq km above Normal
Global Sea Ice Extent Aug 24 2014 – 101,000 sq km above the 1981-2010 mean. Data for Day 235. Data here.