Sea Ice Update March 5 2014 – Global Sea Ice Is Normal

A quick update for sea ice extent:

  • Global Sea Ice is only 25,000 sq km below the 1981-2010 mean.  That is 0.135% below the mean.
  • Antarctic Sea Ice is  716,000 sq km above the 1981-2010 mean. That is 22.5% above the mean.  
  • Arctic Sea Ice is 741,000 sq km below the 1981-2010 mean.  That is 4.8% below the mean .

Data here. Graphs below. Click for bigger.

Global_Sea_Ice_Extent_2014_Day_63_1981-2010 Global_Sea_Ice_Extent_Zoomed_2014_Day_63_1981-2010 Antarctic_Sea_Ice_Extent_2014_Day_63_1981-2010 Antarctic_Sea_Ice_Extent_Zoomed_2014_Day_63_1981-2010 Arctic_Sea_Ice_Extent_2014_Day_63_1981-2010 Arctic_Sea_Ice_Extent_Zoomed_2014_Day_63_1981-2010

Sea Ice Update March 3rd 2014 – Antarctic Sea Ice Extent 23% above normal

A quick update for sea ice extent:

  • Global Sea Ice is only 77,000 sq km below the 1981-2010 mean.  That is 0.4% below the mean. Global Sea Ice has been within one standard deviation of the 1981-2010 mean since July 25 2013
  • Antarctic Sea Ice is  704,000 sq km above the 1981-2010 mean. That is 22.9% above the mean.  Day 51 was the 4th highest minimum. Nov 20 2011 was the last time Antarctic Sea Ice was below one standard deviation.
  • Arctic Sea Ice is 781,000 sq km below the 1981-2010 mean.  That is 5% below the mean .

Data here. Graphs below. Click for bigger.

Global_Sea_Ice_Extent_Zoomed_2014_Day_61_1981-2010

Antarctic_Sea_Ice_Extent_Zoomed_2014_Day_61_1981-2010

Arctic_Sea_Ice_Extent_Zoomed_2014_Day_61_1981-2010

Sea Ice Update February 28 2014 – Antarctic Sea Ice Extent 24% above normal

A quick update for sea ice extent:

  • Global Sea Ice is only 50,000 sq km below the 1981-2010 mean.  That is 0.3% below the mean.
  • Antarctic Sea Ice is  720,000 sq km above the 1981-2010 mean. That is 24% above the mean.  I’m pretty sure day 51 was minimum. Extent is 170,000 above what it was on Day 51. That would be the 4th highest minimum of all time!
  • Arctic Sea Ice is 769,000 sq km below the 1981-2010 mean.  That is 5% below the mean .

Data here. Graphs below. Click for bigger.

Global_Sea_Ice_Extent_Zoomed_2014_Day_58_1981-2010 Antarctic_Sea_Ice_Extent_Zoomed_2014_Day_58_1981-2010 Arctic_Sea_Ice_Extent_Zoomed_2014_Day_58_1981-2010

Sea Ice Update February 22 2014 – Antarctic Sea Ice Extent Still 22.5% Above The Mean

A quick update for sea ice extent:

  • Global Sea Ice is 98,000 sq km below the 1981-2010 mean.  That is 0.54% below the mean. Daring to use an unpopular word, Global Sea Ice Extent is normal.
  • Antarctic Sea Ice is  647,000 sq km above the 1981-2010 mean. That is 22.5% above the mean.  Antarctic Sea Ice Extent rose 13,500 sq km in the last day.
  • Arctic Sea Ice is 745,000 sq km below the 1981-2010 mean.  That is 4.86% below the mean . Arctic Sea Ice Extent has risen 280,000 sq km in last 3 days.

Data here. Graphs below. Click for bigger.

Global_Sea_Ice_Extent_2014_Day_52_1981-2010 Global_Sea_Ice_Extent_Zoomed_2014_Day_52_1981-2010 Antarctic_Sea_Ice_Extent_2014_Day_52_1981-2010 Antarctic_Sea_Ice_Extent_Zoomed_2014_Day_52_1981-2010 Arctic_Sea_Ice_Extent_2014_Day_52_1981-2010 Arctic_Sea_Ice_Extent_Zoomed_2014_Day_52_1981-2010

Sea Ice Update February 20 2014 – Antarctic Sea Ice Extent Still 23% above normal

A quick update for sea ice extent:

  • Global Sea Ice is 149,000 sq km below the 1981-2010 mean.  That is 0.8% below the mean.
  • Antarctic Sea Ice is  671,000 sq km above the 1981-2010 mean. That is 23% above the mean.  Antarctic Sea Ice Extent fell 40,000 sq km. and hast not reach minimum yet.
  • Arctic Sea Ice is 820,000 sq km below the 1981-2010 mean.  That is 5.4% below the mean . That is 4th lowest for this day.

Data here. Graphs below. Click for bigger.

Global_Sea_Ice_Extent_2014_Day_50_1981-2010 Global_Sea_Ice_Extent_Zoomed_2014_Day_50_1981-2010 Antarctic_Sea_Ice_Extent_2014_Day_50_1981-2010 Antarctic_Sea_Ice_Extent_Zoomed_2014_Day_50_1981-2010 Arctic_Sea_Ice_Extent_2014_Day_50_1981-2010 Arctic_Sea_Ice_Extent_Zoomed_2014_Day_50_1981-2010

Sea Ice Update February 17 2014 – Antarctic Sea Ice Extent Still 25% above normal

A quick update for sea ice extent:

  • Global Sea Ice is 93,000 sq km below the 1981-2010 mean.  That is 0.5% below “normal”
  • Antarctic Sea Ice is  706,000 sq km above the 1981-2010 mean. That is 25% above “normal”.  Antarctic Sea Ice Extent actually rose 38,000 sq km from day 46 to day 47. Minimum could be near.
  • Arctic Sea Ice is 799,000 sq km below the 1981-2010 mean.  That is 5.25% below “normal”.

Data here. Graphs below. Click for bigger.

Global_Sea_Ice_Extent_Zoomed_2014_Day_47_1981-2010 Antarctic_Sea_Ice_Extent_Zoomed_2014_Day_47_1981-2010 Arctic_Sea_Ice_Extent_Zoomed_2014_Day_47_1981-2010

Sea Ice Update February 10 2014

A quick update for sea ice extent:

  • Global Sea Ice is 70,000 sq km below the 1981-2010 mean.
  • Antarctic Sea Ice is  728,000 sq km above the 1981-2010 mean and probably NOT on track to break the record for highest minimum.  Day 40 was still a daily record (23rd of the year), but only by 2120 sq km.
  • Arctic Sea Ice is 798,000 sq km below the 1981-2010 mean.

Graphs below. Click for bigger.

Global_Sea_Ice_Extent_Zoomed_2014_Day_40_1981-2010 Antarctic_Sea_Ice_Extent_Zoomed_2014_Day_40_1981-2010 Arctic_Sea_Ice_Extent_Zoomed_2014_Day_40_1981-2010

Sea Ice Update February 2 2014

A quick update for sea ice extent:

Global Sea Ice is 192,000 sq km above normal.
Antarctic Sea Ice is at record levels for this day and is 219,000 sq km above 2008 and 940,000 sq km above the 1981-2010 mean and on track to break the record for highest minimum.
Arctic Sea Ice is 746,000 sq km below the 1981-2010 mean.

Graphs below. Click for bigger.

Global_Sea_Ice_Extent_Zoomed_2014_Day_32_1981-2010 Antarctic_Sea_Ice_Extent_Zoomed_2014_Day_32_1981-2010 Arctic_Sea_Ice_Extent_Zoomed_2014_Day_32_1981-2010

Sea Ice Update January 27 2014

A quick update for sea ice extent:

Global Sea Ice is 560,000 sq km above normal.
Antarctic Sea Ice is at record levels for this day and on track to possibly break the record for highest minimum.
Arctic Sea Ice has just crossed the one standard deviation line for the first time this year.

Graphs below. Click for bigger.

Global_Sea_Ice_Extent_Zoomed_2014_Day_26_1981-2010 Antarctic_Sea_Ice_Extent_Zoomed_2014_Day_26_1981-2010 Arctic_Sea_Ice_Extent_Zoomed_2014_Day_26_1981-2010

Global Sea Ice Extent Stats For 2013

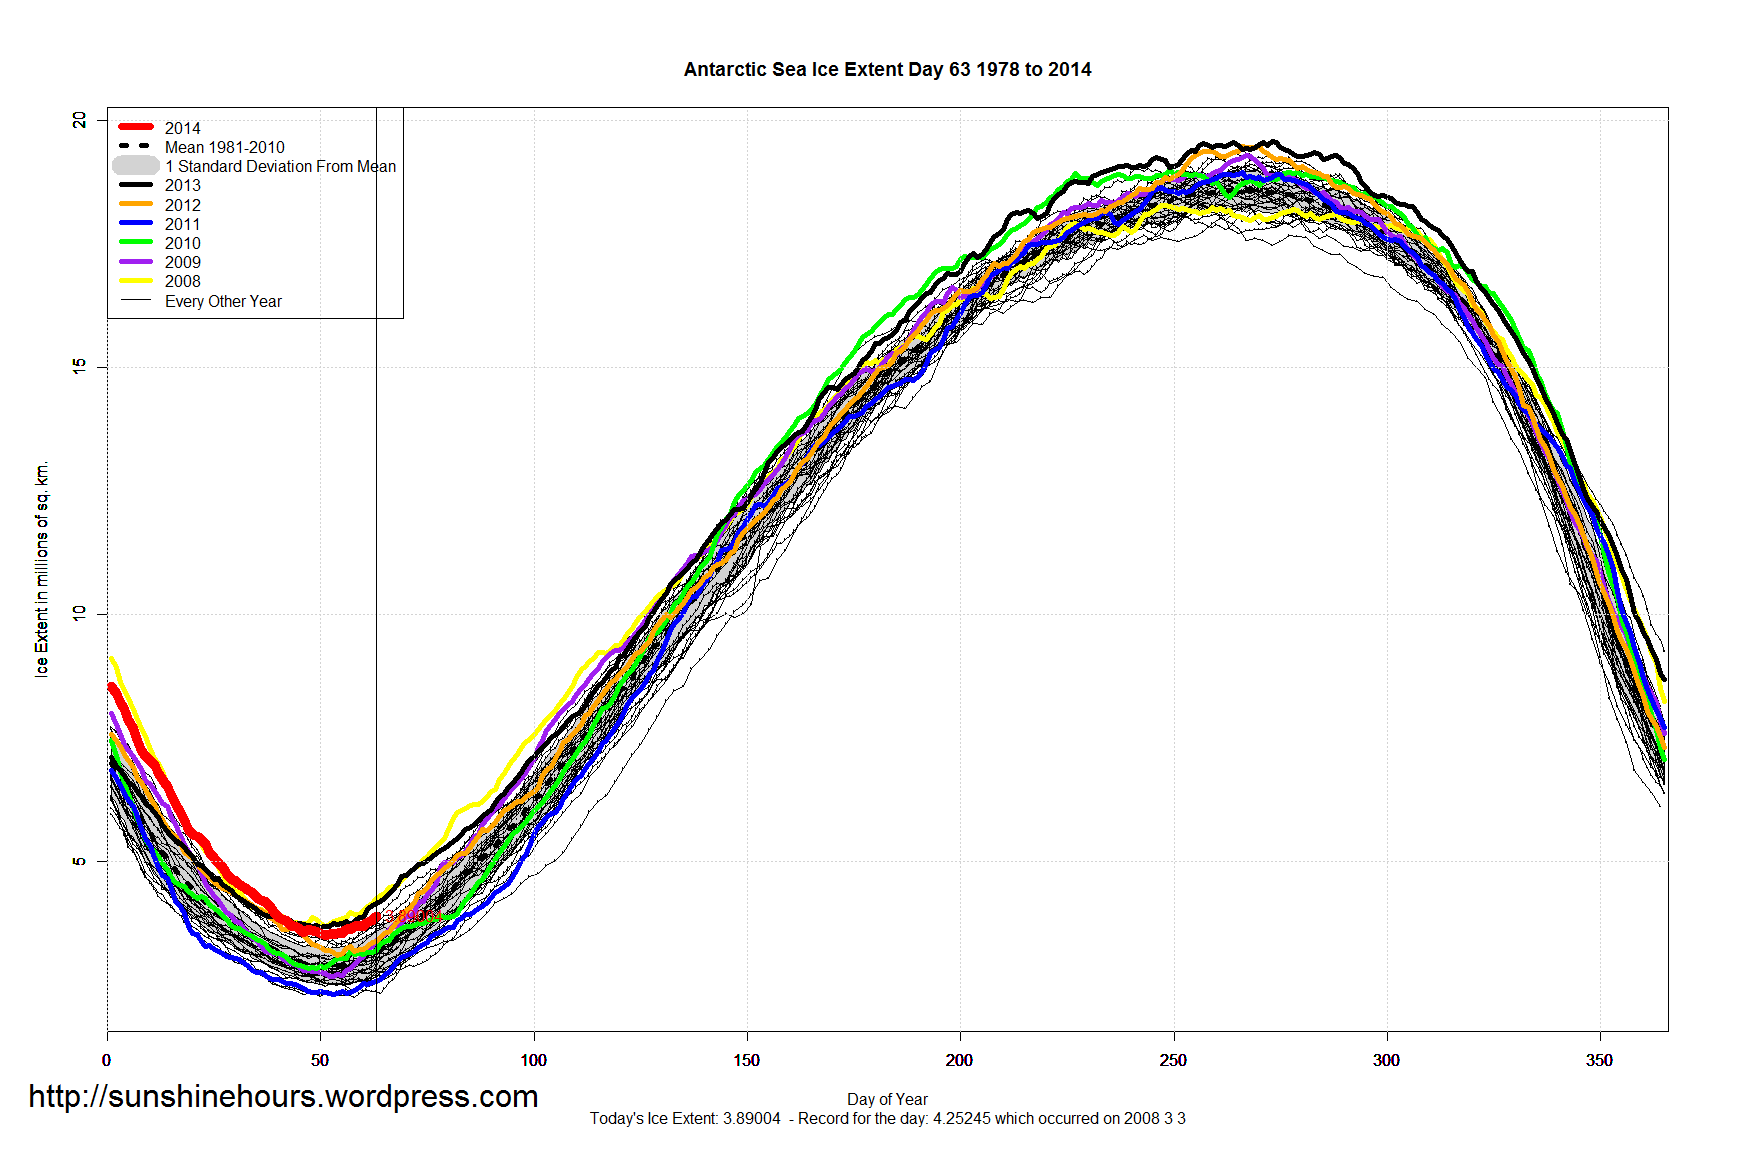
2013 was an average year for Global Sea Ice Extent (thanks to it being a banner year for Antarctic Sea Ice Extent)

The average daily anomaly  was 200,000 sq km above the 1981-2010 mean. That would be 15th highest since 1979.

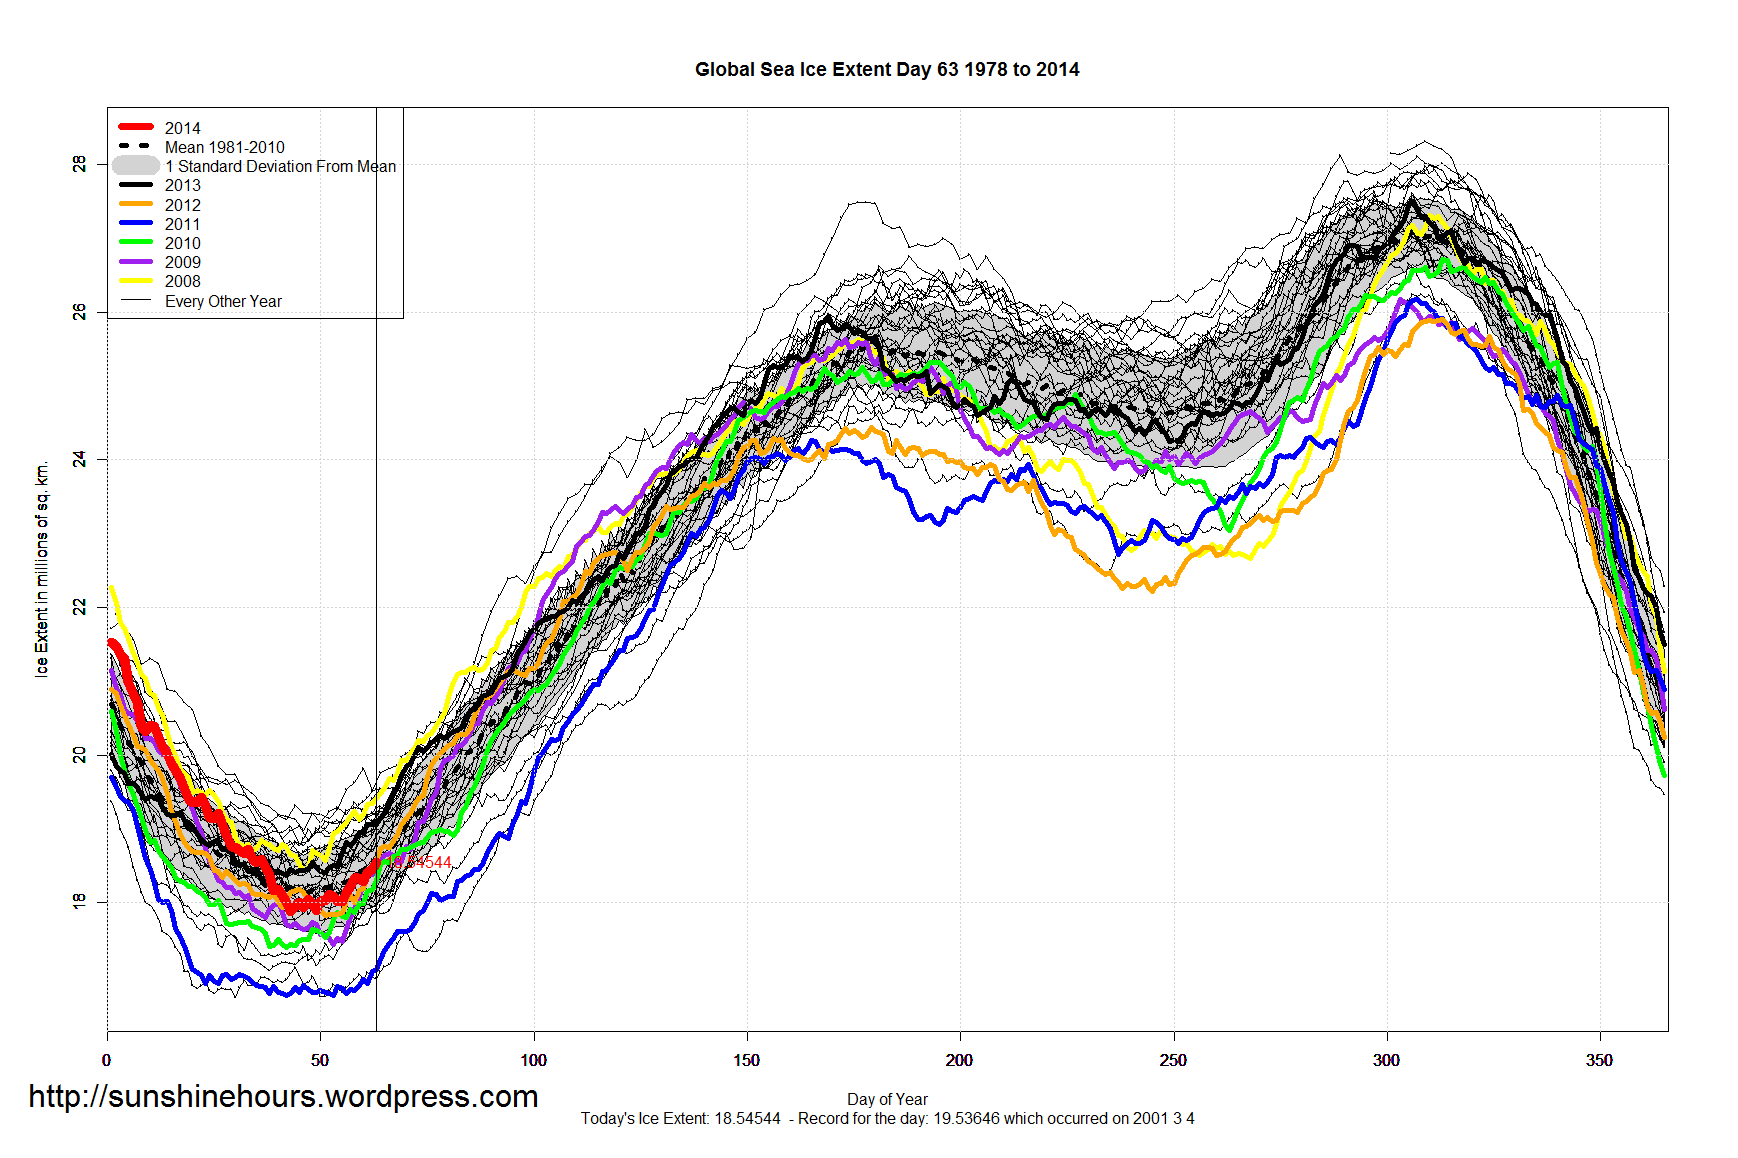
Max Extent of 27.4959 million sq km For Whole Year Occurred On Day: 306 November 2
Max Anomaly For Whole Year Occurred On Day: 353 December 19 = 0.9459423  million sq km
Max Anomaly % For Whole Year Occurred On Day: 73 March 14 = 4.72%

There were zero daily records set and no 2nd places.

Here are the key stats for each year. Min/Max/Anomaly in millions sq km.

Year Min Max day of Max day of Min Avg Anomaly
1979 19.09222 27.48859 176 38 0.79
1980 18.5996 28.11968 289 57 0.37
1981 18.18091 27.48105 291 45 0.35
1982 18.76482 27.83626 306 42 0.85
1983 18.84029 27.89772 307 47 0.5
1984 17.71544 27.18759 316 40 0.13
1985 17.92867 27.61347 306 50 0.37
1986 18.80319 27.00445 317 45 0.08
1987 18.98408 27.15319 317 46 0.46
1988 18.15105 27.88244 319 45 0.46
1989 18.00758 27.50341 299 48 0.17
1990 18.3706 27.36396 294 45 -0.12
1991 17.96976 27.05178 309 63 0.07
1992 17.95822 27.58992 322 60 0.29
1993 17.84281 27.99757 310 57 0.12
1994 18.57179 27.97479 309 43 0.56
1995 18.49688 27.11473 306 45 -0.01
1996 17.79264 27.46173 293 57 0.39
1997 17.65372 27.04273 310 57 -0.17
1998 18.47935 27.58827 297 47 0.27
1999 17.94246 27.58386 306 62 0.23
2000 17.5882 26.93691 302 49 0.04
2001 18.52515 26.75864 319 38 0.05
2002 18.08847 26.81604 297 55 -0.64
2003 18.72494 27.09882 306 43 0.14
2004 18.31746 27.09686 316 51 -0.01
2005 17.07721 27.37923 308 38 -0.62
2006 16.7209 27.09882 298 30 -0.99
2007 17.21196 26.24784 308 47 -1.05
2008 18.43071 27.30686 310 46 0
2009 17.43751 26.17157 303 53 -0.24
2010 17.39862 26.71555 313 42 -0.4
2011 16.74368 26.17913 307 42 -1.24
2012 17.82476 25.90133 313 51 -0.81
2013 18.21356 27.4959 306 37 0.2

The Year End Graph.

Global_Sea_Ice_Extent_2013_Day_365_1981-2010