MASIE June 17 2014 – Arctic Sea Ice Up Over Last 3 Days

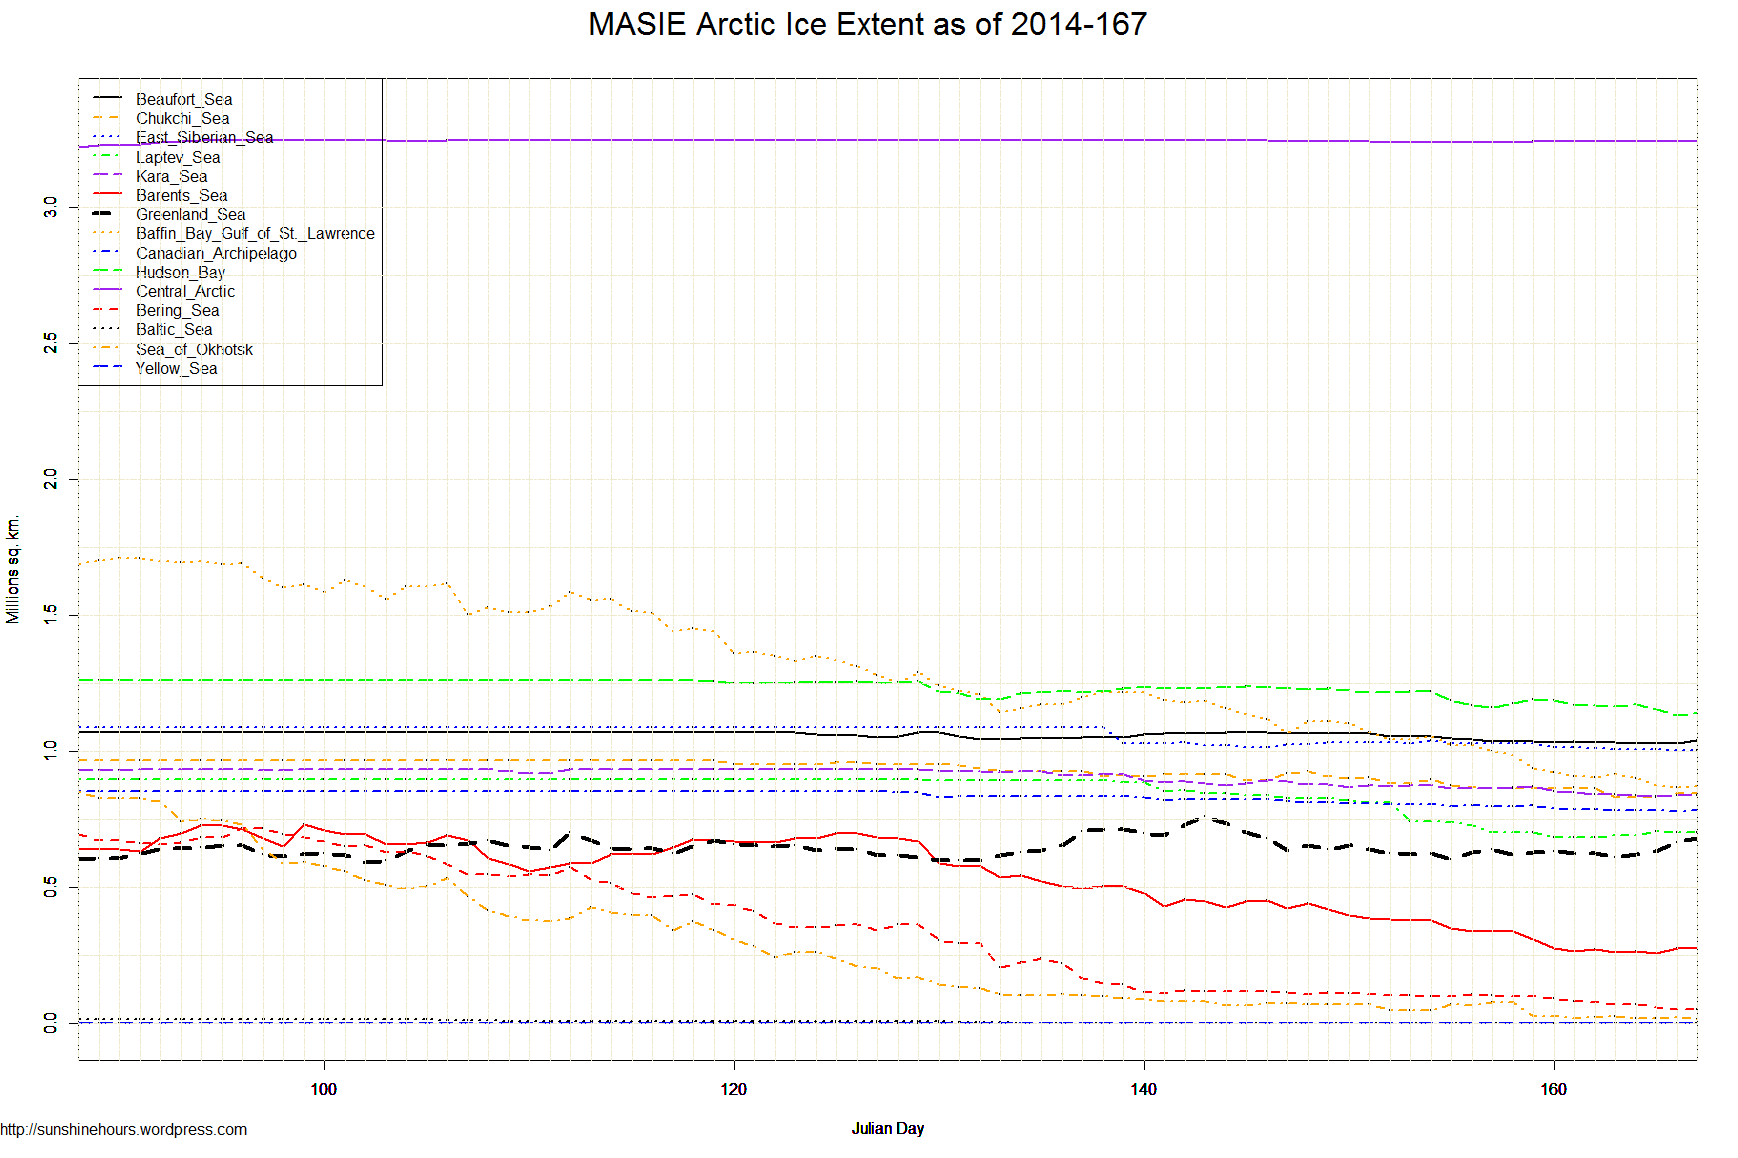
June 17 2014  MASIE Update – According to MASIE Arctic Sea Ice is up 28,401 over the last 3 days


7 regions have a net gain for last 3 days. Greenland Sea is the big gainer.

Region Start End Last 79 Last 28 Last 14 Last 7 Last 3 Last 1
Baffin Bay Gulf of St. Lawrence 1,688,530 872,963 -815,568 -342,840 -172,753 -51,216 -28,850 5,785
Hudson Bay 1,260,903 1,140,749 -120,154 -90,558 -80,991 -47,516 -32,539 7,709
Bering Sea 697,324 52,799 -644,525 -92,626 -50,482 -41,676 -16,162 0
Chukchi Sea 966,006 846,814 -119,192 -67,648 -37,922 -18,060 16,608 0
Kara Sea 933,859 840,006 -93,854 -76,631 -34,108 -13,967 1,559 0
Sea of Okhotsk 853,240 16,272 -836,967 -77,483 -32,293 -9,492 -3,419 -5,020
East Siberian Sea 1,087,137 1,005,353 -81,784 -23,042 -25,952 -8,627 -1,563 0
Canadian Archipelago 853,214 785,240 -67,974 -48,285 -22,230 -7,658 1,926 3,421
Baltic Sea 15,337 0 -15,337 0 0 0 0 0
Yellow Sea 0 0 0 0 0 0 0 0
Barents Sea 645,917 275,816 -370,101 -230,008 -101,902 171 11,868 0
Central Arctic 3,221,921 3,243,659 21,738 -3,161 3,853 1,703 -39 0
Beaufort Sea 1,070,445 1,039,609 -30,836 -12,967 -16,747 5,347 8,047 9,199
Laptev Sea 897,845 704,210 -193,634 -181,040 -39,909 18,180 13,055 0
Greenland Sea 603,416 680,576 77,161 -31,751 58,656 46,977 57,910 12,906
Northern Hemisphere (Total) 14,805,115 11,505,595 -3,299,520 -1,277,718 -552,395 -125,448 28,401 33,999
NH (Average Loss per Day) -41,244 -45,633 -39,457 -17,921 9,467 33,999

MASIE Arctic Ice Extent as of 2014-167

MASIE Arctic June 15 2014 – Melt Slows Down A Little Over Last 3 Days

June 15 2014  MASIE Update – Laptev Sea and Greenland Sea and Central Arctic are the three gainers over the last week. 

Thanks to those small gains, the melt has slowed down just a little to -32,825 per day over last 3 days. The average for the last 28 days is -50,272 per day.

Region Start End Last77 Last28 Last14 Last7 Last3 Last1
Baffin Bay Gulf of St. Lawrence 1,688,530 874,825 -813,705 -324,970 -194,710 -110,946 -29,215 -26,987
Barents Sea 645,917 259,620 -386,297 -236,053 -127,835 -78,608 -11,819 -4,328
Sea of Okhotsk 853,240 17,969 -835,271 -86,198 -54,150 -59,825 -4,073 -1,722
Bering Sea 697,324 60,292 -637,031 -106,752 -47,382 -39,056 -16,737 -8,669
Kara Sea 933,859 836,428 -97,432 -76,848 -40,492 -33,265 -4,510 -2,019
Chukchi Sea 966,006 831,093 -134,913 -97,599 -75,415 -31,760 -33,534 888
East Siberian Sea 1,087,137 1,007,598 -79,539 -79,539 -27,456 -23,661 -4,937 681
Hudson Bay 1,260,903 1,155,003 -105,901 -62,511 -63,651 -22,434 -15,144 -18,286
Canadian Archipelago 853,214 782,534 -70,680 -50,991 -27,199 -17,379 -4,122 -780
Beaufort Sea 1,070,445 1,031,227 -39,218 -21,800 -33,859 -6,667 -3,942 -335
Baltic Sea 15,337 0 -15,337 0 0 0 0 0
Yellow Sea 0 0 0 0 0 0 0 0
Laptev Sea 897,845 707,490 -190,354 -185,852 -105,157 3,075 22,277 16,335
Central Arctic 3,221,921 3,243,698 21,776 -3,050 2,386 3,169 1,999 0
Greenland Sea 603,416 631,794 28,379 -75,775 -8,538 9,800 5,283 9,128
Northern Hemisphere (Total) 14,805,115 11,441,099 -3,364,015 -1,407,617 -803,072 -407,171 -98,474 -36,094
NH (Average Loss per Day) -43,128 -50,272 -57,362 -58,167 -32,825 -36,094

MASIE Arctic Ice Extent as of 2014-165

MASIE June 12 2014 – Central Arctic and Greenland Sea last two regions with more ice now than 74 days ago

June 12 2014  MASIE Update – Central Arctic and Greenland Sea last two regions with more ice now than 74 days ago

Also, a slight slowdown only in the last 1 day. Ice on dropped -17,601.

Region Start End Last 74 Last 28 Last 14 Last 7 Last 3 Last 1
Baffin Bay Gulf of St. Lawrence 1,688,530 904,040 -784,490 -253,963 -208,362 -120,139 -32,622 -5,302
Barents Sea 645,917 271,439 -374,478 -272,700 -168,751 -76,979 -38,919 6,909
Laptev Sea 897,845 685,213 -212,631 -208,129 -141,366 -54,414 -19,202 -817
Sea of Okhotsk 853,240 22,042 -831,197 -80,052 -49,182 -47,337 -4,905 1,504
Kara Sea 933,859 840,937 -92,922 -87,640 -37,900 -25,513 -29,354 -9,835
Bering Sea 697,324 77,030 -620,294 -146,473 -31,857 -24,151 -22,319 -4,679
Hudson Bay 1,260,903 1,170,147 -90,757 -43,330 -59,925 -18,886 -20,428 -231
East Siberian Sea 1,087,137 1,012,535 -74,602 -74,602 -14,726 -18,192 -18,724 -1,446
Beaufort Sea 1,070,445 1,035,169 -35,276 -13,379 -30,935 -13,864 -2,725 -1,235
Chukchi Sea 966,006 864,628 -101,379 -63,686 -63,816 -12,345 1,774 -2,176
Canadian Archipelago 853,214 786,656 -66,558 -47,527 -27,820 -11,191 -14,571 -1,060
Baltic Sea 15,337 0 -15,337 -2,673 0 0 0 0
Yellow Sea 0 0 0 0 0 0 0 0
Central Arctic 3,221,921 3,241,698 19,777 -6,044 7 2,003 6 -400
Greenland Sea 603,416 626,511 23,096 -3,170 -27,694 24,406 -3,669 781
Northern Hemisphere (Total) 14,805,115 11,539,574 -3,265,541 -1,303,336 -862,280 -396,216 -205,273 -17,601
NH (Average Loss per Day) -43,541 -46,548 -61,591 -56,602 -68,424 -17,601

MASIE Arctic Ice Extent as of 2014-162

MASIE June 7 2014 – Greenland Sea and Sea of Okhotsk stubbornly gain some ice.

June 4 2014  MASIE Update – Greenland Sea and Sea of Okhotsk stubbornly gain some ice.

Region Start End Last69 Last28 Last14 Last7 Last3 Last1
Laptev Sea 897,845 704,416 -193,429 -193,429 -140,139 -114,439 -39,703 -23,197
Baffin Bay Gulf of St. Lawrence 1,688,530 1,001,337 -687,193 -289,451 -182,322 -102,281 -54,574 -22,648
Hudson Bay 1,260,903 1,163,482 -97,422 -94,674 -67,207 -61,975 -56,955 -5,924
Barents Sea 645,917 340,785 -305,132 -330,643 -107,180 -56,322 -36,933 2,164
Chukchi Sea 966,006 862,854 -103,153 -90,531 -51,824 -40,148 -34,210 -6,618
Beaufort Sea 1,070,445 1,037,039 -33,406 -33,406 -30,100 -29,604 -19,317 -6,823
Greenland Sea 603,416 640,036 36,621 30,036 -121,973 -14,988 15,509 11,209
Canadian Archipelago 853,214 799,599 -53,616 -50,666 -25,763 -10,672 -7,872 -1,801
Bering Sea 697,324 103,387 -593,937 -259,667 -14,249 -6,908 1,942 -3,014
Kara Sea 933,859 864,570 -69,289 -70,453 -19,735 -5,255 -9,543 -1,089
East Siberian Sea 1,087,137 1,031,259 -55,879 -55,879 10,358 -3,028 -9,477 224
Central Arctic 3,221,921 3,240,529 18,608 -7,484 -6,237 -819 723 -73
Baltic Sea 15,337 0 -15,337 -7,864 0 0 0 0
Yellow Sea 0 0 0 0 0 0 0 0
Sea of Okhotsk 853,240 78,049 -775,191 -91,319 -3,103 5,721 29,484 12,685
Northern Hemisphere (Total) 14,805,115 11,868,484 -2,936,631 -1,545,864 -759,503 -441,057 -220,926 -44,904
NH (Average Loss per Day) -41,952 -55,209 -54,250 -63,008 -73,642 -44,904

MASIE Arctic Ice Extent as of 2014-157

MASIE June 4 2014 – Arctic Ice Extent By Region – A Day of More Ice

June 4 2014  MASIE Update – Arctic Sea Ice actually rose 31,421 sq km over the last day because of the Chukchi Sea, Greenland Sea, East Siberian Sea and Baffin Bay.

This is the gain/loss up to day 154. Negative = loss. Sorted with biggest loser in last 7 days at top. Northern Hemisphere is the grand total.

Region Start End Last 66 Last 28 Last 14 Last 7 Last 3 Last 1
Laptev Sea 897,845 744,119 -153,726 -153,726 -141,132 -85,355 -68,528 0
Barents Sea 645,917 377,719 -268,198 -321,345 -101,635 -46,684 -9,736 0
Sea of Okhotsk 853,240 48,565 -804,675 -160,912 -38,775 -24,371 -23,554 0
Chukchi Sea 966,006 897,063 -68,943 -64,211 -12,895 -21,302 -9,445 12,327
Kara Sea 933,859 874,113 -59,746 -60,910 -18,958 -15,004 -2,806 0
Bering Sea 697,324 101,445 -595,879 -263,045 -15,050 -13,627 -6,230 -1,836
Greenland Sea 603,416 624,527 21,112 -16,305 -74,602 -12,264 -15,805 2,607
Baffin Bay Gulf of St. Lawrence 1,688,530 1,055,912 -632,619 -255,952 -160,732 -11,265 -13,623 10,196
Hudson Bay 1,260,903 1,220,436 -40,467 -37,052 -14,444 -10,029 1,782 -1,304
Beaufort Sea 1,070,445 1,056,356 -14,089 -3,767 -7,416 -9,749 -8,730 0
Canadian Archipelago 853,214 807,471 -45,744 -45,744 -22,296 -7,728 -2,262 0
Central Arctic 3,221,921 3,239,806 17,885 -8,207 -7,104 -4,176 -1,505 0
Baltic Sea 15,337 0 -15,337 -8,402 0 0 0 0
Yellow Sea 0 0 0 0 0 0 0 0
East Siberian Sea 1,087,137 1,040,736 -46,401 -46,401 12,341 14,074 5,682 9,431
Northern Hemisphere (Total) 14,805,115 12,089,410 -2,715,704 -1,447,027 -602,763 -247,817 -154,761 31,421
NH (Average Loss per Day) -40,533 -51,680 -43,054 -35,402 -51,587 31,421

MASIE Arctic Ice Extent as of 2014-154

MASIE June 2 2014 – Arctic Ice Extent By Region As of Day 152

June 2 2014  MASIE Update

This is the gain/loss up to day 152. Negative = loss. Sorted with biggest loser in last 7 days at top. Northern Hemisphere is the grand total.


Region Start End Last 64 Last 28 Last 14 Last 7 Last 3 Last 1
Baffin Bay Gulf of St. Lawrence 1,688,530 1,043,246 -645,284 -307,375 -174,654 -94,659 -67,951 -26,289
Greenland Sea 603,416 625,730 22,314 -12,228 -88,003 -77,276 -16,113 -14,602
Barents Sea 645,917 384,752 -261,165 -294,758 -121,072 -63,635 -35,573 -2,703
Laptev Sea 897,845 812,647 -85,198 -85,198 -80,695 -27,269 -13,638 0
Hudson Bay 1,260,903 1,218,054 -42,849 -36,638 -1,601 -21,791 -14,010 -600
Sea of Okhotsk 853,240 48,565 -804,675 -211,784 -51,509 -19,439 -22,078 -23,554
Canadian Archipelago 853,214 807,471 -45,744 -45,744 -26,055 -15,659 -6,206 -2,262
Bering Sea 697,324 103,281 -594,042 -251,810 -43,526 -13,488 -12,554 -4,393
Beaufort Sea 1,070,445 1,056,356 -14,089 -7,785 3,780 -13,149 -10,567 -8,730
Kara Sea 933,859 872,281 -61,578 -62,742 -44,356 -12,319 -6,623 -4,639
Chukchi Sea 966,006 884,736 -81,270 -66,680 -25,163 -10,418 -24,745 -21,772
Central Arctic 3,221,921 3,240,263 18,342 -7,750 -6,557 -7,153 -1,375 -1,048
Baltic Sea 15,337 0 -15,337 -8,219 0 0 0 0
Yellow Sea 0 0 0 0 0 0 0 0
East Siberian Sea 1,087,137 1,035,054 -52,083 -52,083 -52,083 20,938 1,015 0
Northern Hemisphere (Total) 14,805,115 12,133,578 -2,671,537 -1,451,859 -711,559 -355,671 -230,756 -110,593
NH (Average Loss per Day) -41,101 -51,852 -50,826 -50,810 -76,919 -110,593

MASIE Arctic Ice Extent as of 2014-152

MASIE May 31 2014 – Arctic Ice Extent By Region As of Day 150

May 31 2014  MASIE Update

This is the gain/loss up to day 150. Negative = loss. Sorted with biggest loser in last 7 days at top. Northern Hemisphere is the grand total.

While melting resumed in many regions over the last one day, over the last 3 days daily melt was only -9,229 sq km per day.

The Greenland Sea continues to climb.

Region Start End Last 62 Last 28 Last 14 Last 7 Last 3 Last 1
Greenland Sea 603,416 655,024 51,609 4,140 -90 -106,985 18,233 13,181
Baffin Bay Gulf of St. Lawrence 1,688,530 1,103,619 -584,912 -245,220 -69,982 -80,040 36,442 -7,578
Barents Sea 645,917 397,108 -248,810 -267,741 -108,359 -50,858 -27,296 -23,217
Laptev Sea 897,845 818,855 -78,990 -78,990 -74,487 -25,700 -10,619 -7,430
Canadian Archipelago 853,214 810,271 -42,943 -42,943 -23,912 -15,090 -4,928 -3,406
Kara Sea 933,859 869,825 -64,034 -65,198 -44,437 -14,481 -19,292 -9,079
Chukchi Sea 966,006 903,001 -63,005 -49,419 -23,794 -11,676 -15,364 -6,480
Sea of Okhotsk 853,240 72,328 -780,912 -172,684 -34,867 -8,824 -608 1,685
Bering Sea 697,324 110,295 -587,029 -259,246 -112,201 -7,340 -4,777 -5,541
Central Arctic 3,221,921 3,241,348 19,427 -6,665 -5,400 -5,418 -2,634 -290
Hudson Bay 1,260,903 1,225,457 -35,446 -25,002 6,010 -5,232 -5,008 -6,607
Beaufort Sea 1,070,445 1,066,643 -3,802 -3,802 16,656 -495 539 -280
Baltic Sea 15,337 0 -15,337 -8,219 0 0 0 0
Yellow Sea 0 0 0 0 0 0 0 0
East Siberian Sea 1,087,137 1,034,287 -52,850 -52,850 -52,850 13,387 7,625 248
Northern Hemisphere (Total) 14,805,115 12,309,541 -2,495,574 -1,274,566 -527,729 -318,446 -27,687 -54,792
NH (Average Loss per Day)     -39,612 -45,520 -37,695 -45,492 -9,229 -54,792

MASIE Arctic Ice Extent as of 2014-150

MASIE May 25 2014 – Arctic Ice Extent By Region As of Day 144

May 25 2014  MASIE Update

This is the gain/loss up to day 144. Negative = loss. Sorted with biggest loser in last 7 days at top. Northern Hemisphere is the grand total.

I’ve added a “NH (Average Loss per Day)” line to the bottom of the table.  The interesting figure is that even though a lot of ice melted over the last 1 day, very little melted over the last 3 days: -7,232/day

Region Start End Last 56 Last 28 Last 14 Last 7 Last 3 Last 1
Barents Sea 645,917 426,330 -219,587 -197,492 -161,324 -69,343 -5,468 -21,635
East Siberian Sea 1,087,137 1,020,900 -66,237 -66,237 -66,237 -66,237 -9,601 0
Bering Sea 697,324 116,770 -580,554 -348,719 -187,839 -50,274 4,780 -866
Laptev Sea 897,845 844,555 -53,290 -53,290 -48,104 -48,787 -8,963 0
Baffin Bay Gulf of St. Lawrence 1,688,530 1,159,590 -528,941 -348,384 -82,592 -40,205 -29,385 -24,069
Sea of Okhotsk 853,240 68,004 -785,236 -330,041 -74,417 -36,163 -13,934 -13,148
Kara Sea 933,859 877,476 -56,383 -57,547 -49,337 -35,799 -9,626 -6,829
Chukchi Sea 966,006 914,677 -51,329 -51,329 -38,707 -14,015 -2,244 0
Canadian Archipelago 853,214 823,129 -30,085 -30,085 -9,967 -10,396 1,002 -2,232
Baltic Sea 15,337 0 -15,337 -8,172 -8,065 0 0 0
Yellow Sea 0 0 0 0 0 0 0 0
Central Arctic 3,221,921 3,246,766 24,844 -1,247 -1,247 18 72 0
Beaufort Sea 1,070,445 1,069,505 -940 -940 -940 16,478 4,165 2,367
Hudson Bay 1,260,903 1,235,572 -25,331 -25,331 15,864 18,058 3,072 4,883
Greenland Sea 603,416 736,975 133,559 94,070 136,343 29,406 44,112 -25,034
Northern Hemisphere (Total) 14,805,115 12,541,745 -2,263,370 -1,425,454 -576,650 -306,971 -21,697 -86,242
NH (Average Loss per Day)     -39,708 -50,909 -41,189 -43,853 -7,232 -86,242

MASIE Arctic Ice Extent as of 2014-144

MASIE May 23 2014 – Arctic Ice Extent By Region As of Day 142

May 23 2014  MASIE Update

This is the gain/loss up to day 42. Negative = loss. Sorted with biggest loser in last 7 days at top. Northern Hemisphere is the grand total.

Over the last day Arctic Sea Ice actually rose  71,918 sq km.

Greenland Sea is actually 128,906  higher than it was 54 days ago. Central Arctic is a little higher than 54 days ago.

Region Start End Last 54 Last 28 Last 14 Last 7 Last 3 Last 1
Bering Sea 697,324 123,222 -574,102 -393,550 -241,699 -115,261 -22,203 11,232
Barents Sea 645,917 457,488 -188,429 -163,976 -223,226 -63,857 -48,336 25,690
East Siberian Sea 1,087,137 1,032,550 -54,587 -54,587 -54,587 -54,587 4,155 2,049
Kara Sea 933,859 888,854 -45,006 -46,170 -46,170 -39,891 -27,783 1,751
Laptev Sea 897,845 856,855 -40,990 -40,990 -40,990 -36,487 -28,395 3,337
Sea of Okhotsk 853,240 79,942 -773,298 -330,572 -86,154 -23,851 -13,813 -1,996
Canadian Archipelago 853,214 823,902 -29,312 -29,312 -24,790 -10,281 -9,624 1,774
Chukchi Sea 966,006 916,921 -49,085 -49,085 -35,691 -9,874 2,459 0
Central Arctic 3,221,921 3,246,693 24,772 -1,320 -1,320 -1,049 -126 0
Baltic Sea 15,337 0 -15,337 -8,356 -9,170 0 0 0
Yellow Sea 0 0 0 0 0 0 0 0
Baffin Bay Gulf of St. Lawrence 1,688,530 1,179,599 -508,931 -380,919 -75,117 5,981 -36,203 -9,376
Hudson Bay 1,260,903 1,230,482 -30,422 -30,422 -24,442 13,734 -825 -2,019
Beaufort Sea 1,070,445 1,065,340 -5,105 -5,105 8,745 15,352 12,764 0
Greenland Sea 603,416 732,322 128,906 88,573 113,953 97,131 19,995 39,459
Northern Hemisphere (Total) 14,805,115 12,635,360 -2,169,755 -1,446,806 -741,488 -223,244 -147,953 71,918

MASIE Arctic Ice Extent as of 2014-142

MASIE May 20 2014 – Arctic Ice Extent By Region As of Day 139

May 20 2014  MASIE Update (Data here)

This is the gain/loss up to day 139. Negative = loss. Sorted with biggest loser in last 7 days at top. Northern Hemisphere is the grand total.

According to MASIE Melting over the last 3 days in the Arctic has come to a standstill except for East Siberian Sea. Hudson Bay actually rose 11,652 sq km.

Region Start End Last 51 days Last 28 Last 14 Las t7 Last 3 Last 1
Bering Sea 697,324 145,425 -551,899 -399,331 -214,044 -149,845 -77,071 -1,383
Barents Sea 645,917 505,824 -140,093 -67,499 -193,240 -72,875 358 0
East Siberian Sea 1,087,137 1,028,395 -58,742 -58,742 -58,742 -58,742 -58,742 -58,742
Sea of Okhotsk 853,240 93,755 -759,484 -282,711 -145,795 -34,575 -13,440 -6,319
Chukchi Sea 966,006 914,462 -51,544 -51,544 -46,558 -23,475 -12,332 4,563
Kara Sea 933,859 916,637 -17,222 -1,537 -18,386 -9,778 2,375 0
Laptev Sea 897,845 885,251 -12,594 -12,594 -12,594 -7,408 -8,091 -8,091
Baltic Sea 15,337 0 -15,337 -9,378 -8,402 -3,627 0 0
Canadian Archipelago 853,214 833,526 -19,689 -19,689 -19,689 -1,911 -658 0
Central Arctic 3,221,921 3,246,820 24,899 289 -1,193 -922 72 0
Yellow Sea 0 0 0 0 0 0 0 0
Baffin Bay Gulf of St. Lawrence 1,688,530 1,215,802 -472,728 -318,069 -119,373 4,557 42,202 -2,098
Beaufort Sea 1,070,445 1,052,576 -17,869 -17,869 -7,547 6,574 2,588 0
Hudson Bay 1,260,903 1,231,307 -29,596 -29,596 -23,385 40,731 11,860 11,652
Greenland Sea 603,416 712,327 108,911 75,832 66,638 111,395 57,212 -1,406
Northern Hemisphere (Total) 14,805,115 12,783,313 -2,021,801 -1,193,438 -803,296 -200,271 -53,956 -61,824

MASIE Arctic Ice Extent as of 2014-139