Its important to keep this graph (ie day 168 etc) going because DMI etc have “frozen” their graphs just check. I suspect they are working out how to prevent showing the “rise” Thanks great site
Re DMI previous its 6 days now. Norsex is showing a different trend as well.This has happened before…Any sign that NH ice is recovering at this stage would be a very strong blow on AGW. This is their “sacred cow” LOL
The main DMI ice page is still frozen http://ocean.dmi.dk/arctic/icecover.uk.php makes you wonder whether the page for “the public” should not show that NH ice is still normal.I doubt if many will look at the “old” page. I always thought DMI being Danish would be unbiased but now I am wondering.

Is this why DMI, NOrsex, CT etc are holding back on graphing up to date?Is this real data?
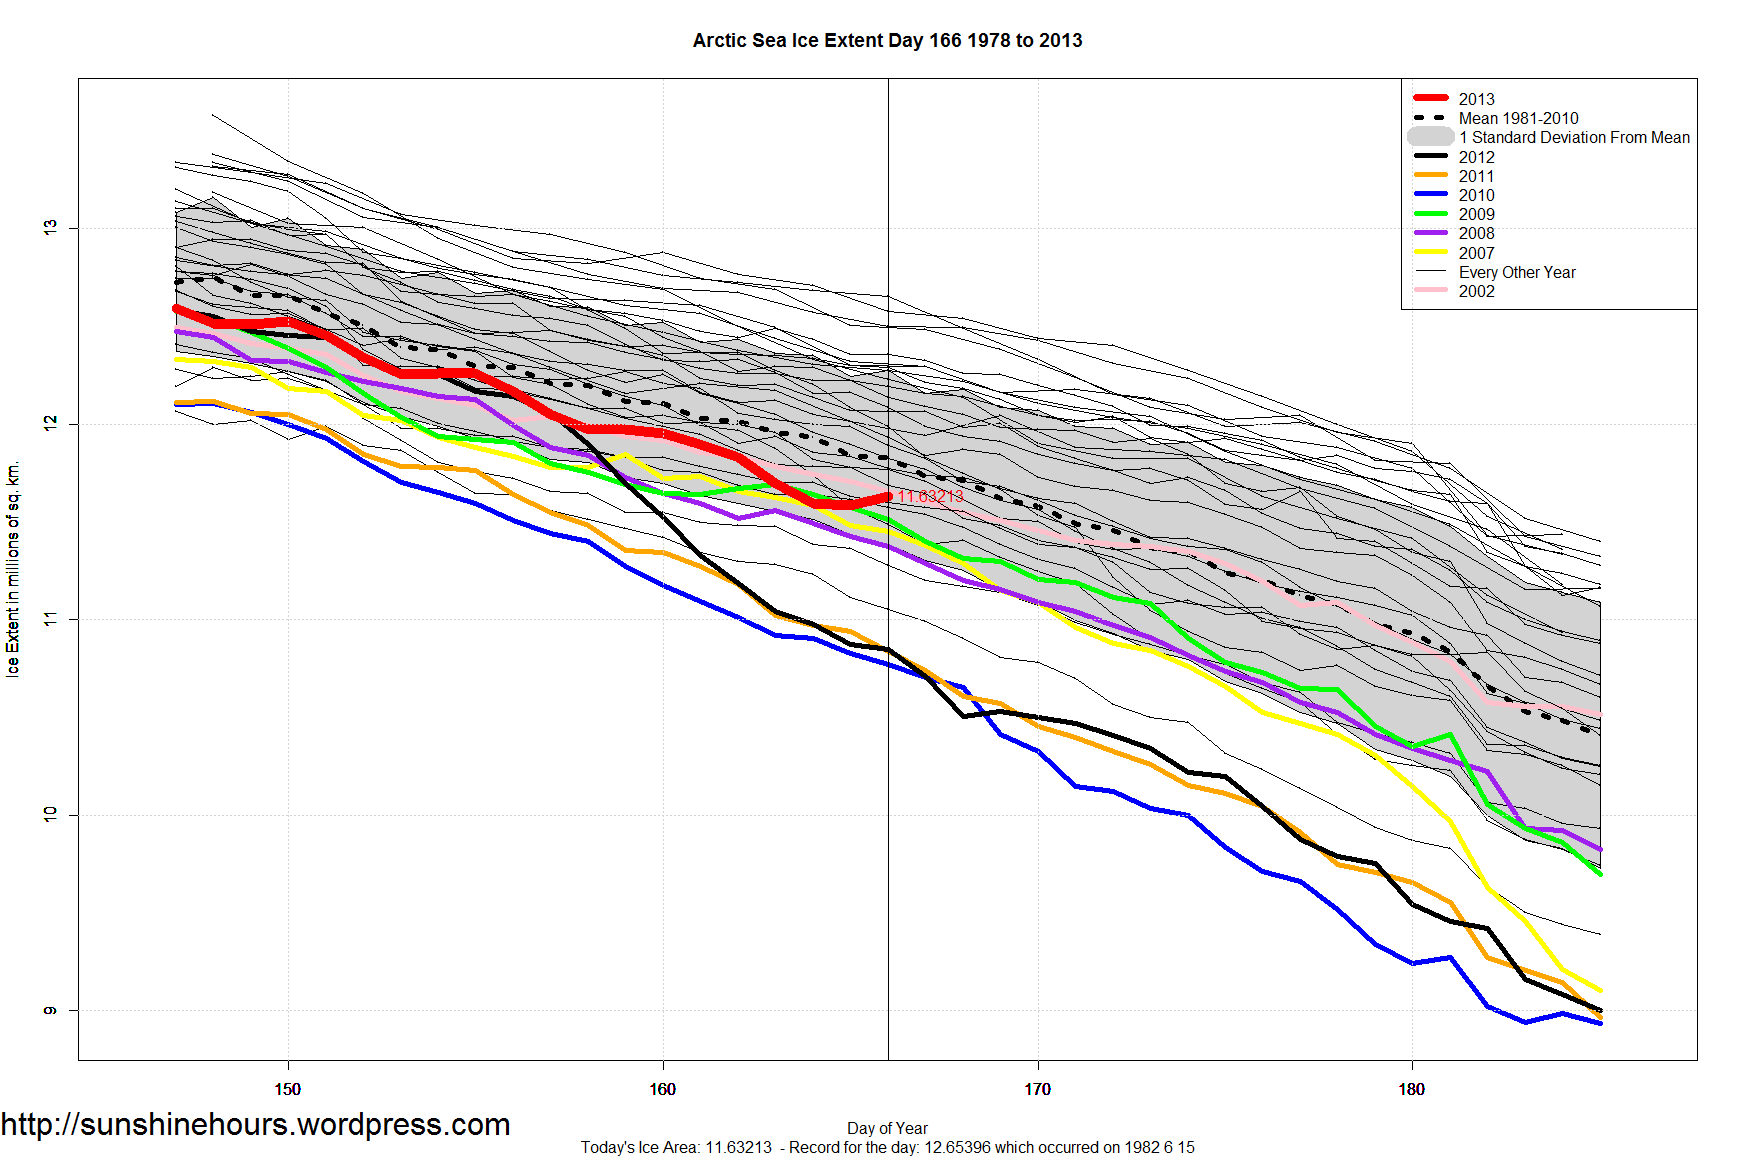
Not sure. This is NSIDC data.
Recent Data: ftp://sidads.colorado.edu/DATASETS/NOAA/G02135/north/daily/data/NH_seaice_extent_nrt.csv
1978 – 2011 here: ftp://sidads.colorado.edu/DATASETS/NOAA/G02135/north/daily/data/NH_seaice_extent_final.csv
I merge them.
Wind? Also DMI’s arctic temp for 80 degree north lat has been running 3-4 degrees C below average for 5 weeks
Its important to keep this graph (ie day 168 etc) going because DMI etc have “frozen” their graphs just check. I suspect they are working out how to prevent showing the “rise” Thanks great site
Re DMI previous its 6 days now. Norsex is showing a different trend as well.This has happened before…Any sign that NH ice is recovering at this stage would be a very strong blow on AGW. This is their “sacred cow” LOL
DMI’s “old plot” is up to date.
http://ocean.dmi.dk/arctic/old_icecover.uk.php
Thanks from paranoia city. That looks normal now still tending to stick within the SD LOL
The main DMI ice page is still frozen
http://ocean.dmi.dk/arctic/icecover.uk.php makes you wonder whether the page for “the public” should not show that NH ice is still normal.I doubt if many will look at the “old” page. I always thought DMI being Danish would be unbiased but now I am wondering.