40 Years of Rising CO2 compared to Temperature

40 Years of Rising CO2 … 1940 to 1979. Officially CO2 measurements only started in the 50s, but I think one can extrapolate backwards.

CO2 didn’t have much effect. The Temperature trend over those 40 years was -0.026C per decade. About -0.1C for the 40 years.

40 Years of rising CO2 a

http://www.woodfortrees.org/plot/hadcrut4gl/from:1940/to:1979/plot/hadcrut4gl/from:1940/to:1979/trend/plot/esrl-co2/from:1940/to:1979/offset:-300/plot/esrl-co2/from:1940/to:1979/offset:-300/trend

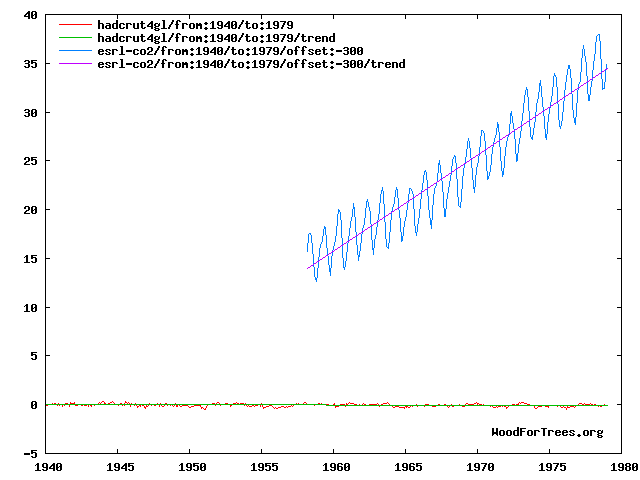
Lets take a look at the same graph without the CO2 part.

40 Years of rising CO2 b

http://www.woodfortrees.org/plot/hadcrut4gl/from:1940/to:1979/plot/hadcrut4gl/from:1940/to:1979/trend

Leave a Reply

Fill in your details below or click an icon to log in:

WordPress.com Logo

You are commenting using your WordPress.com account. Log Out /  Change )

Twitter picture

You are commenting using your Twitter account. Log Out /  Change )

Facebook photo

You are commenting using your Facebook account. Log Out /  Change )

Connecting to %s