I was looking at the HADCET data by month out of curiousity and I noticed that the month of June had a pretty flat trend for a long, long time.
So I thought to myself, how far can I go back with HADCET and get a flat or just slightly flat trend for individual months?
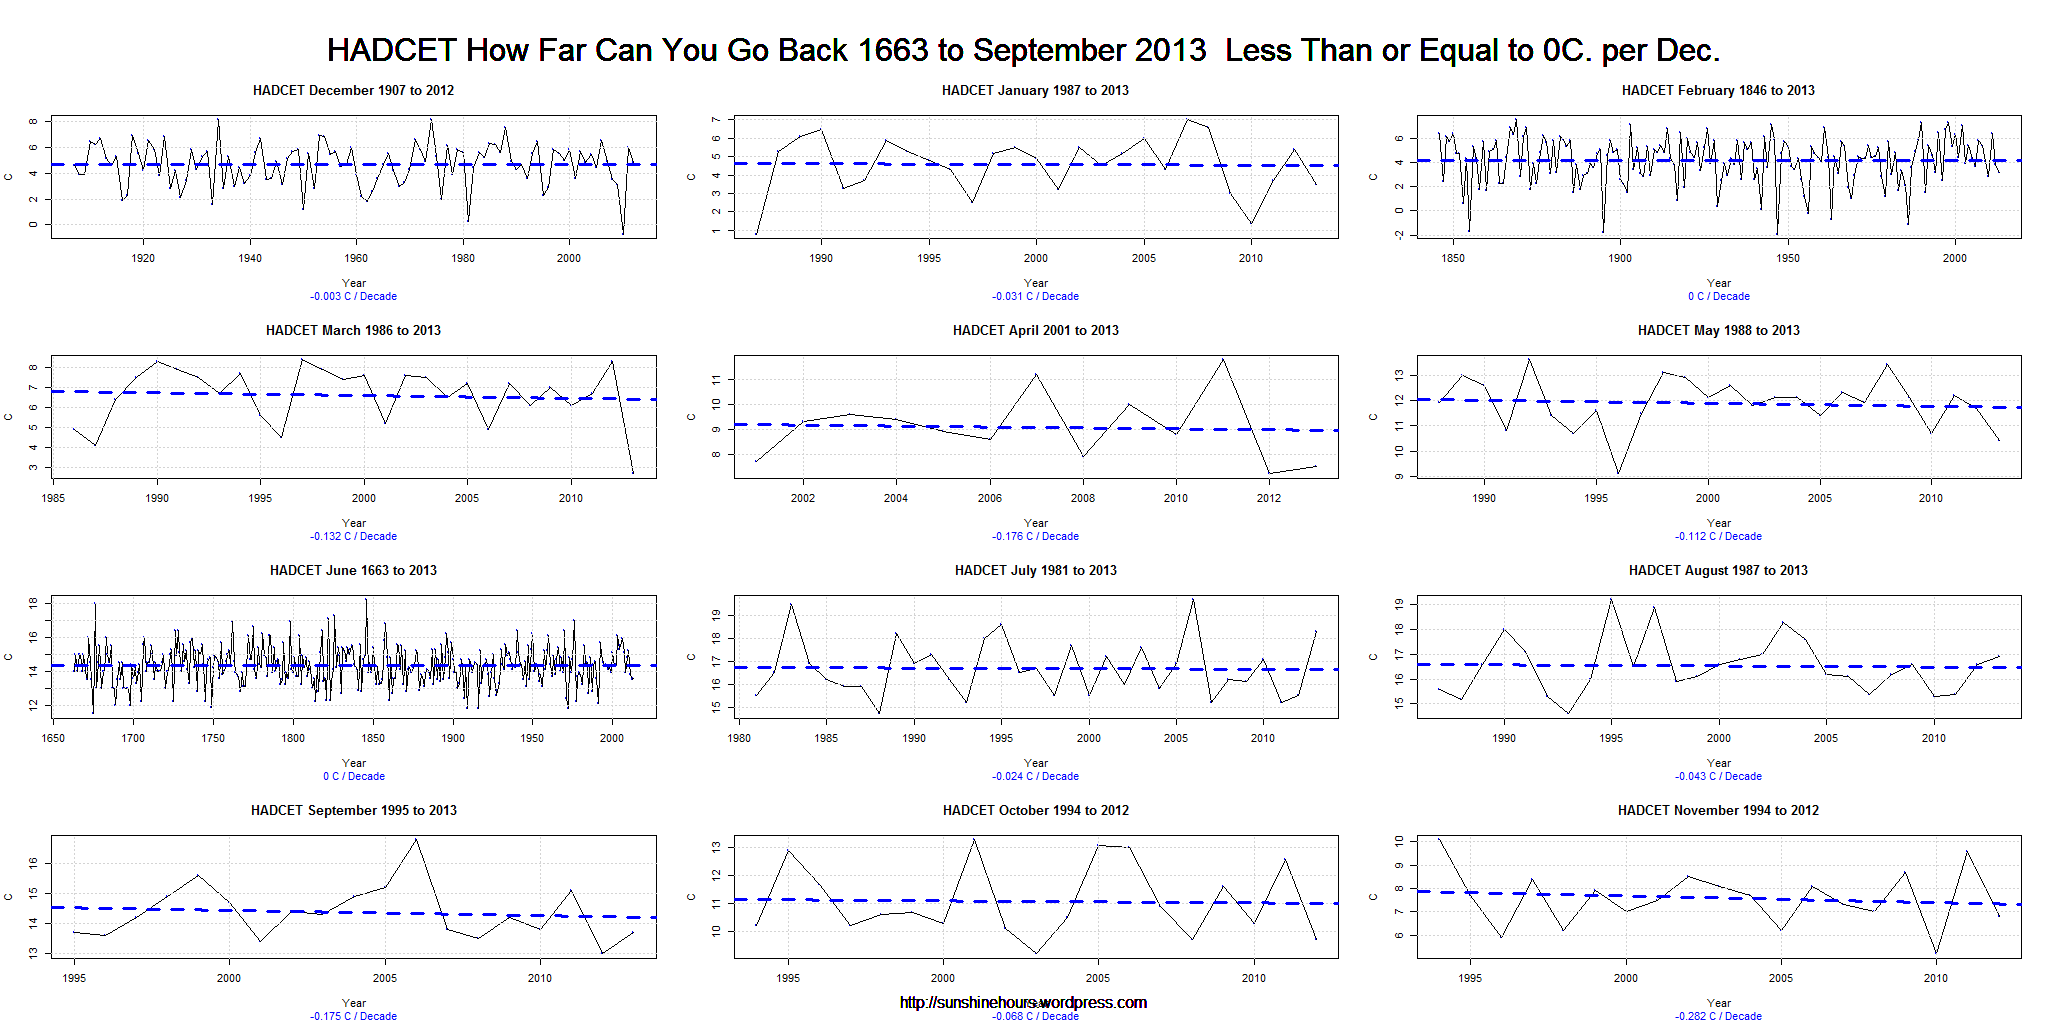
The graph below (click for full size) has a graph for each month. The months are grouped by season. And the data for each month is the the furthest back you can go with a trend of 0C/decade or lower.
The grand champion is June. The trend is 0C/decade from 1663 to 2013.
Wow. Not much of a “Global Warming Signal” in a 350 year flat trend is there?
2nd longest is February with 0C/Decade trend from 1846 to 2013.
3rd longest is December with a -0.003C/Decade trend from 1907 to 2012.
4th is July from 1981. 5th is March from 1986. 6th and 7th is January and August from 1987. May from 1988. October and November from 1994, September from 1995, And April from 2001,
I always wonder why CO2 is such a selective month.

A neat piece of work, well done.
Given that CET is a ‘bellweather’ for global temperatures due to being downwind of a lot of ocean this shows just how stable global temperatures can be whatever forcing elements are thrown at them.
Thanks. I am intermittently fascinated by the stability or contrariness of certain months in the temperature record.