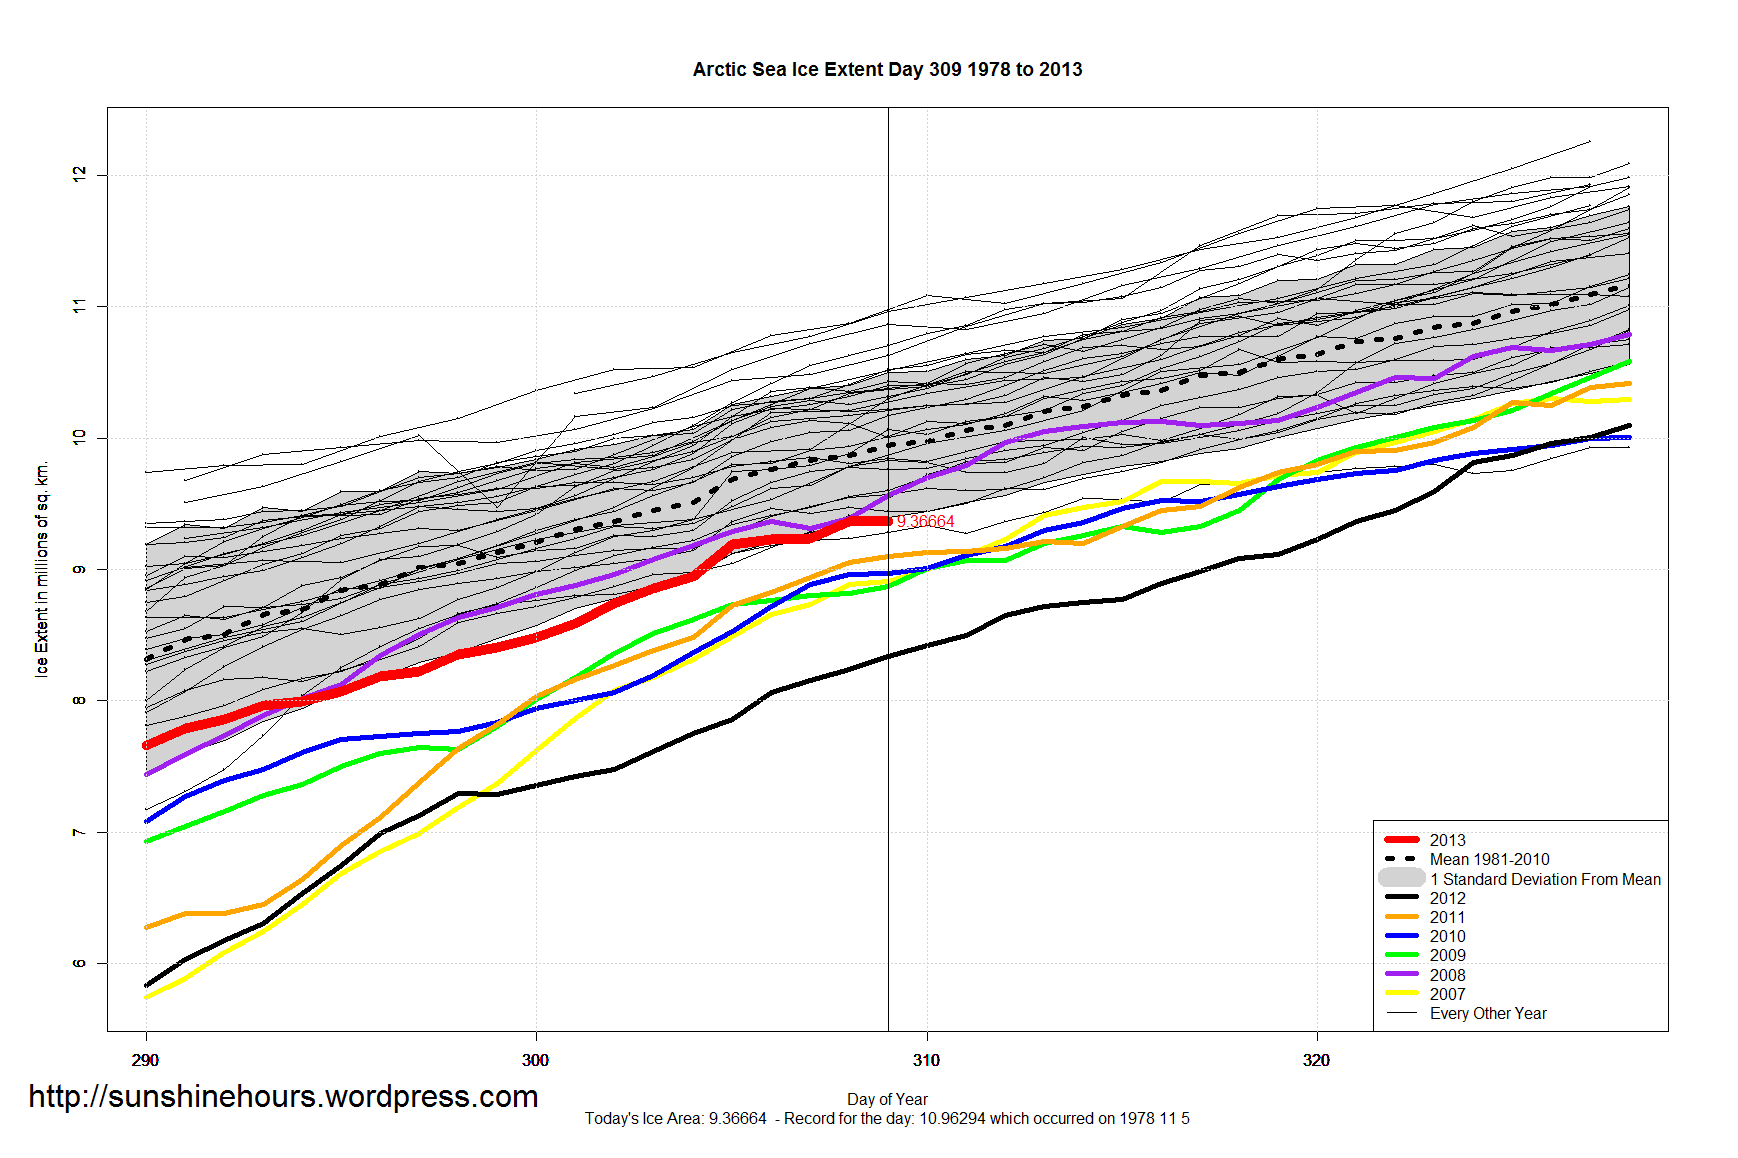
Arctic Sea Ice Extent is just skimming along the bottom of the one standard deviation from the 1981-2010 mean on day 309.
Sea Ice is 580,000 sq km below the mean. Which happens to be about 5.8% since the mean for the day is almost exactly 10 million sq km.
On this day in 2012 Sea Ice was 16% below the mean.

Is this real? Or maybe their sat is dying?
http://osisaf.met.no/p/ice_extent_graphs.php
Good question. Glitches happen. Arctic Extent from NSIDC also shows a drop. Just less dramatic.
Yea, I noticed that.
It looks as though solar activity is playing hell with the transmission of satelite ice data again.
http://nsidc.org/data/seaice_index/