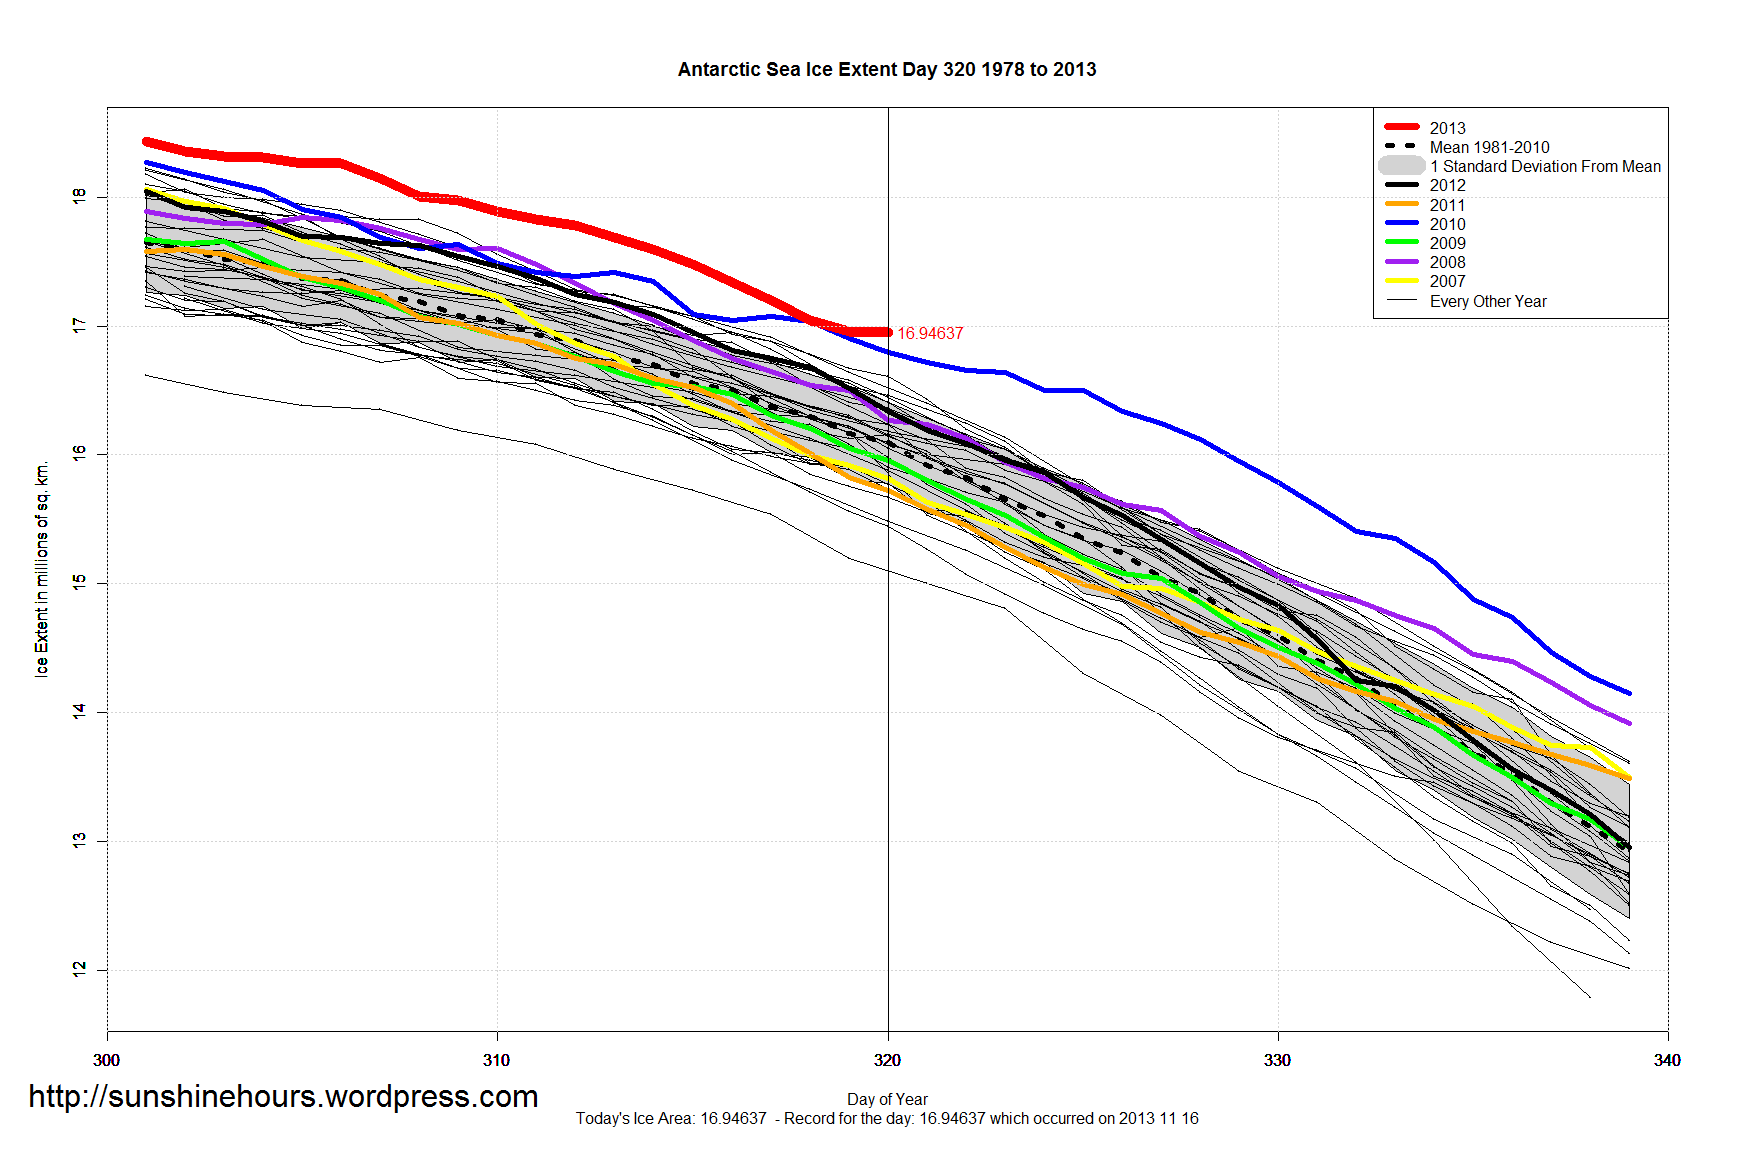
November 16th 2013 (Day 320) saw the 50th Daily Record for Antarctic Sea Ice Extent in a row! It was also the 104th daily record for 2013.
I thought this graph would show 2013 below the 2010 line, but melting slowed from 150,000 sq km per day to 80,000 sq km and then 20,000 sq km per day in the last 2 days.
| Year | No of Records |
| 2008 | 123 |
| 2013 | 104 |
| 2010 | 92 |
| 2007 | 21 |
| 2009 | 8 |
| 2012 | 8 |
| 2000 | 4 |
| 2004 | 3 |
| 1979 | 2 |
| 2006 | 1 |

Reports like this have the CAWC argument up the river without a paddle,
………or……..