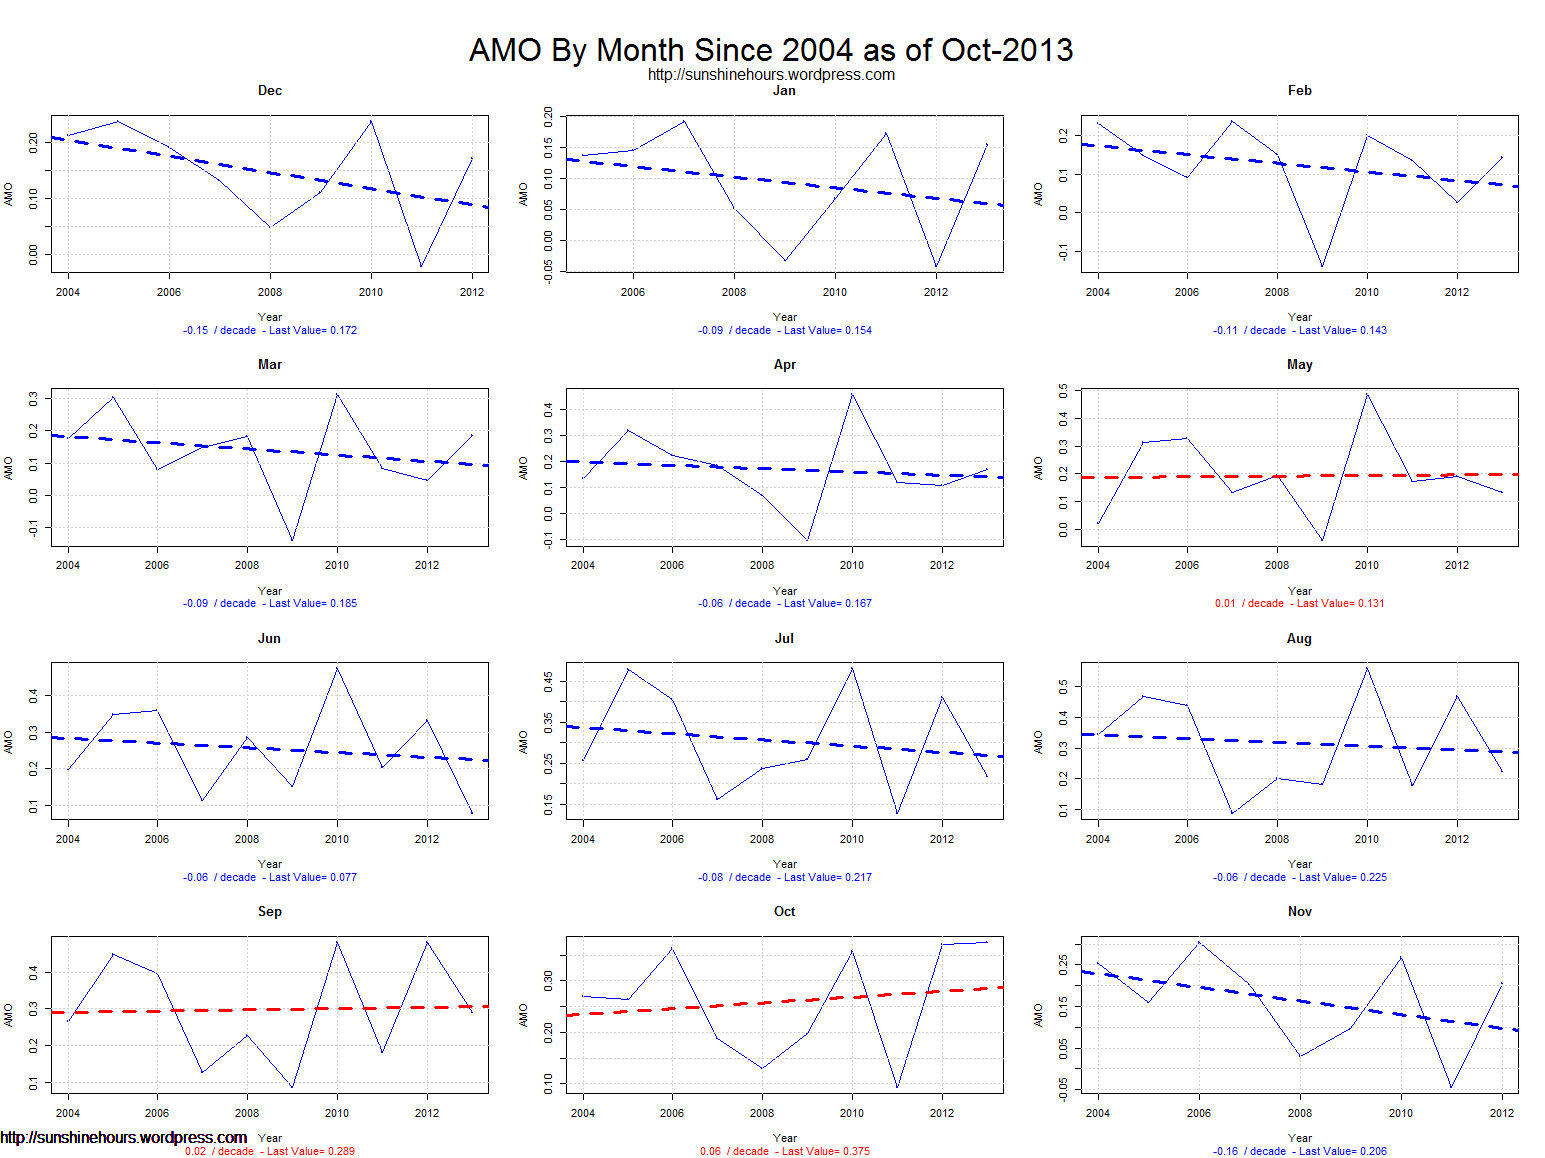
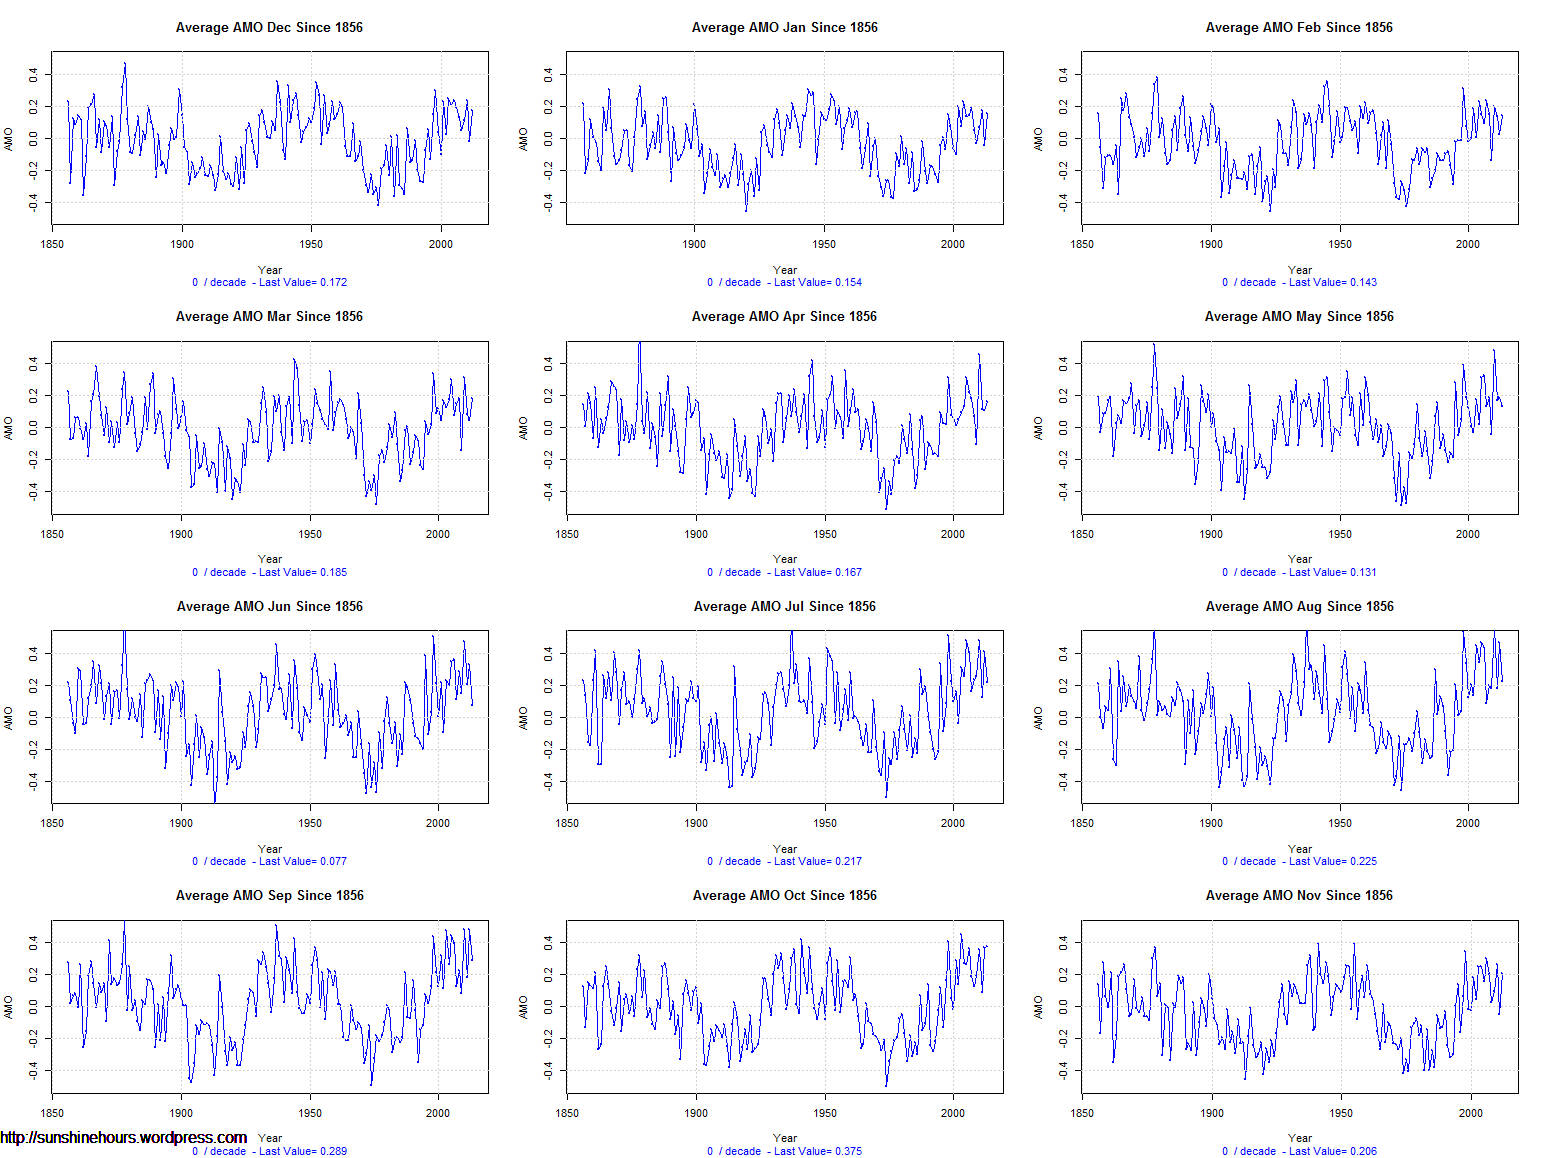
The AMO is definitely linked with climate cycles. Below are two graphs of each month of the AMO. One is from 2004. The other from 1856.
I think the AMO has peaked, but it is still wobbling around at the top of the peak and may continue to do so for several years.
Thw winter months definitely show an alternating saw-tooth pattern going down. If the pattern holds Nov/Dec/Jan/Feb should show a big drop.
But Oct stayed flat when it should have dropped. Who knows.