2013 was a banner year for Antarctic Sea Ice Extent. I enjoy my small role in publicizing this data because the “climate science” profession prefers to ignore Antarctic Sea Ice. Of course it is a little harder for the MSM to ignore Antarctica this year when a ship of “scientists” searching for publicity about lower sea ice caused by “global warming” get stuck in the ice.
The highest maximum for Antarctic Sea Ice Extent of all time was set on October 1st 2013.
The highest average anomaly for a year occurred in 2013. 2013 averaged 850,000 sq km above the 1981-2010 mean.
In 2013, the highest extent ever in each month occurred in July, August, September, October and November.
2013 now has the 2nd highest number of daily records (behind 2008). 2013 also has by far the most “Top 2” days in a year. Only 1979 is left in the list of daily records from before 2000.
| Year | First | Second | Top 2 |
| 2013 | 108 | 149 | 257 |
| 2008 | 121 | 29 | 150 |
| 2010 | 90 | 42 | 132 |
| 2009 | 8 | 33 | 41 |
| 2012 | 8 | 22 | 30 |
| 2006 | 1 | 26 | 27 |
| 1979 | 2 | 12 | 14 |
| 2000 | 4 | 3 | 7 |
| 2004 | 3 | 4 | 7 |
Here are the key stats for each year. Min/Max/Anomaly in millions sq km.
| Year | Min | Max | day of Max | day of Min | Avg Anomaly |
| 1979 | 2.91521 | 18.36699 | 256 | 48 | 0.04 |
| 1980 | 2.52686 | 19.09137 | 267 | 57 | -0.39 |
| 1981 | 2.69524 | 18.85906 | 261 | 51 | -0.21 |
| 1982 | 2.8927 | 18.55004 | 246 | 52 | -0.02 |
| 1983 | 2.84656 | 18.81042 | 263 | 55 | -0.25 |
| 1984 | 2.38292 | 18.37747 | 266 | 58 | -0.2 |
| 1985 | 2.60211 | 18.93215 | 254 | 50 | -0.04 |
| 1986 | 2.95395 | 18.02672 | 261 | 65 | -0.55 |
| 1987 | 3.01642 | 18.52332 | 258 | 52 | -0.24 |
| 1988 | 2.63862 | 18.78456 | 277 | 55 | -0.14 |
| 1989 | 2.7229 | 18.27368 | 266 | 51 | -0.23 |
| 1990 | 2.78435 | 18.3788 | 273 | 53 | -0.24 |
| 1991 | 2.55355 | 18.66993 | 273 | 58 | -0.11 |
| 1992 | 2.49238 | 18.4663 | 255 | 54 | -0.24 |
| 1993 | 2.28078 | 18.709 | 263 | 50 | -0.23 |
| 1994 | 3.08286 | 18.8266 | 243 | 43 | 0.12 |
| 1995 | 3.32988 | 18.7353 | 269 | 55 | 0.15 |
| 1996 | 2.59733 | 18.83039 | 267 | 56 | 0.13 |
| 1997 | 2.26415 | 18.79094 | 265 | 58 | -0.26 |
| 1998 | 2.7715 | 19.2433 | 258 | 56 | 0.08 |
| 1999 | 2.70723 | 18.98068 | 273 | 51 | 0.11 |
| 2000 | 2.58248 | 19.15817 | 272 | 49 | 0.11 |
| 2001 | 3.44094 | 18.49324 | 271 | 50 | 0.02 |
| 2002 | 2.69691 | 18.11556 | 252 | 51 | -0.43 |
| 2003 | 3.6257 | 18.67907 | 268 | 48 | 0.32 |
| 2004 | 3.25927 | 19.12341 | 252 | 51 | 0.32 |
| 2005 | 2.80387 | 19.29451 | 272 | 49 | 0.04 |
| 2006 | 2.4866 | 19.35934 | 264 | 51 | -0.19 |
| 2007 | 2.7227 | 19.08545 | 272 | 50 | 0.03 |
| 2008 | 3.69176 | 18.29726 | 247 | 51 | 0.6 |
| 2009 | 2.67096 | 19.29864 | 267 | 53 | 0.39 |
| 2010 | 2.8422 | 18.9968 | 249 | 47 | 0.45 |
| 2011 | 2.31884 | 18.95328 | 266 | 53 | -0.15 |
| 2012 | 3.11109 | 19.47713 | 266 | 54 | 0.36 |
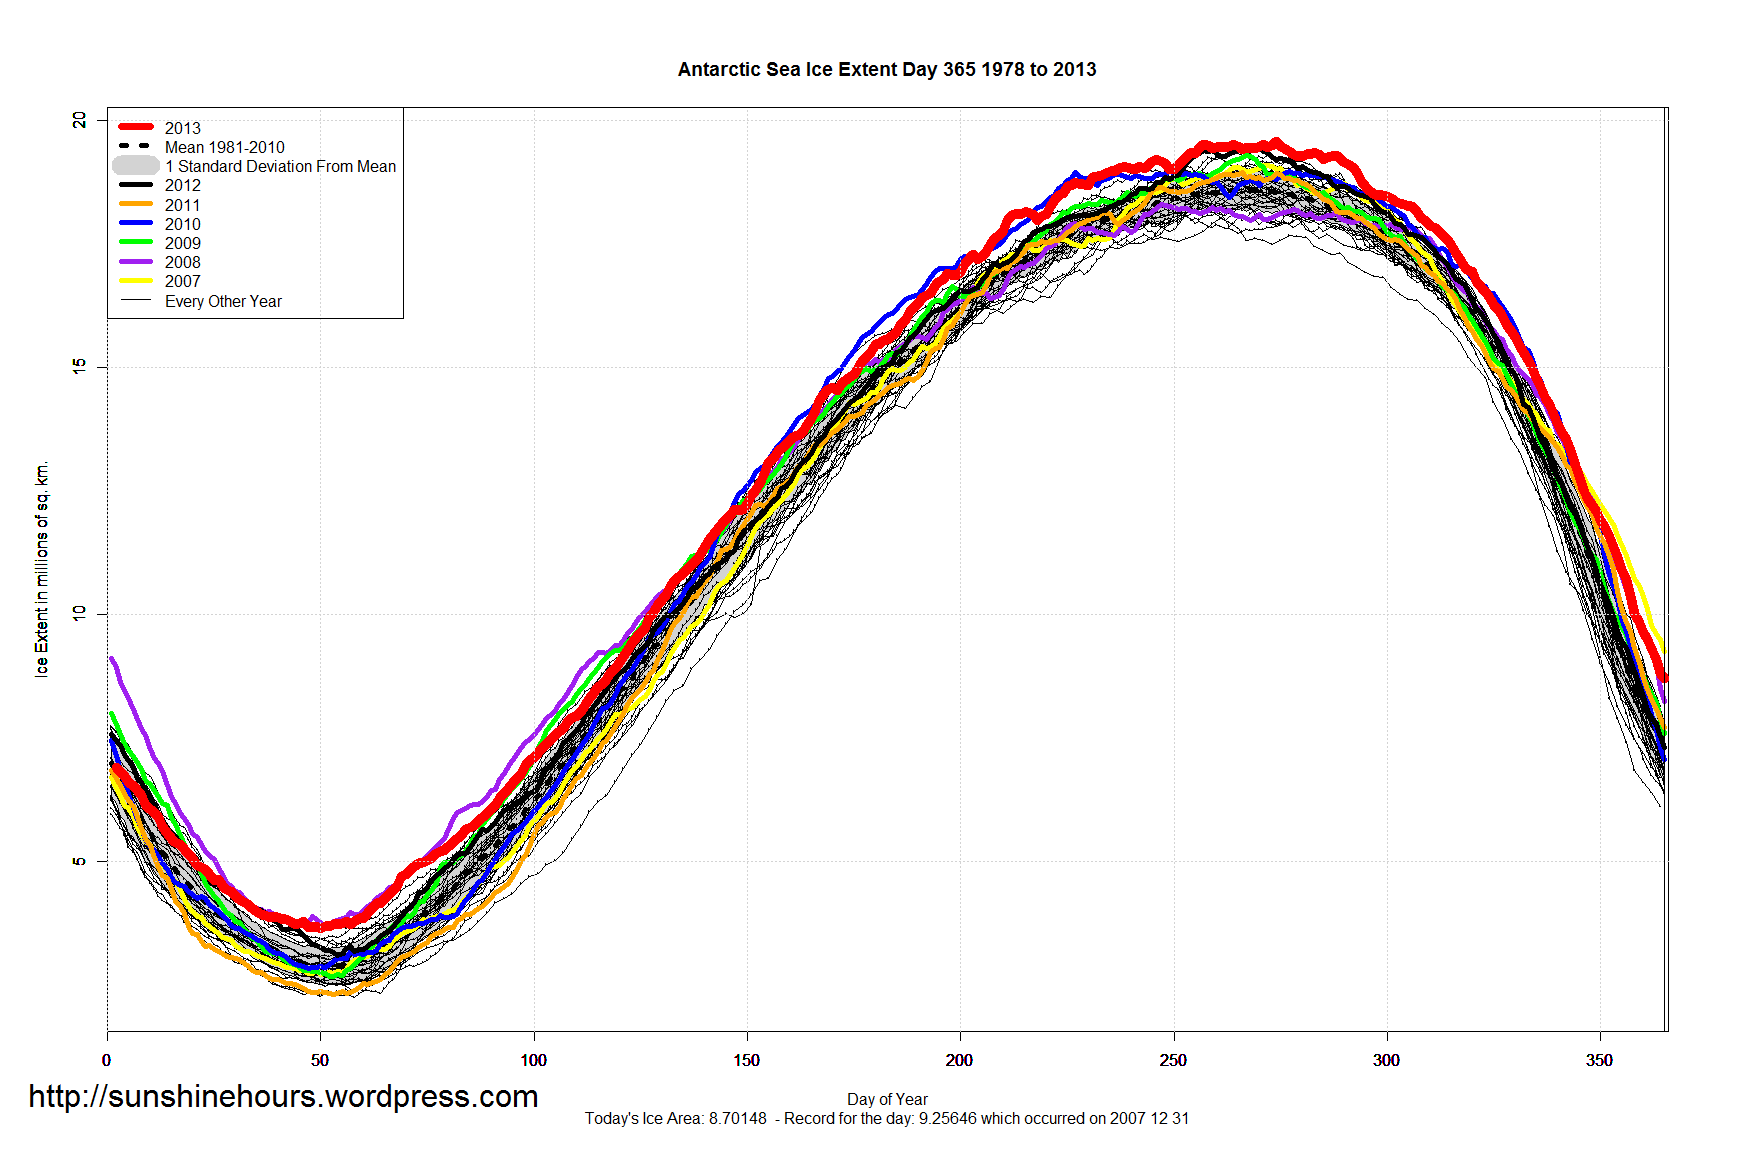
| 2013 | 3.6504 | 19.57088 | 274 | 50 | 0.85 |
End of Year Graph

We need to get away from “sea ice extent” and move to the “integral of sea ice extent”: thickness. I would propose a new measure of actual climate effects: average sea ice thickness x average sea ice area. This new measure {for both the Arctic and Antarctic} would give a more accurate measure of “true coldness and true heat”.
I am fearful of the future and the effects of a “quiet Sun”. Once the Poles are covered in thick ice, the “cold of space” will no longer be suppressed by the heat from the Equator causing crop failure and other climate extremes in warmer areas.
A realistic measure is the first step to understanding.
Dr. Lurtz
There is a new satellite measuring volume (cryosat). But using that new data involves giving up on historical data,
Extent is a valid measurement. Adding more data will be useful.
Besides when the AMO goes negative, extent should grow in the north and shrink in the south.