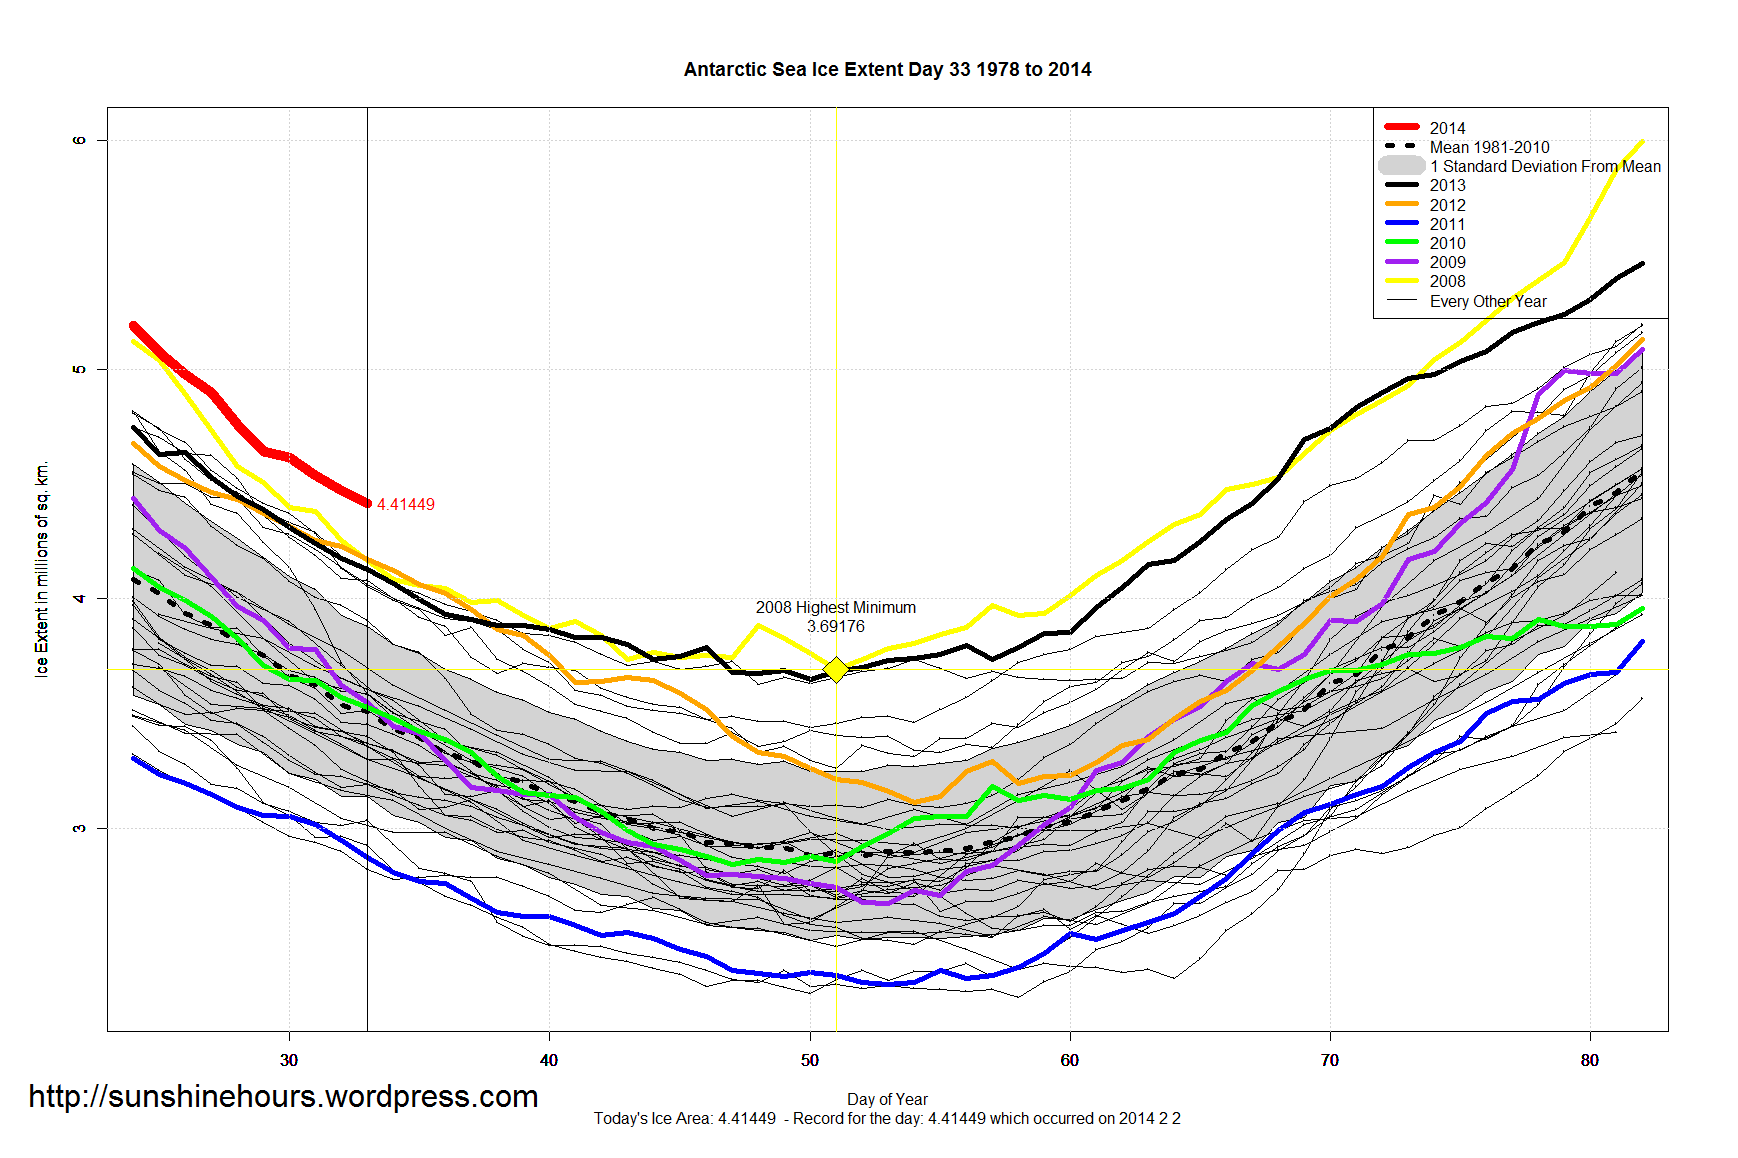
The 16th daily record for Antarctic Sea Ice Extent in 2014 was set yesterday on Feb 2 (Day 33). For the first time this year the old record was from 2012, not 2008. 2012 did not have a high minimum, but did go on to set a new all time record at maximum (which was broken in 2013).
The old record was broken by 240,000 sq km. Sea Ice is 904,000 sq km above the 1981-2010 mean. Thats 25.76% above the 1981-2010 mean.
I’ve added the 2008 Highest Minimum point to this graph. Data is here. Click for bigger.

What is the difference between sea ice extent and sea ice area? At the bottom of the graph it says “Today’s Ice Area: 4.1449….”, while the graph title is Antarctic Sea Ice Extent…
Thanks for catching that mistake. I normally use Extent data. Every once in a while I graph area. I will fix that label.
“Area and extent are different measures and give scientists slightly different information. Some organizations, including Cryosphere Today, report ice area; NSIDC primarily reports ice extent. Extent is always a larger number than area, and there are pros and cons associated with each method.
A simplified way to think of extent versus area is to imagine a slice of swiss cheese. Extent would be a measure of the edges of the slice of cheese and all of the space inside it. Area would be the measure of where there is cheese only, not including the holes. That is why if you compare extent and area in the same time period, extent is always bigger.”
More here: http://nsidc.org/arcticseaicenews/faq/#area_extent
Thanks, your analogy is easy to understand.