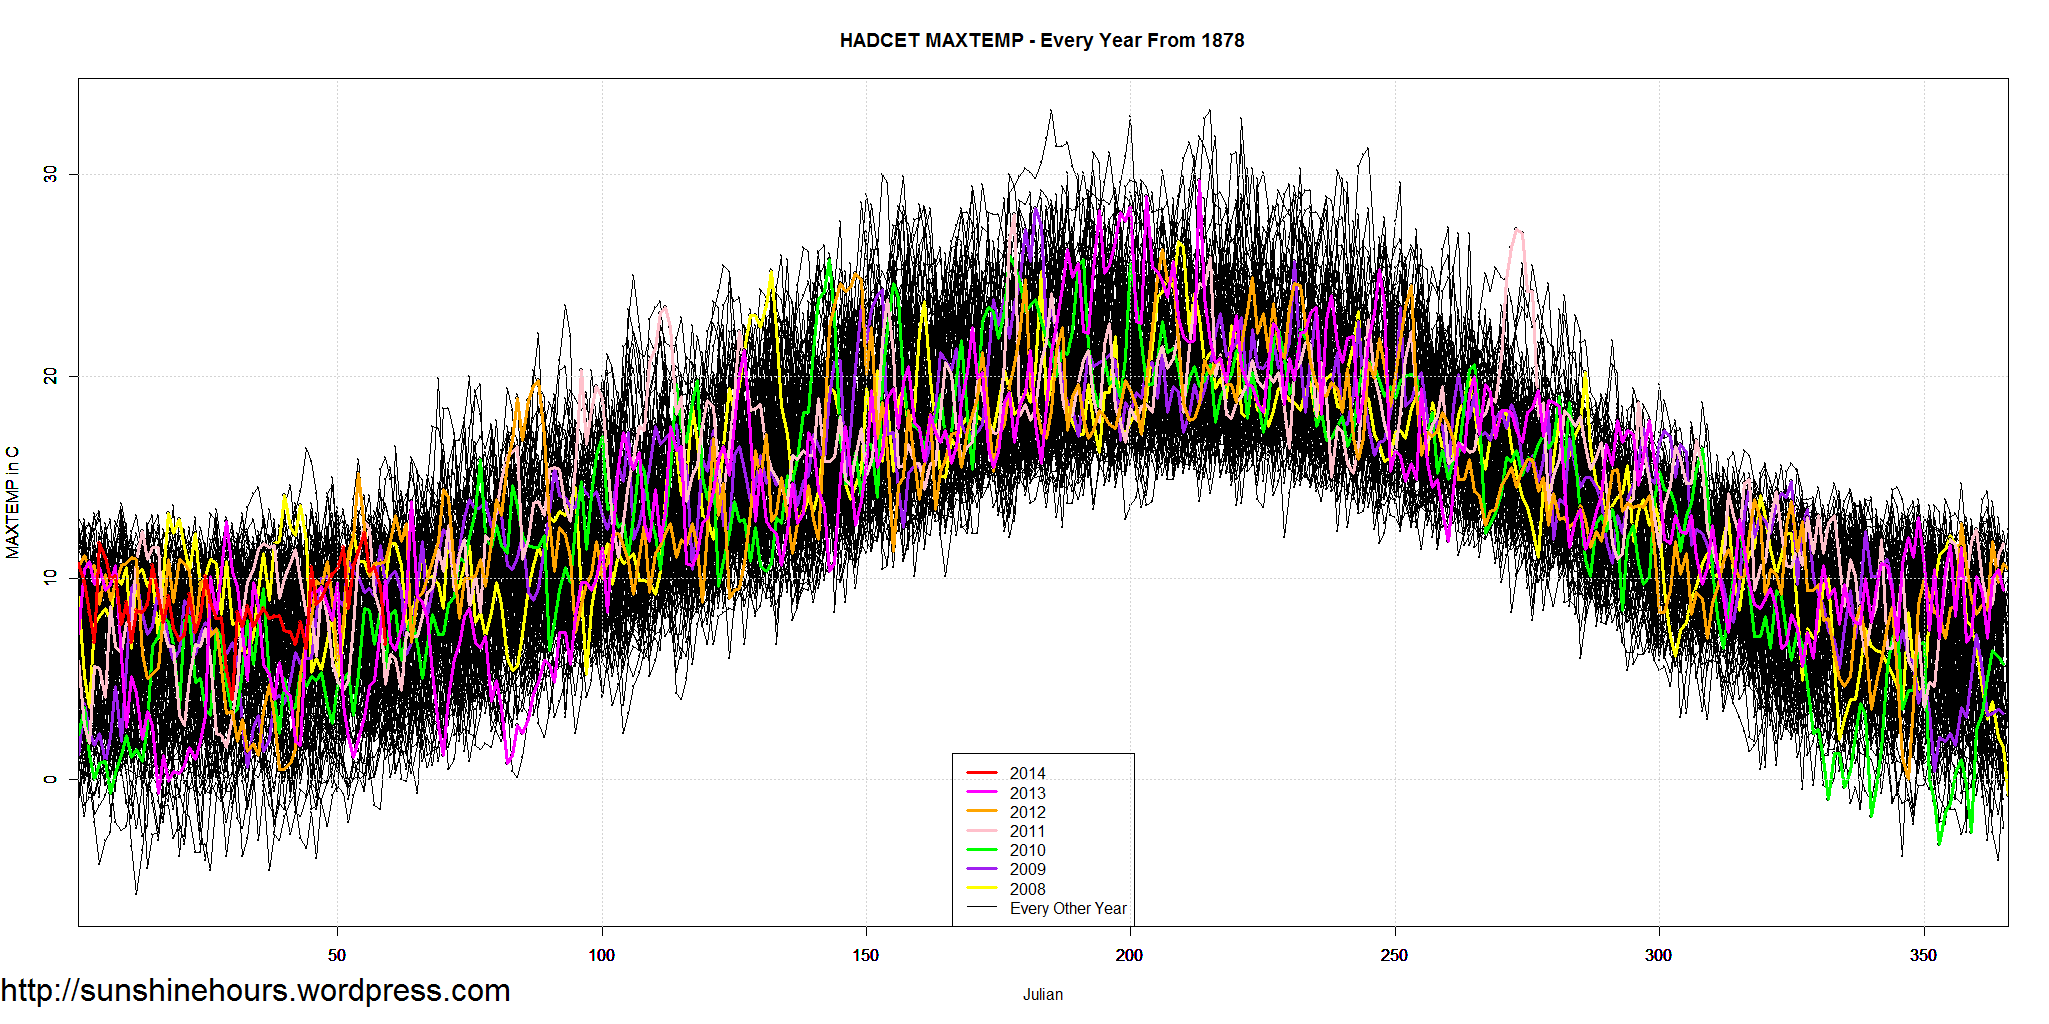
HADCET Daily Maximum data is available from 1878 on.
Here is every day from 1878 on visualized using the same style I use for Sea Ice Extent. The most recent years get a color.
It doesn’t look like the end of the world is happening … does it? Click graph for bigger.

Nothing here to see…move along!
Currently a climate refugee for the past 2 weeks here in Phoenix, back home tomorrow to -10C and snow…yuk….
9 and wet on the west coast. Phoenix sounds good.
Ya, brother/sis-in-law were here for the 2 weeks, returned to Comox today, to clouds/rain showers, he was not a happy camper returning!