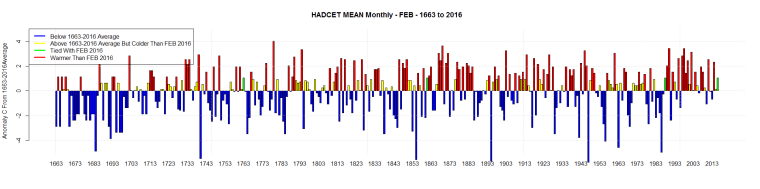
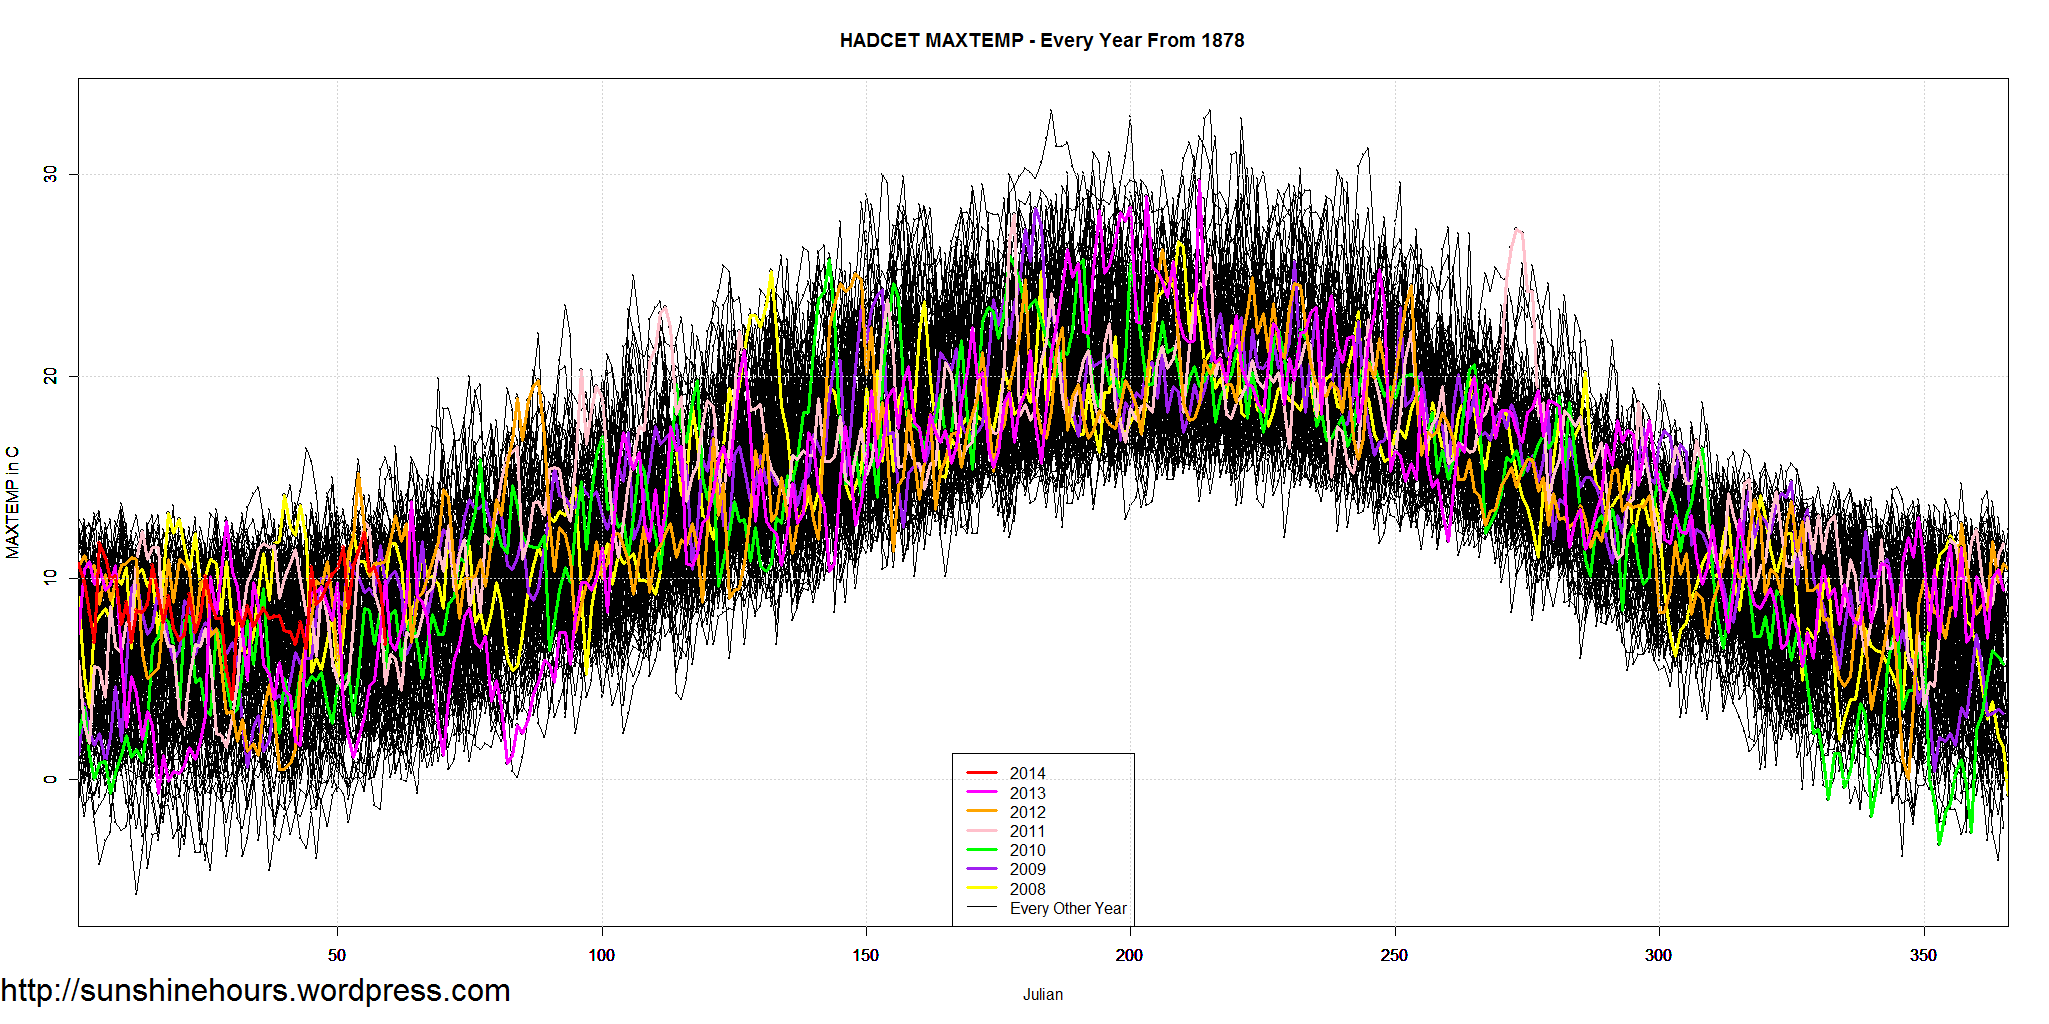
You remember HADCET (Central England Temperature)? Longest temperature record in existence!.
HADCET Feb 2019 was tied for 15th warmest out of 357.
1779,1869,1990,1998,1794,1903,1945,2002,1867,1872,1961,1739,1914,1926 were warmer
And 2019 was tied with 1702,1750 and 1997.
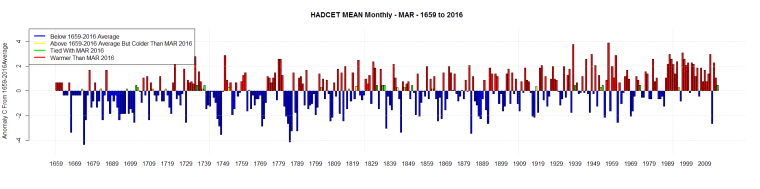
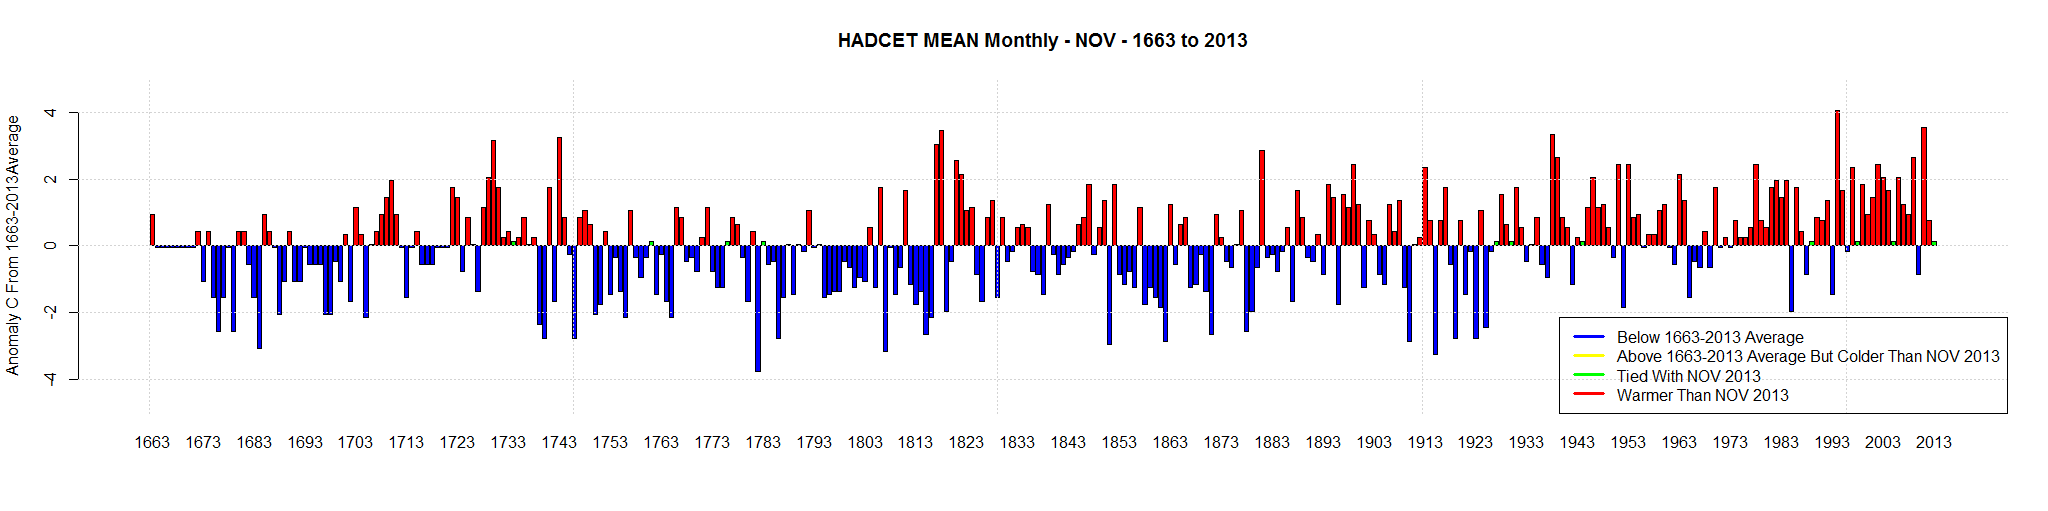
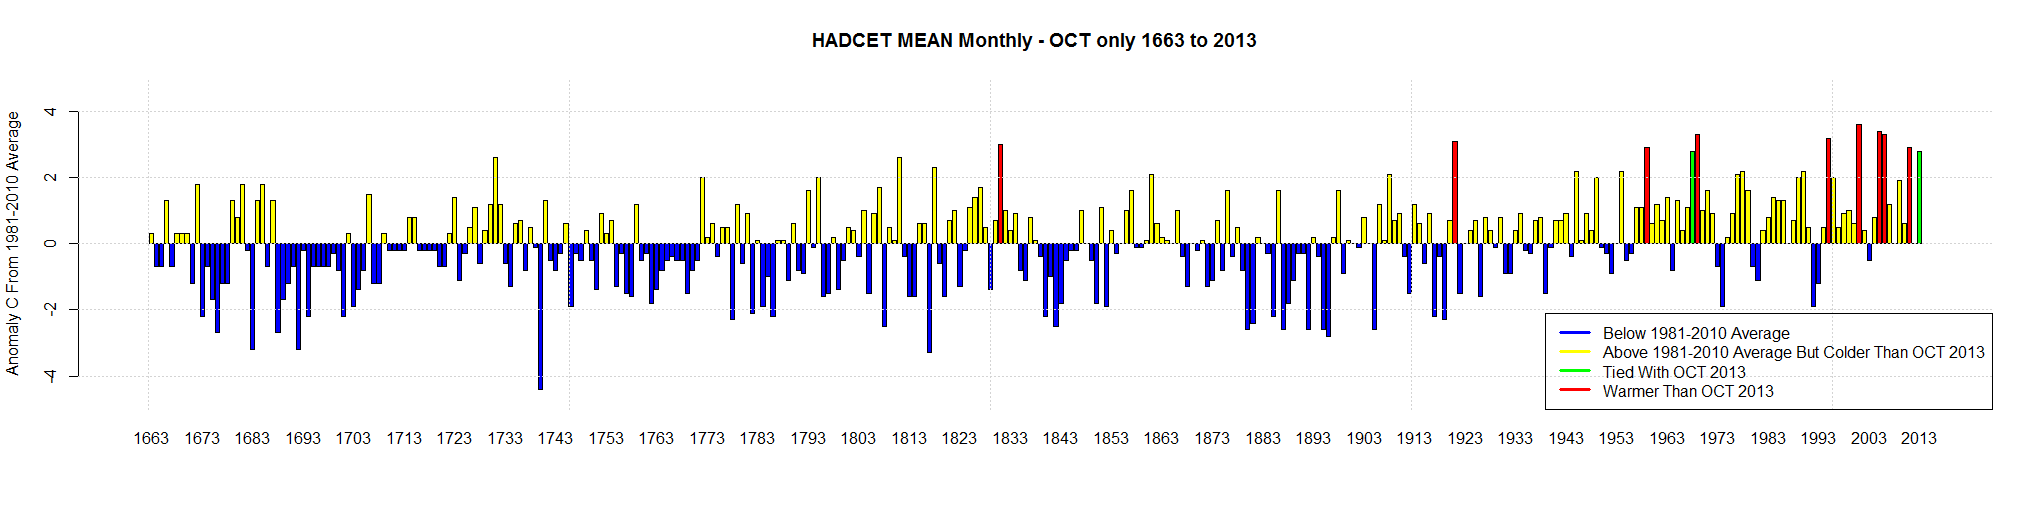
The barplot is the February’s since 1659. The temperature is the anomaly from the 1659 to 2019 average.
The yellow bars are the years warmer than February 2019. Green bars indicate a tie with February 2019. 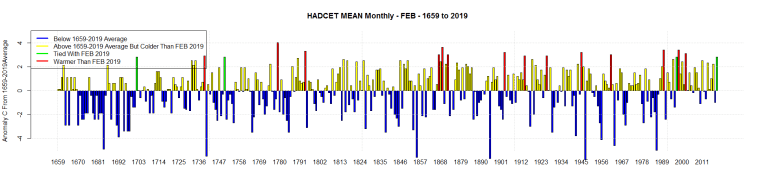
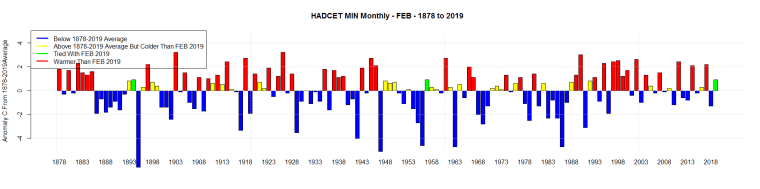
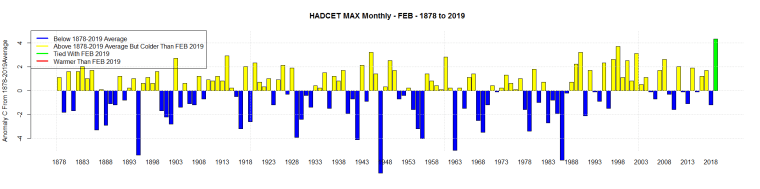
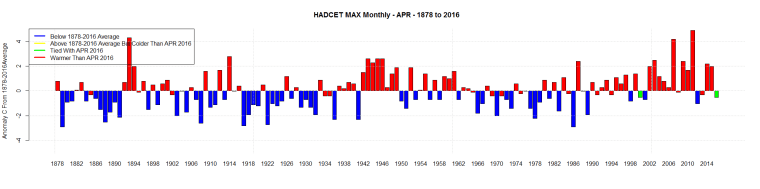
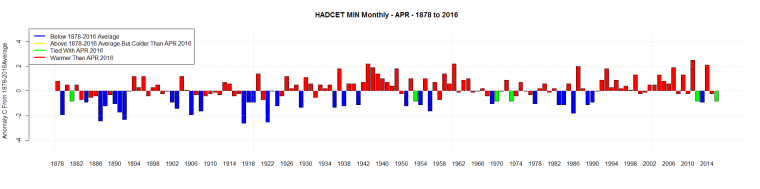
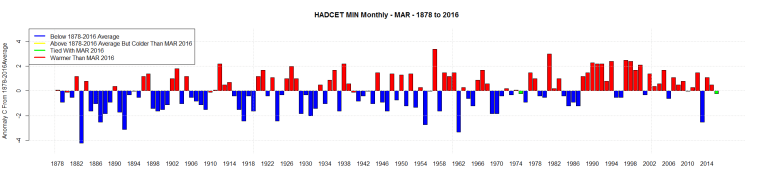
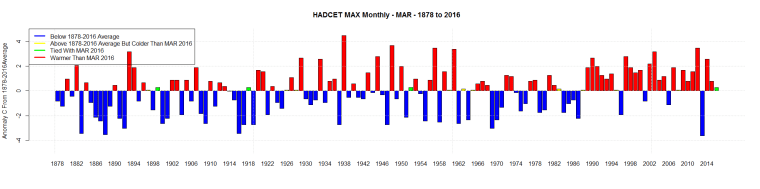
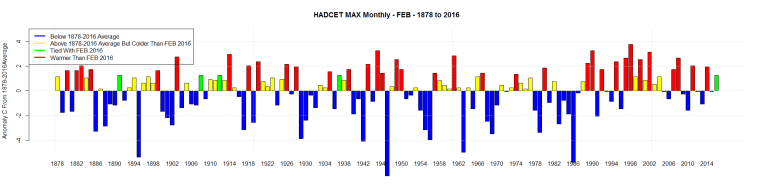
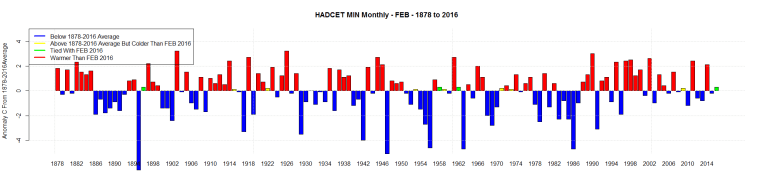
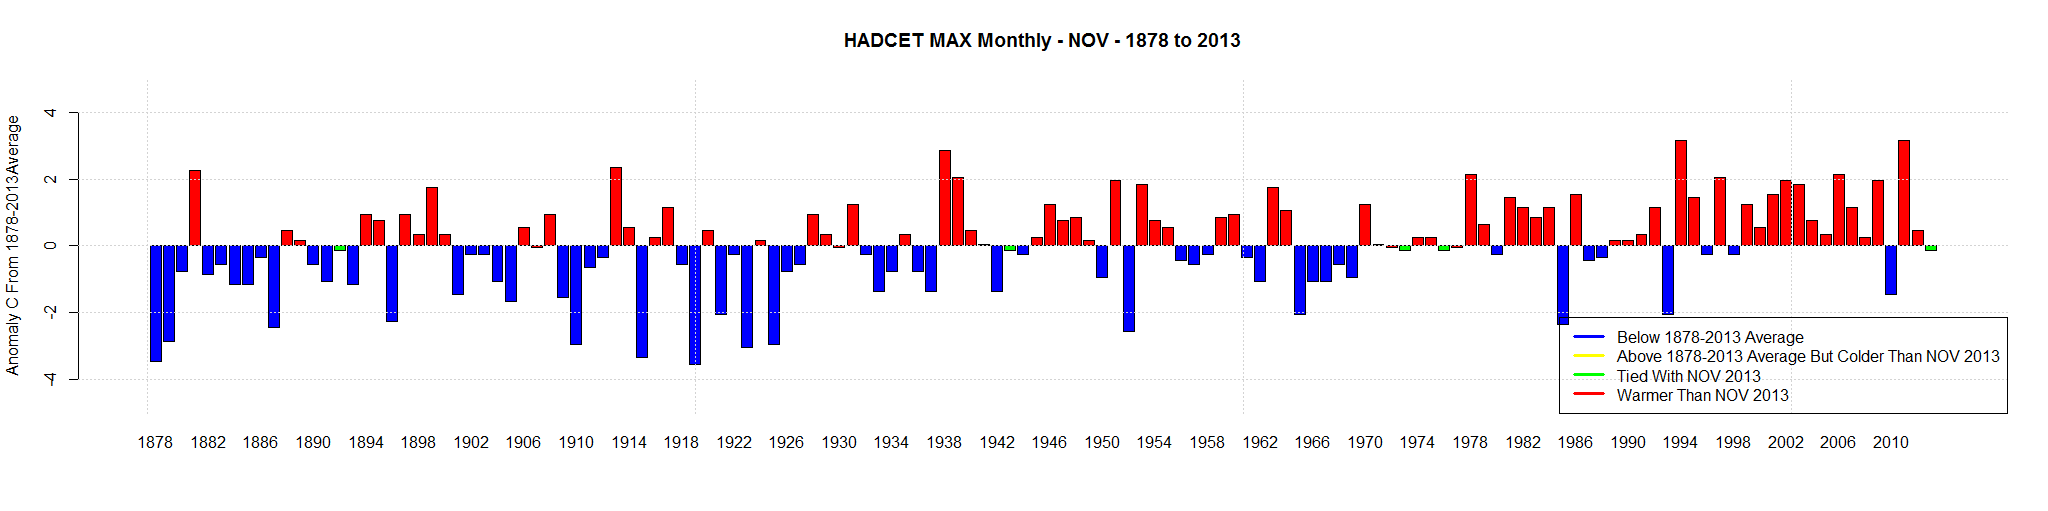
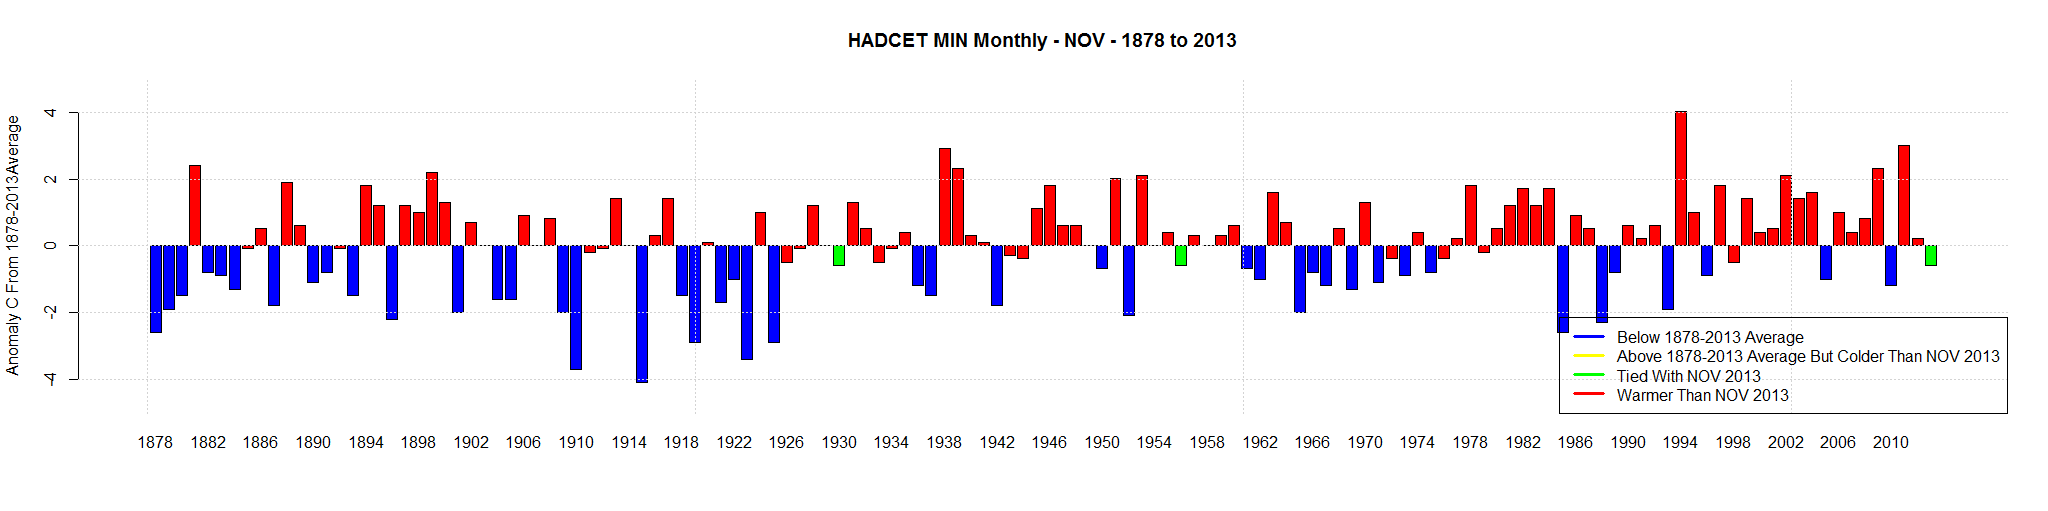
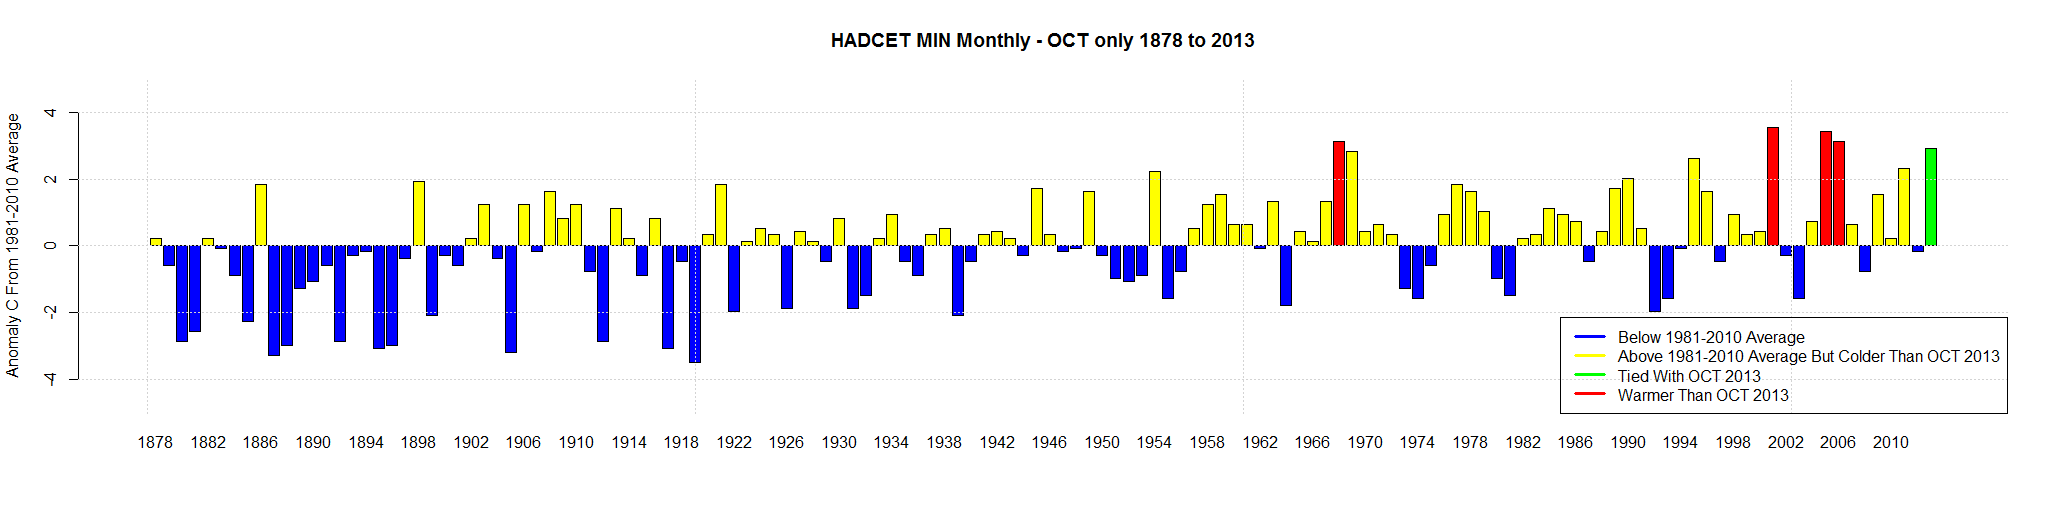
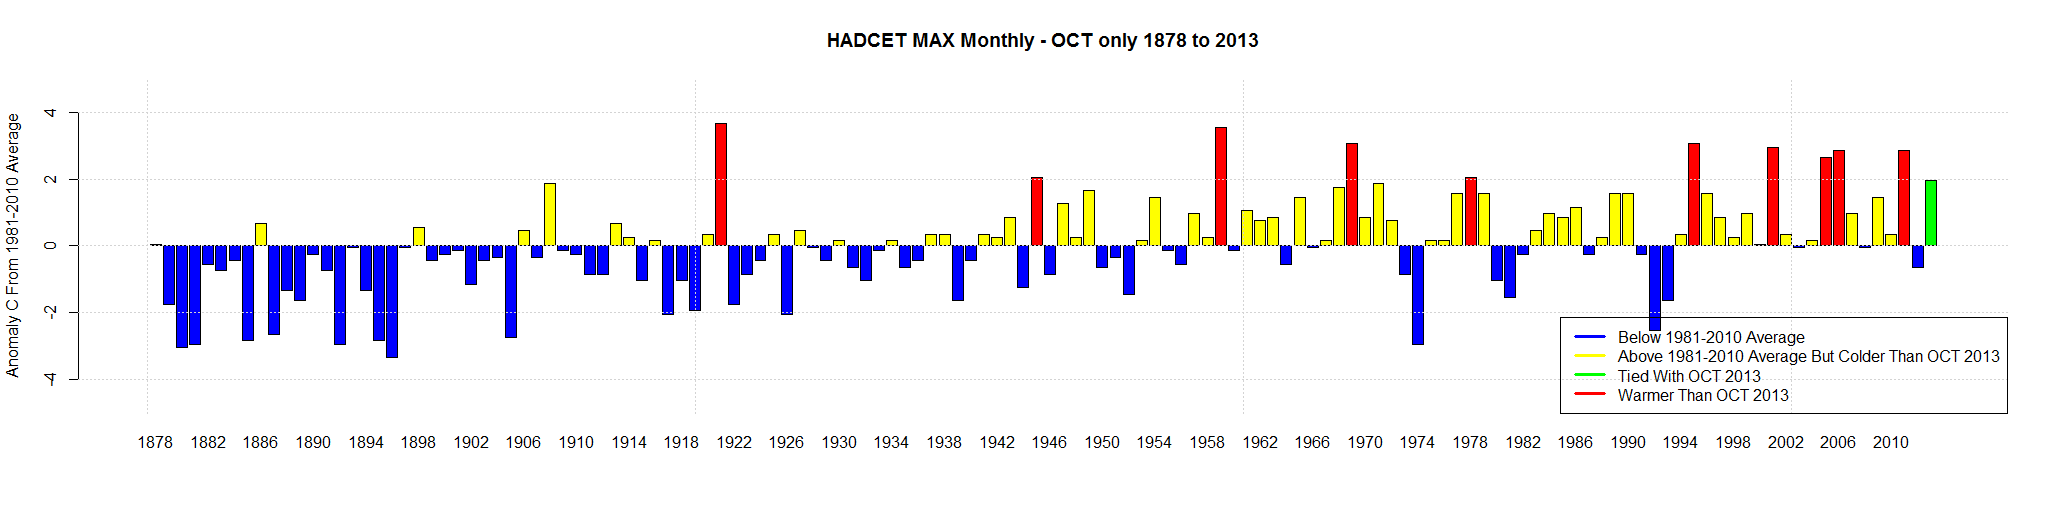
HADCET only goes back to 1878 for MIN and MAX. Here are those graphs.
Feb 2019 MAX was highest ever. MIN was tied for 47th.
