June 12 2014 MASIE Update – Central Arctic and Greenland Sea last two regions with more ice now than 74 days ago
Also, a slight slowdown only in the last 1 day. Ice on dropped -17,601.
| Region | Start | End | Last 74 | Last 28 | Last 14 | Last 7 | Last 3 | Last 1 |
| Baffin Bay Gulf of St. Lawrence | 1,688,530 | 904,040 | -784,490 | -253,963 | -208,362 | -120,139 | -32,622 | -5,302 |
| Barents Sea | 645,917 | 271,439 | -374,478 | -272,700 | -168,751 | -76,979 | -38,919 | 6,909 |
| Laptev Sea | 897,845 | 685,213 | -212,631 | -208,129 | -141,366 | -54,414 | -19,202 | -817 |
| Sea of Okhotsk | 853,240 | 22,042 | -831,197 | -80,052 | -49,182 | -47,337 | -4,905 | 1,504 |
| Kara Sea | 933,859 | 840,937 | -92,922 | -87,640 | -37,900 | -25,513 | -29,354 | -9,835 |
| Bering Sea | 697,324 | 77,030 | -620,294 | -146,473 | -31,857 | -24,151 | -22,319 | -4,679 |
| Hudson Bay | 1,260,903 | 1,170,147 | -90,757 | -43,330 | -59,925 | -18,886 | -20,428 | -231 |
| East Siberian Sea | 1,087,137 | 1,012,535 | -74,602 | -74,602 | -14,726 | -18,192 | -18,724 | -1,446 |
| Beaufort Sea | 1,070,445 | 1,035,169 | -35,276 | -13,379 | -30,935 | -13,864 | -2,725 | -1,235 |
| Chukchi Sea | 966,006 | 864,628 | -101,379 | -63,686 | -63,816 | -12,345 | 1,774 | -2,176 |
| Canadian Archipelago | 853,214 | 786,656 | -66,558 | -47,527 | -27,820 | -11,191 | -14,571 | -1,060 |
| Baltic Sea | 15,337 | 0 | -15,337 | -2,673 | 0 | 0 | 0 | 0 |
| Yellow Sea | 0 | 0 | 0 | 0 | 0 | 0 | 0 | 0 |
| Central Arctic | 3,221,921 | 3,241,698 | 19,777 | -6,044 | 7 | 2,003 | 6 | -400 |
| Greenland Sea | 603,416 | 626,511 | 23,096 | -3,170 | -27,694 | 24,406 | -3,669 | 781 |
| Northern Hemisphere (Total) | 14,805,115 | 11,539,574 | -3,265,541 | -1,303,336 | -862,280 | -396,216 | -205,273 | -17,601 |
| NH (Average Loss per Day) | -43,541 | -46,548 | -61,591 | -56,602 | -68,424 | -17,601 |
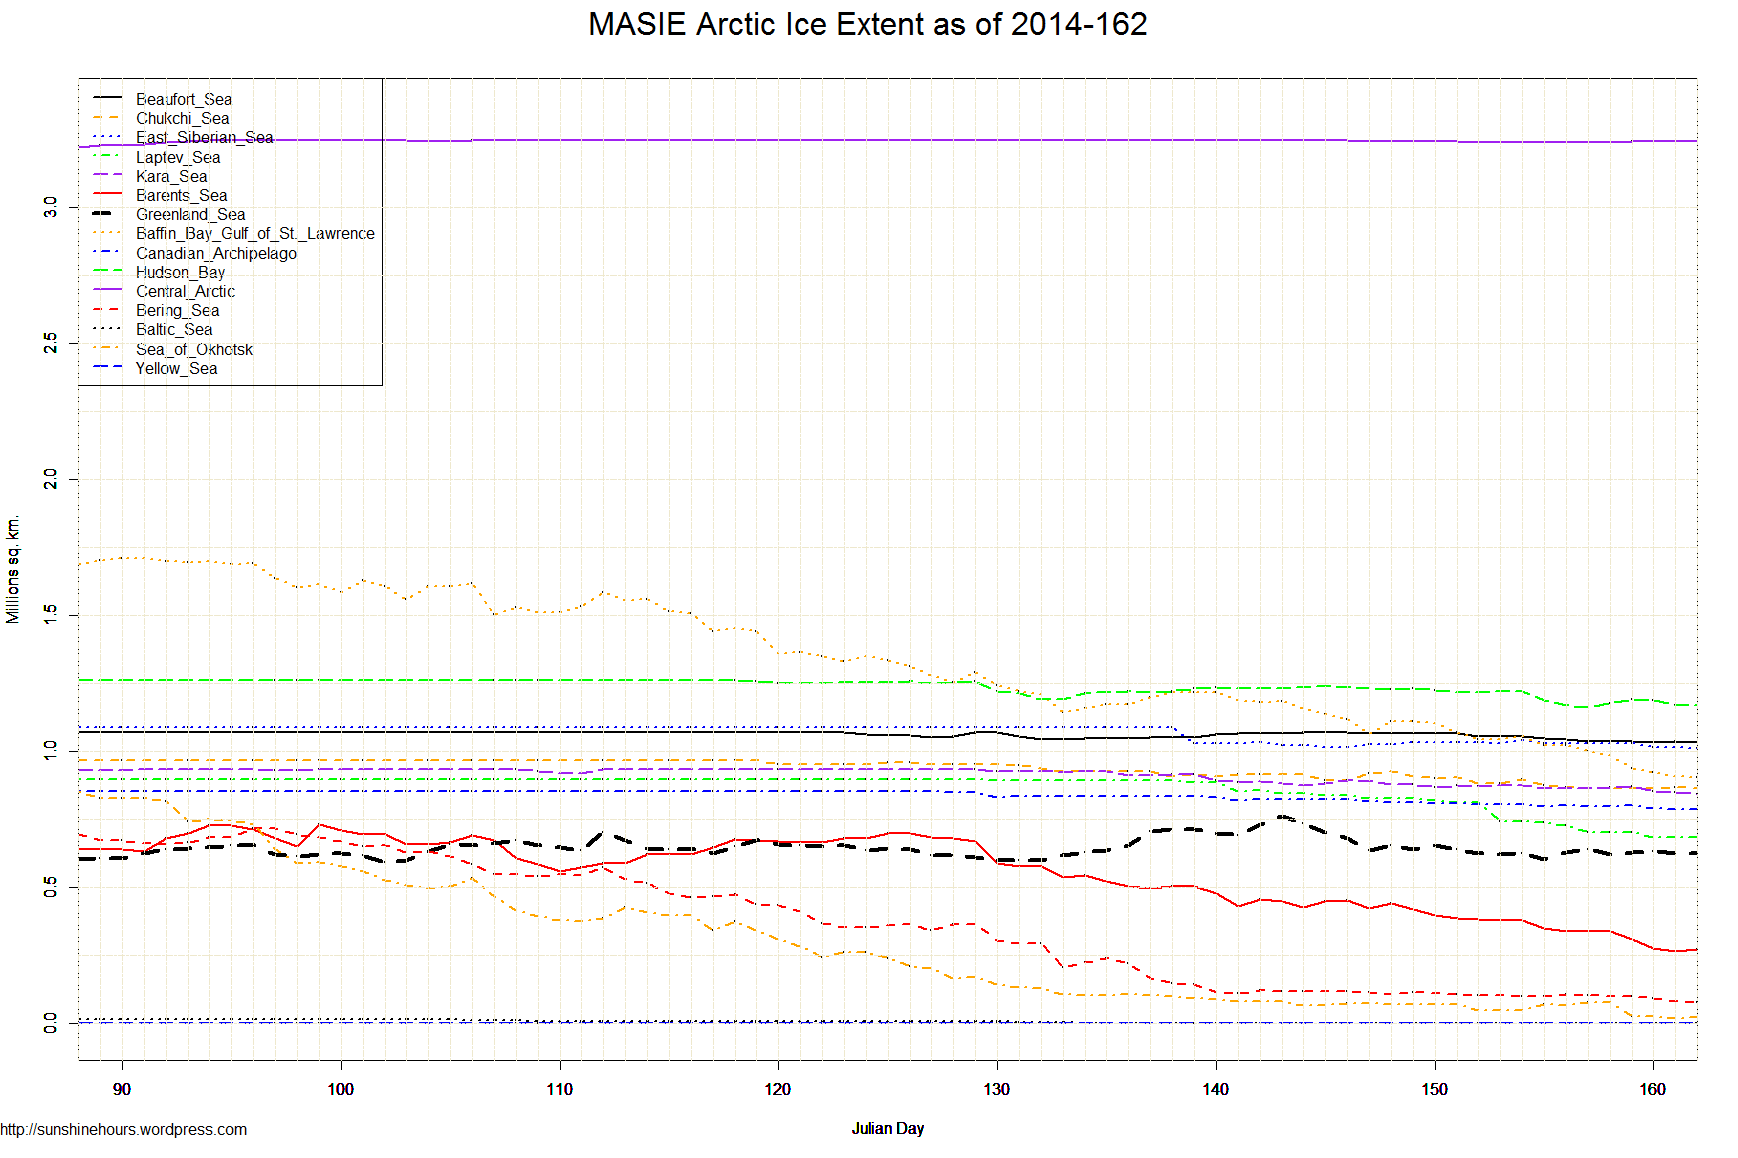

The Greenland Sea numbers are unusual in that the max came quite late, on day 143 it hit 762,009. So the database above includes mostly days of gaining ice, and melting only for the last 18 days. The other regions showed their last max much earlier, seven regions maxed prior to day 74, the others mostly between day 118 and 135. So there’s at least a month of melting everywhere but Greenland.
That is why Central Arctic is impressive, reaching max on day 112, still there on day 130, and has lost only 0.15% in the last 33 days.
Beaufort Sea is also exceptional. It was at max already at day 43, still there on day 130, and has lost only 3.48% in the last 33 days.