USHCN 2.5 – OMG … The Old Data Changes Every Day (Mapped)

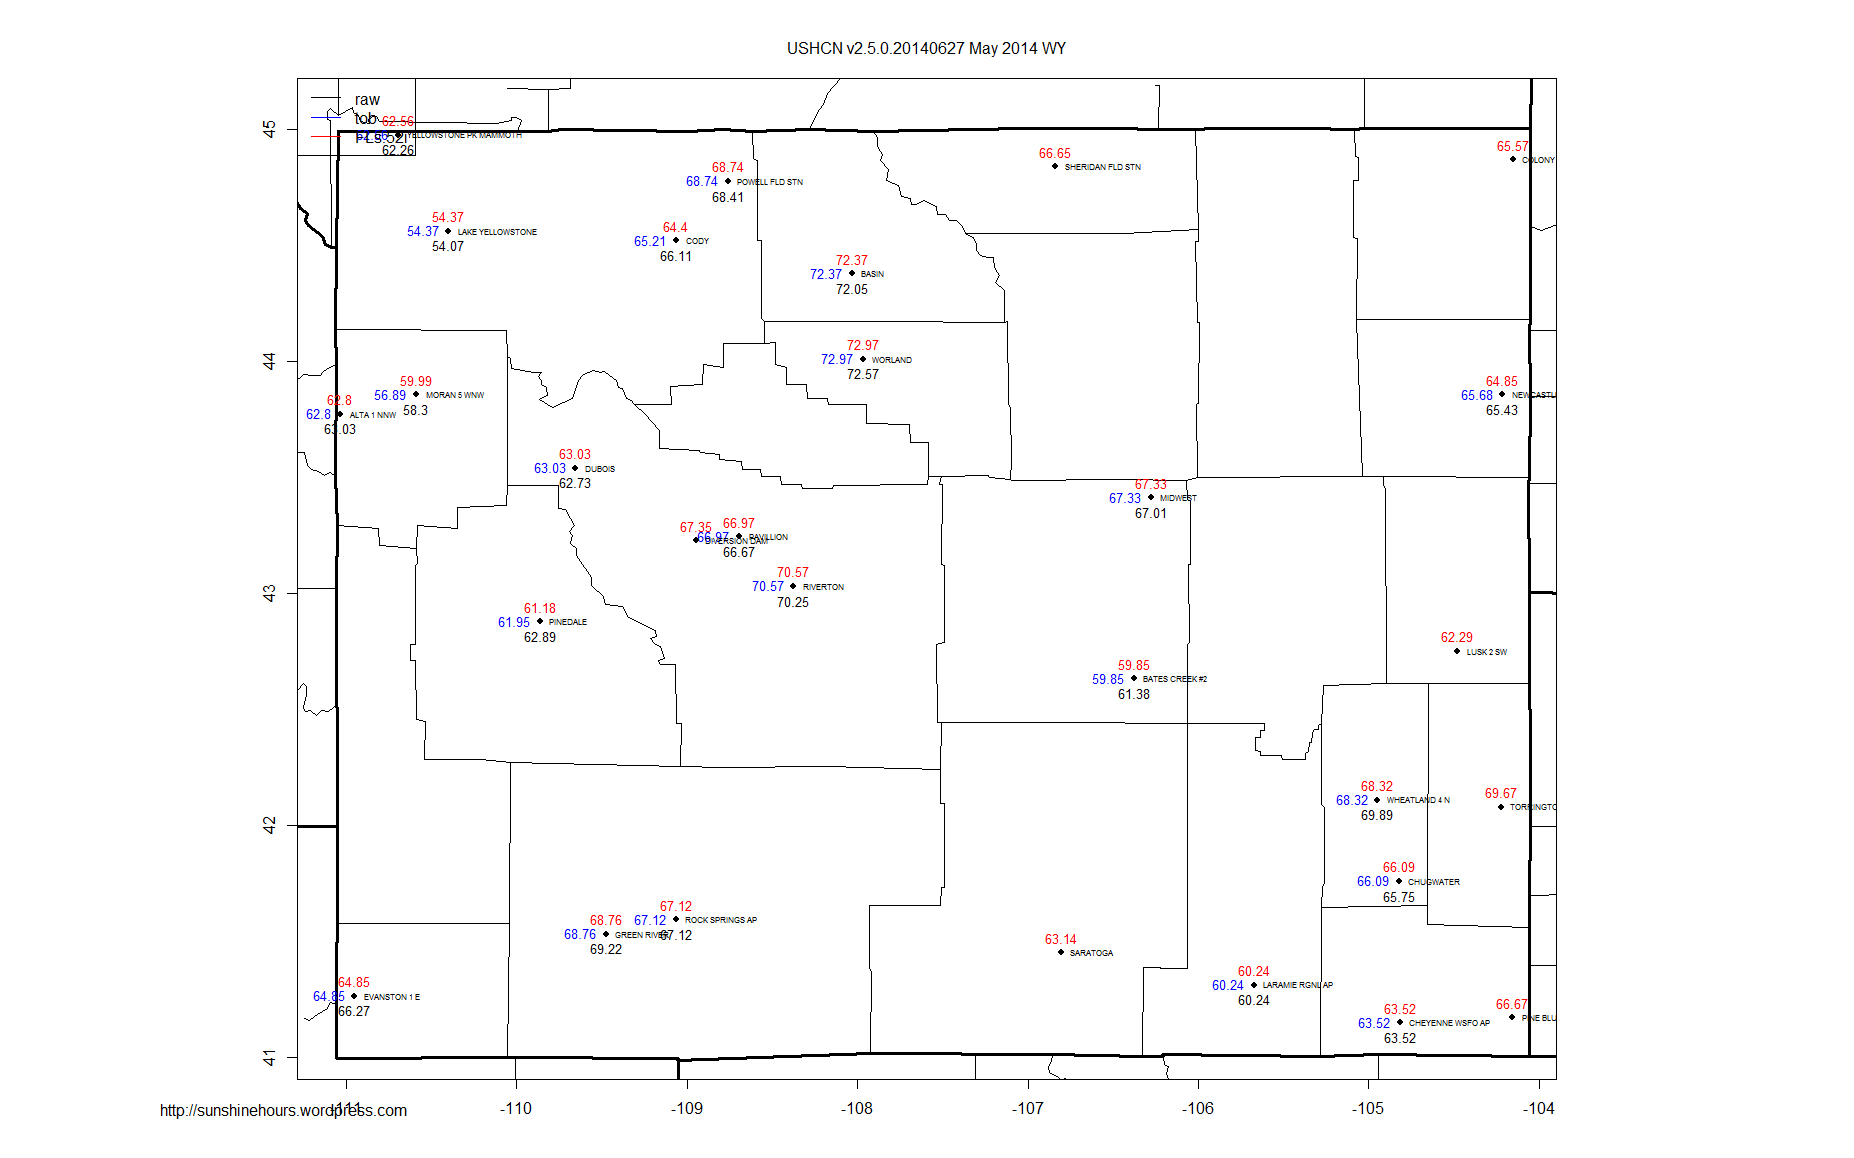
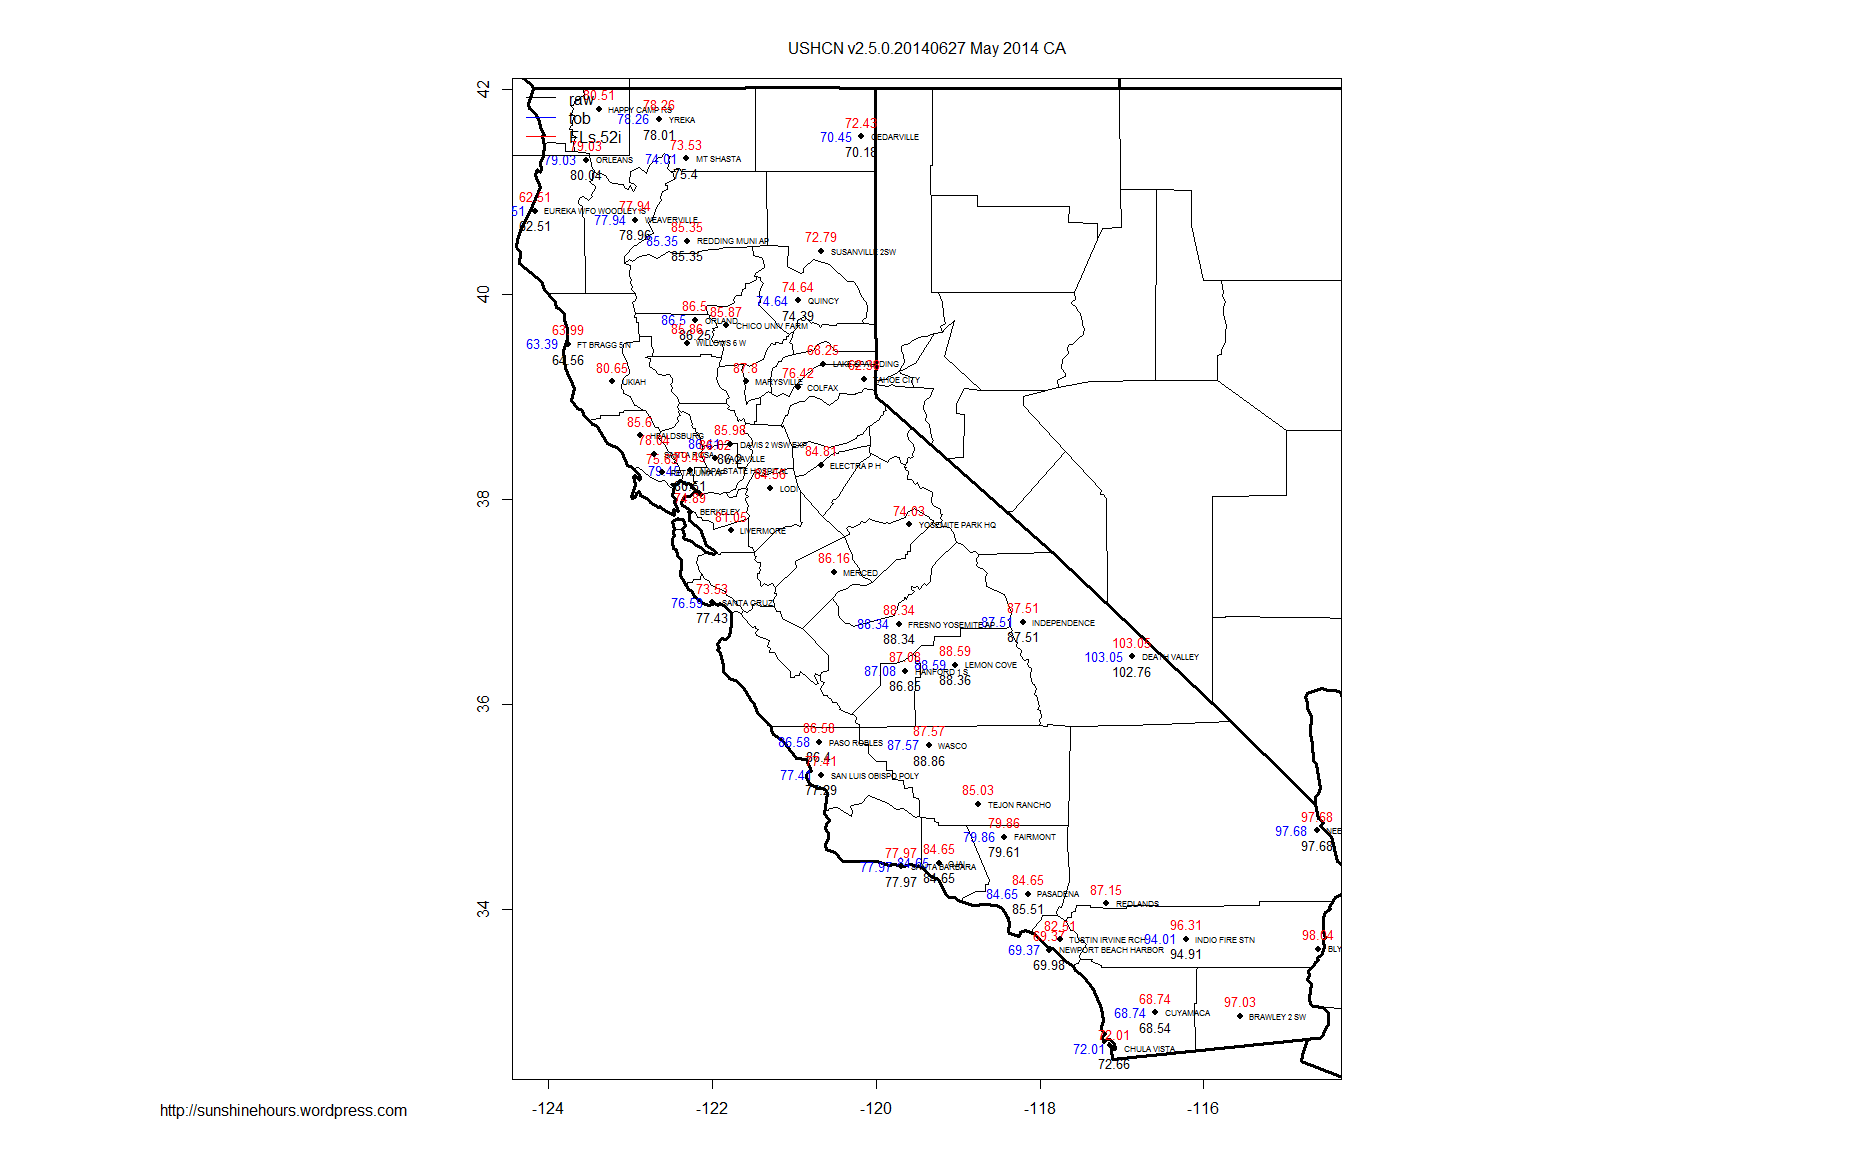
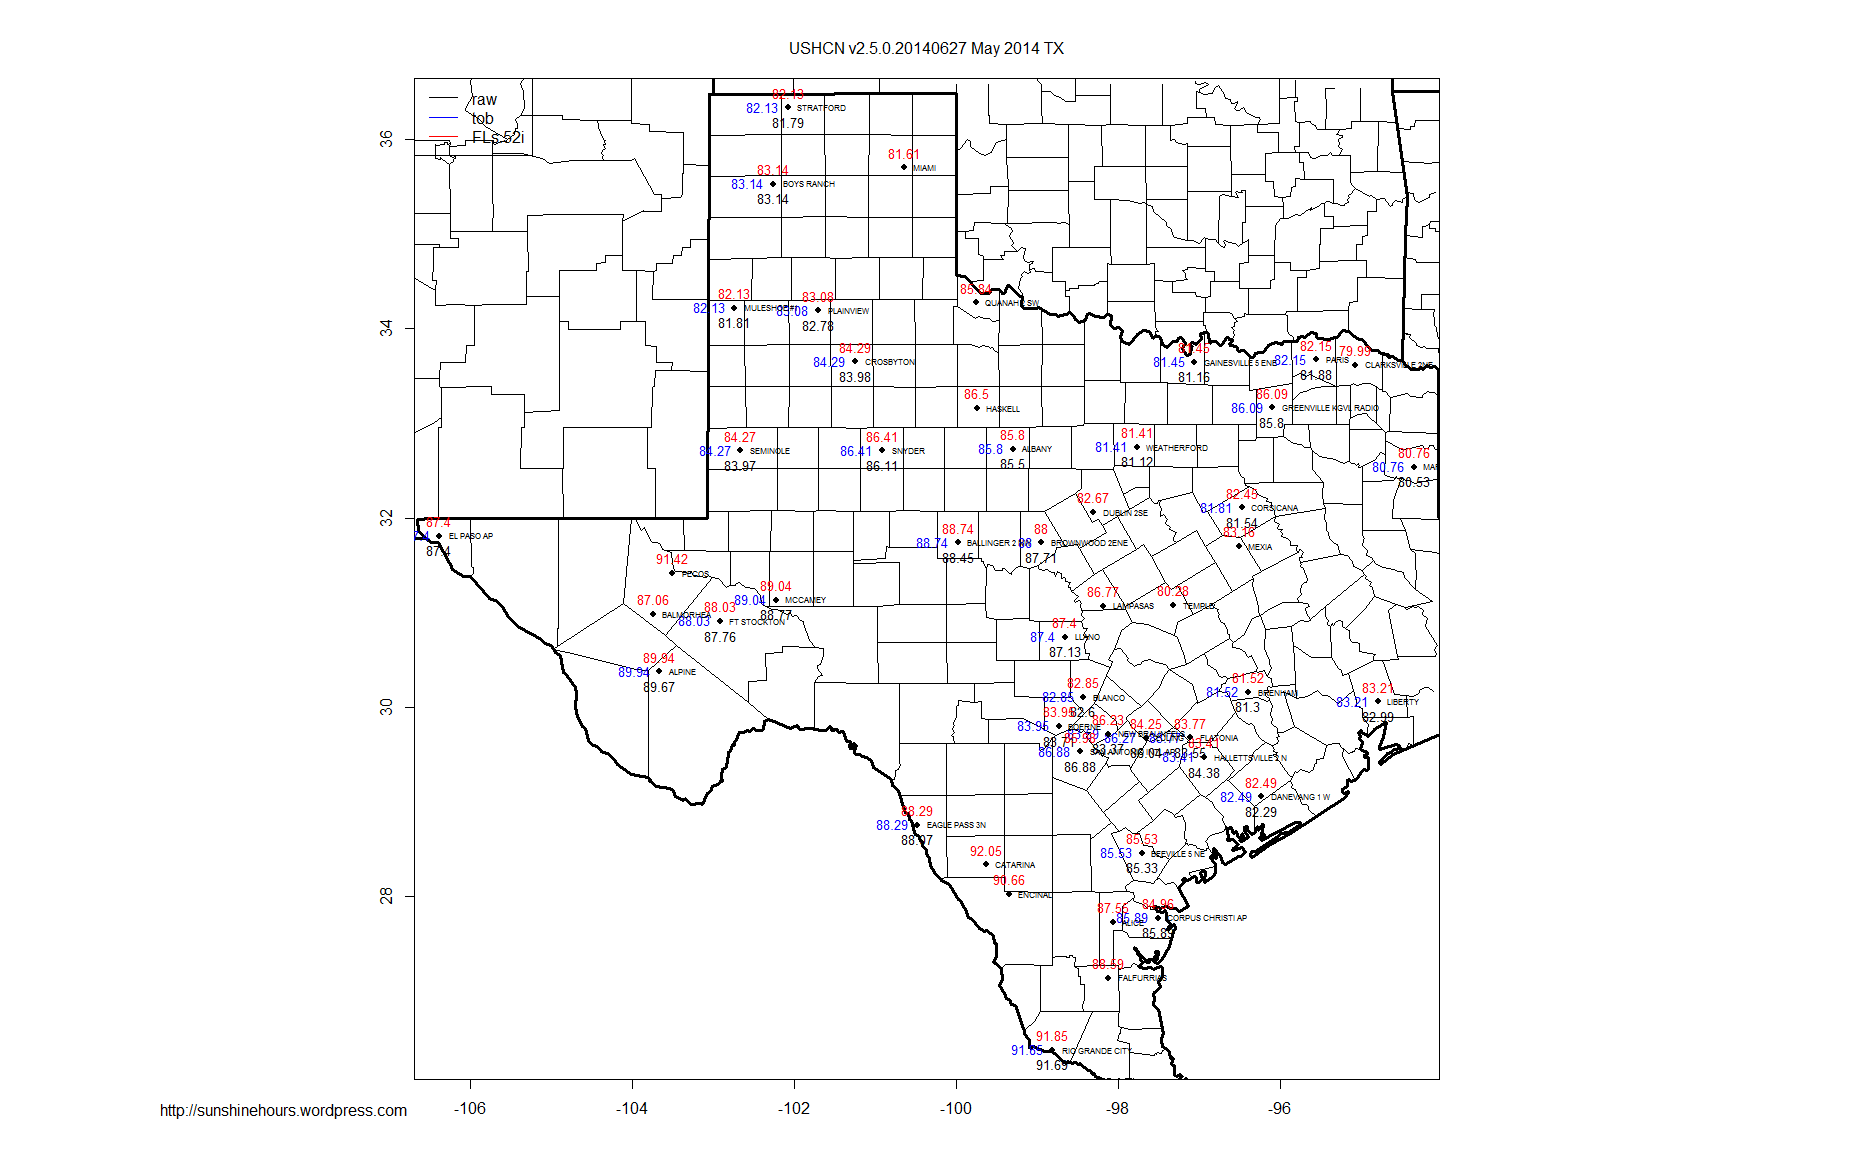
Update: I added a few other states

I’ve been doing posts about USCHN and Estimated data. I wanted to visualize.

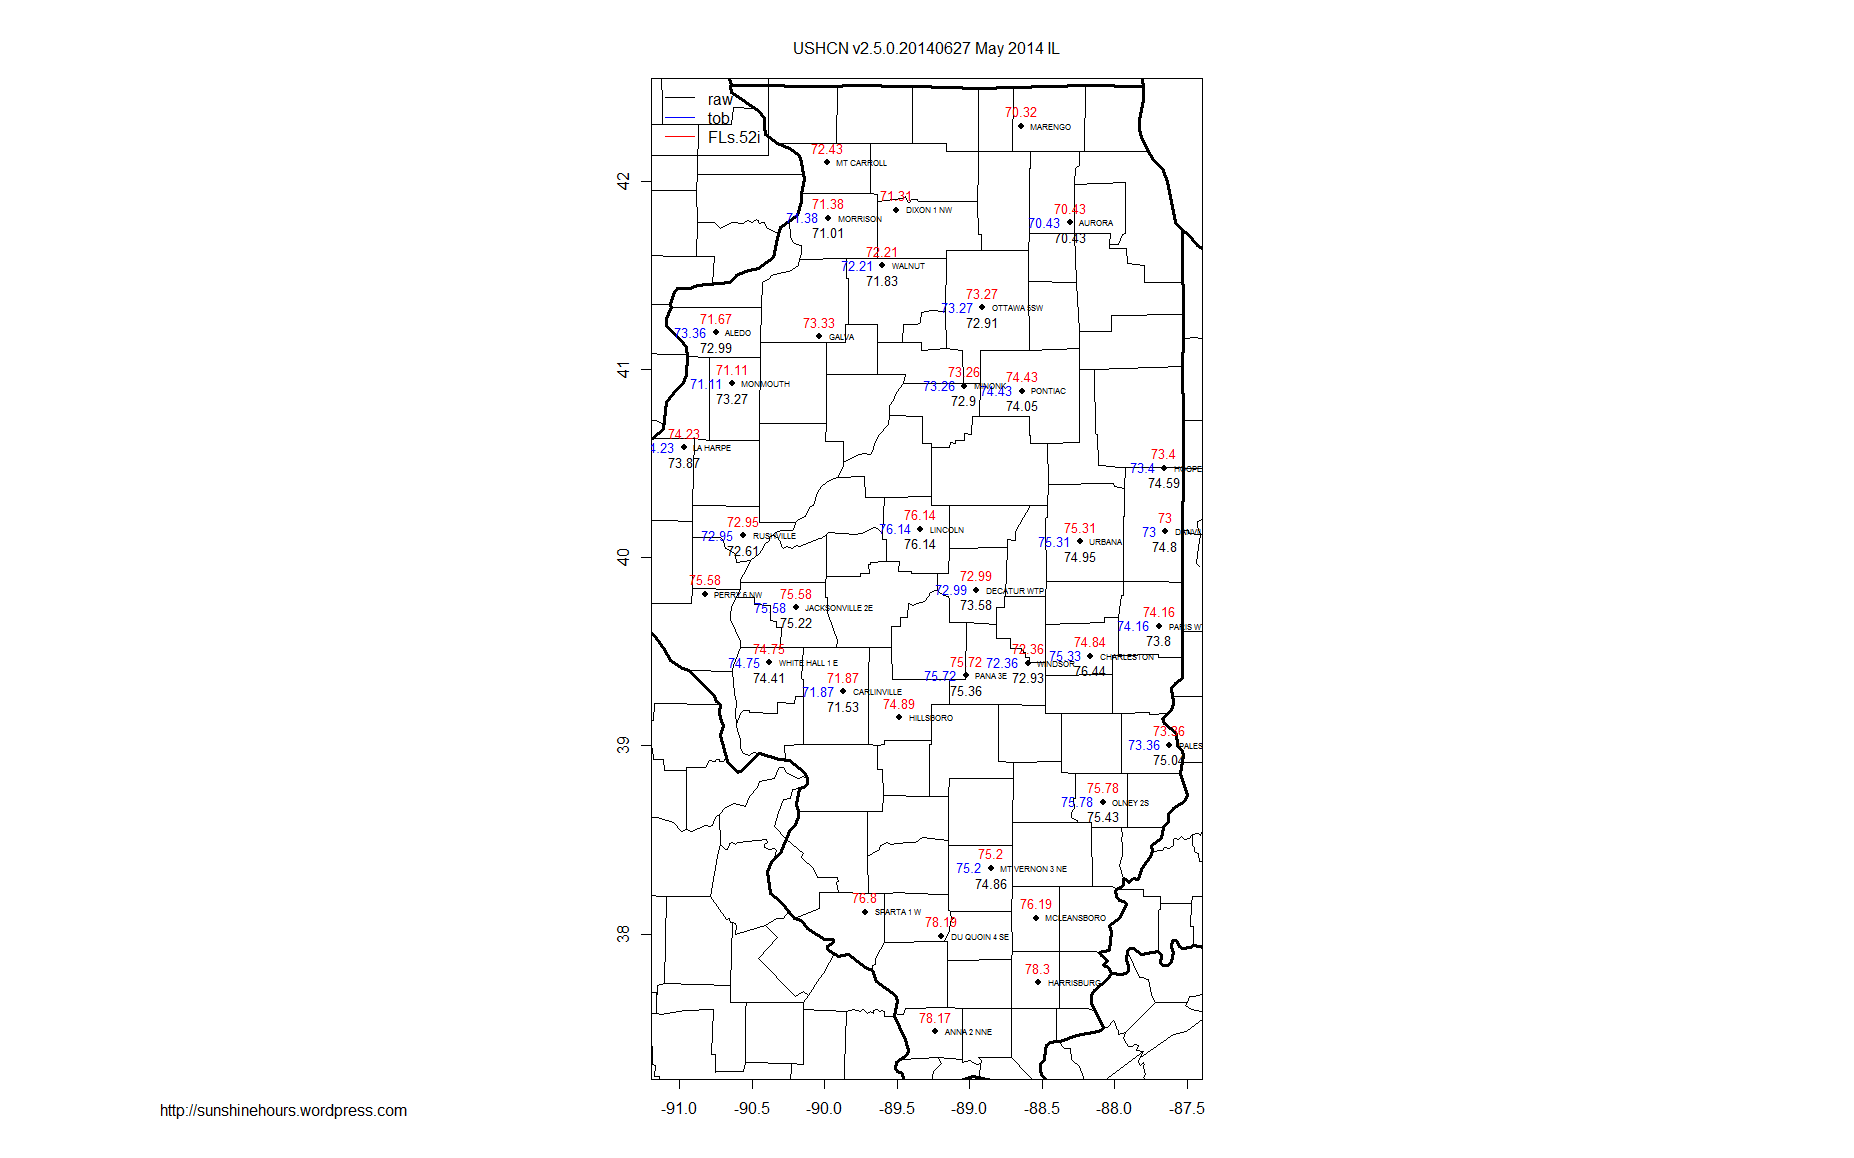
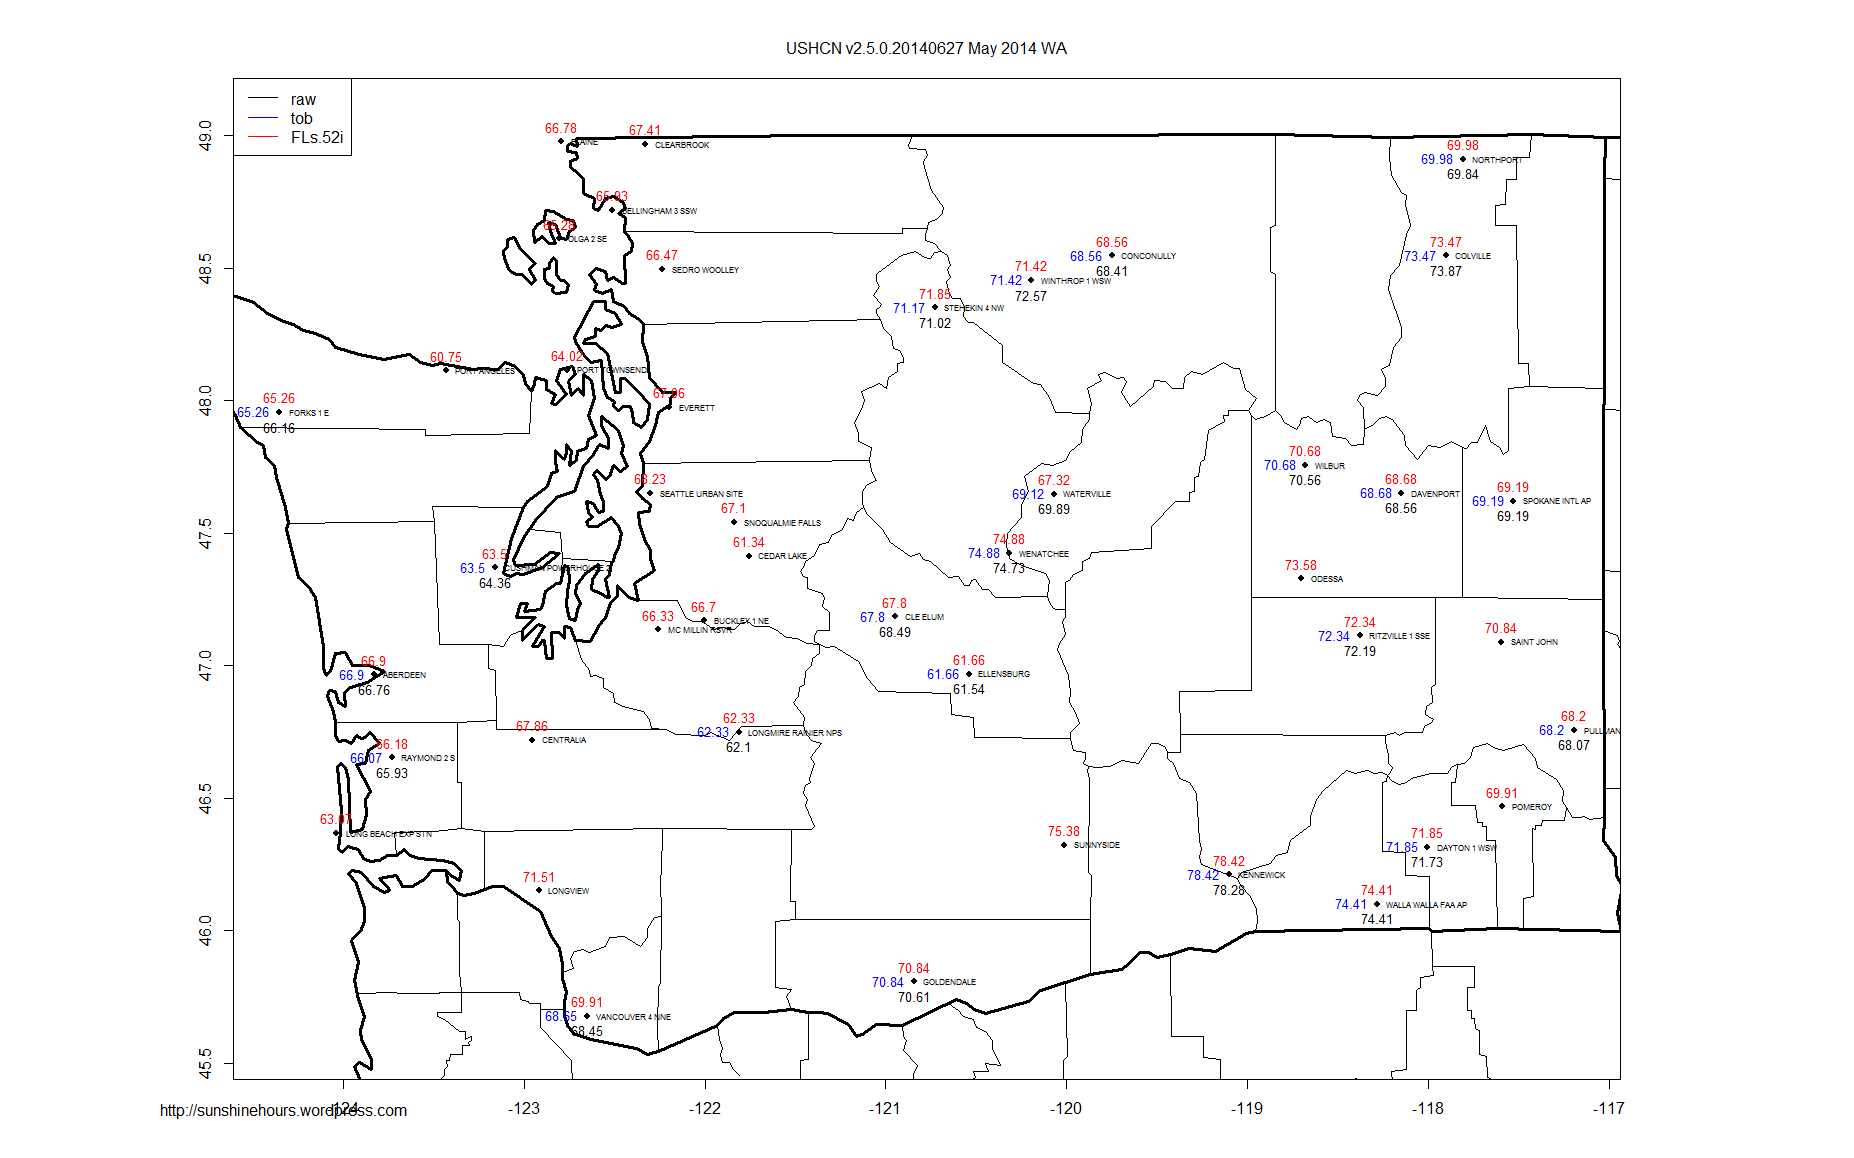
This is the USHCN May 2014 TMAX data for Illinois.

The data is in F (originally in C so there may be very slight conversion issues).

Black temperatures are raw, blue are TOBS and red are Final adjusted. Stations with just a red have no raw data. The data is just ‘E’stimated.

Click for full size.

USHCN v2.5.0.20140627 May 2014 IL


A few other states:

USHCN v2.5.0.20140627 May 2014 WY USHCN v2.5.0.20140627 May 2014 CA USHCN v2.5.0.20140627 May 2014 TX USHCN v2.5.0.20140627 May 2014 WA

2 thoughts on “USHCN 2.5 – OMG … The Old Data Changes Every Day (Mapped)

Leave a Reply

Fill in your details below or click an icon to log in:

WordPress.com Logo

You are commenting using your WordPress.com account. Log Out /  Change )

Twitter picture

You are commenting using your Twitter account. Log Out /  Change )

Facebook photo

You are commenting using your Facebook account. Log Out /  Change )

Connecting to %s