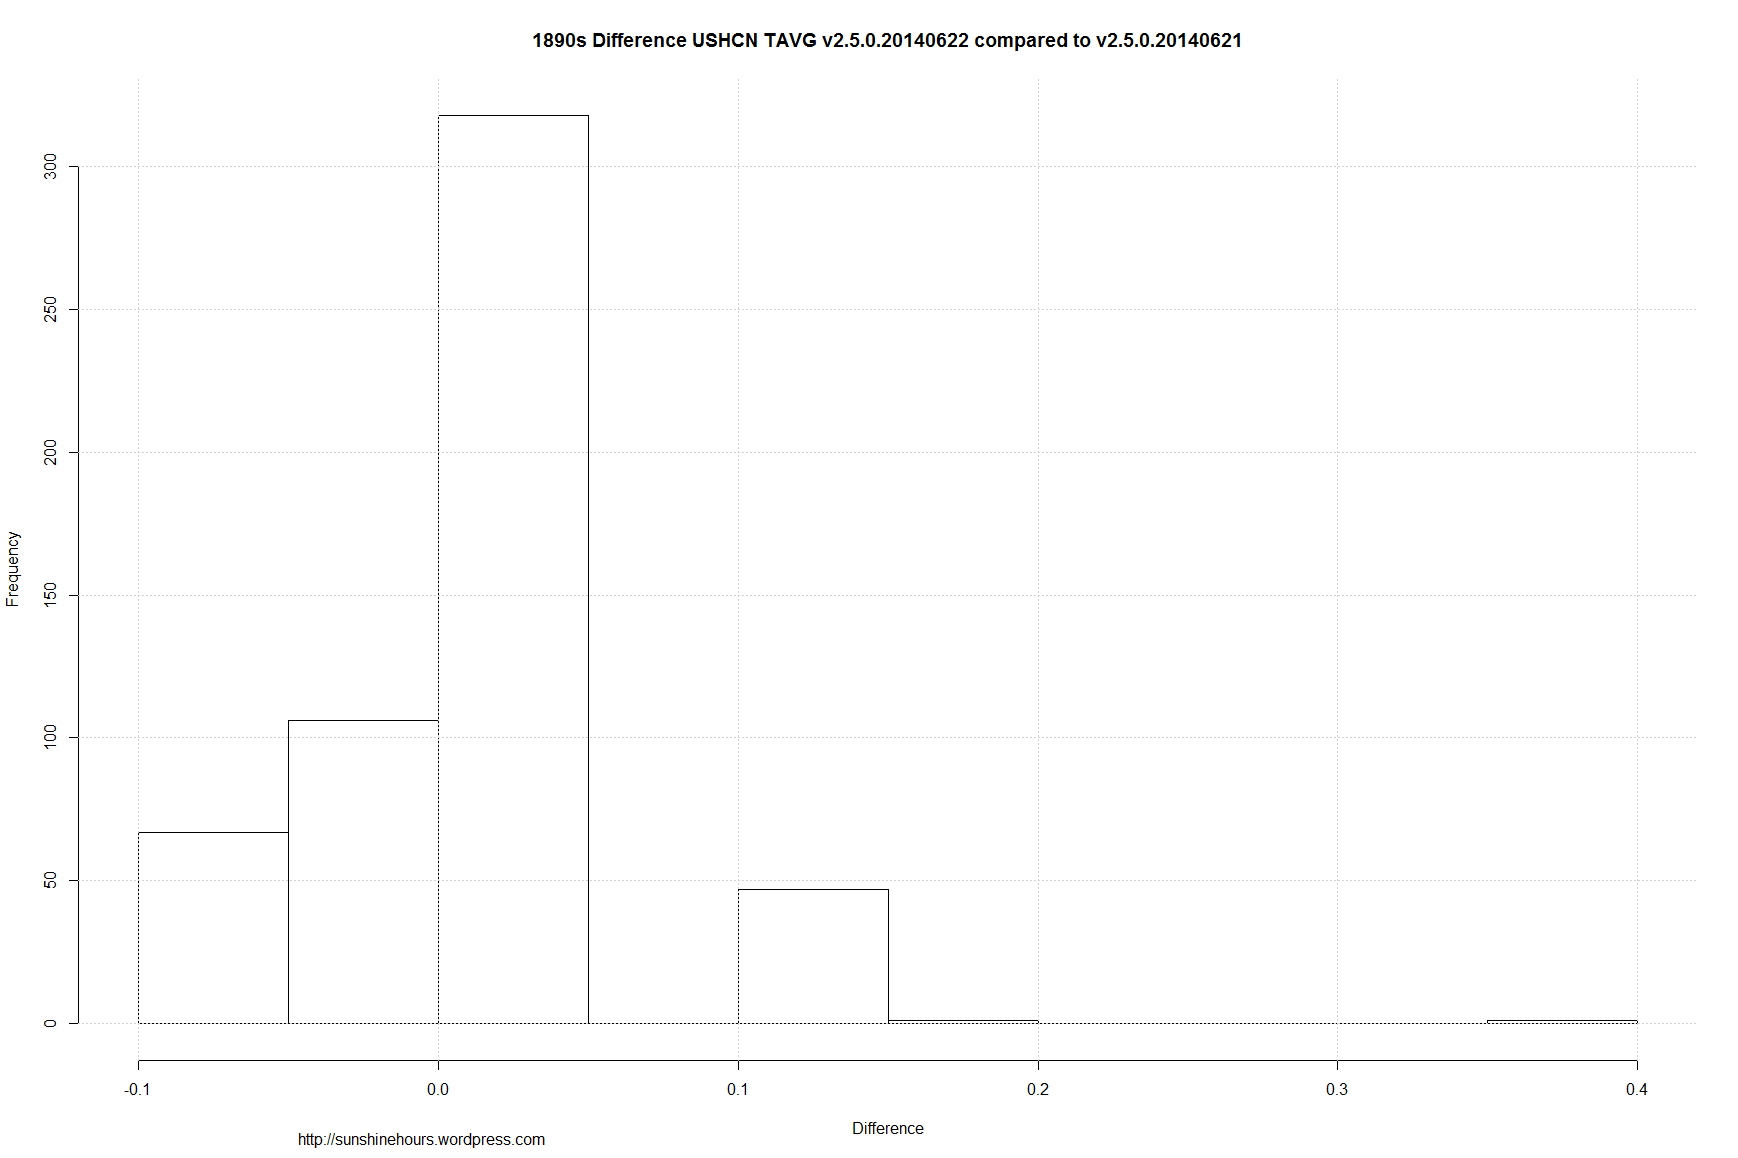
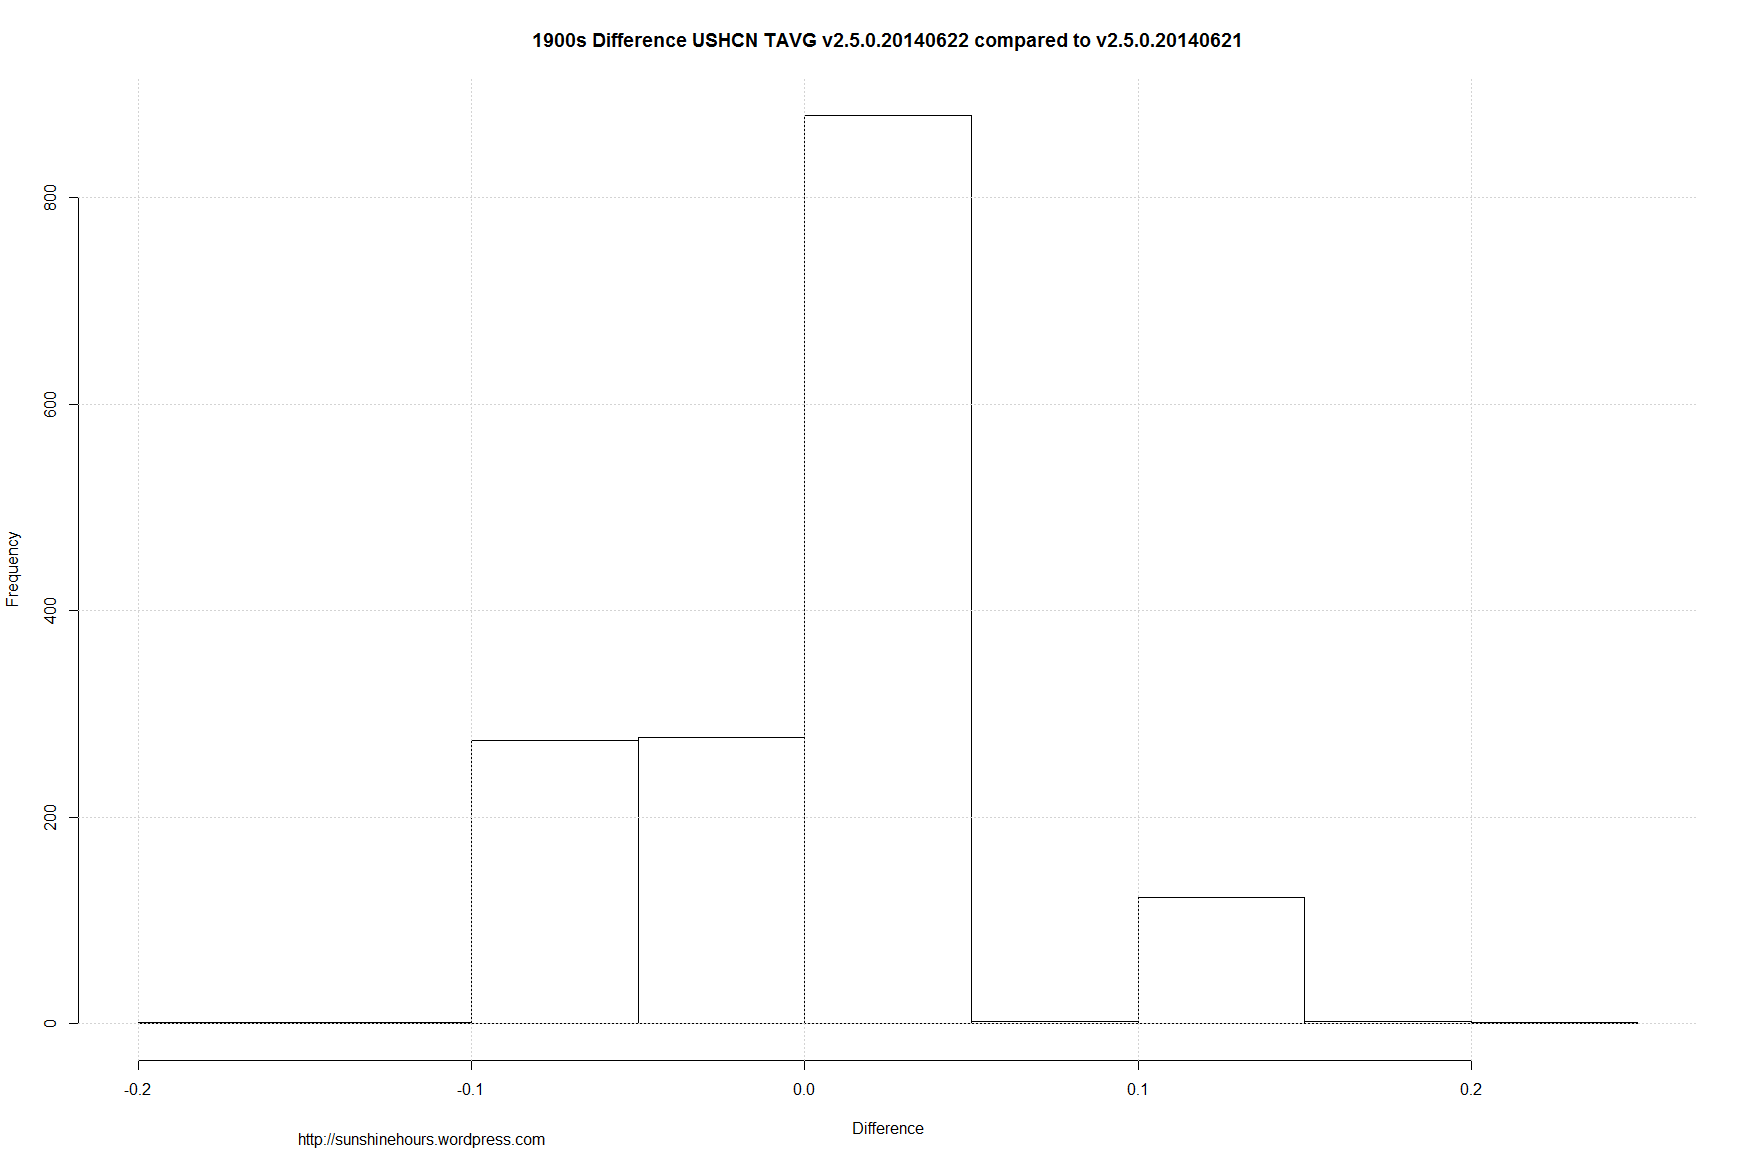
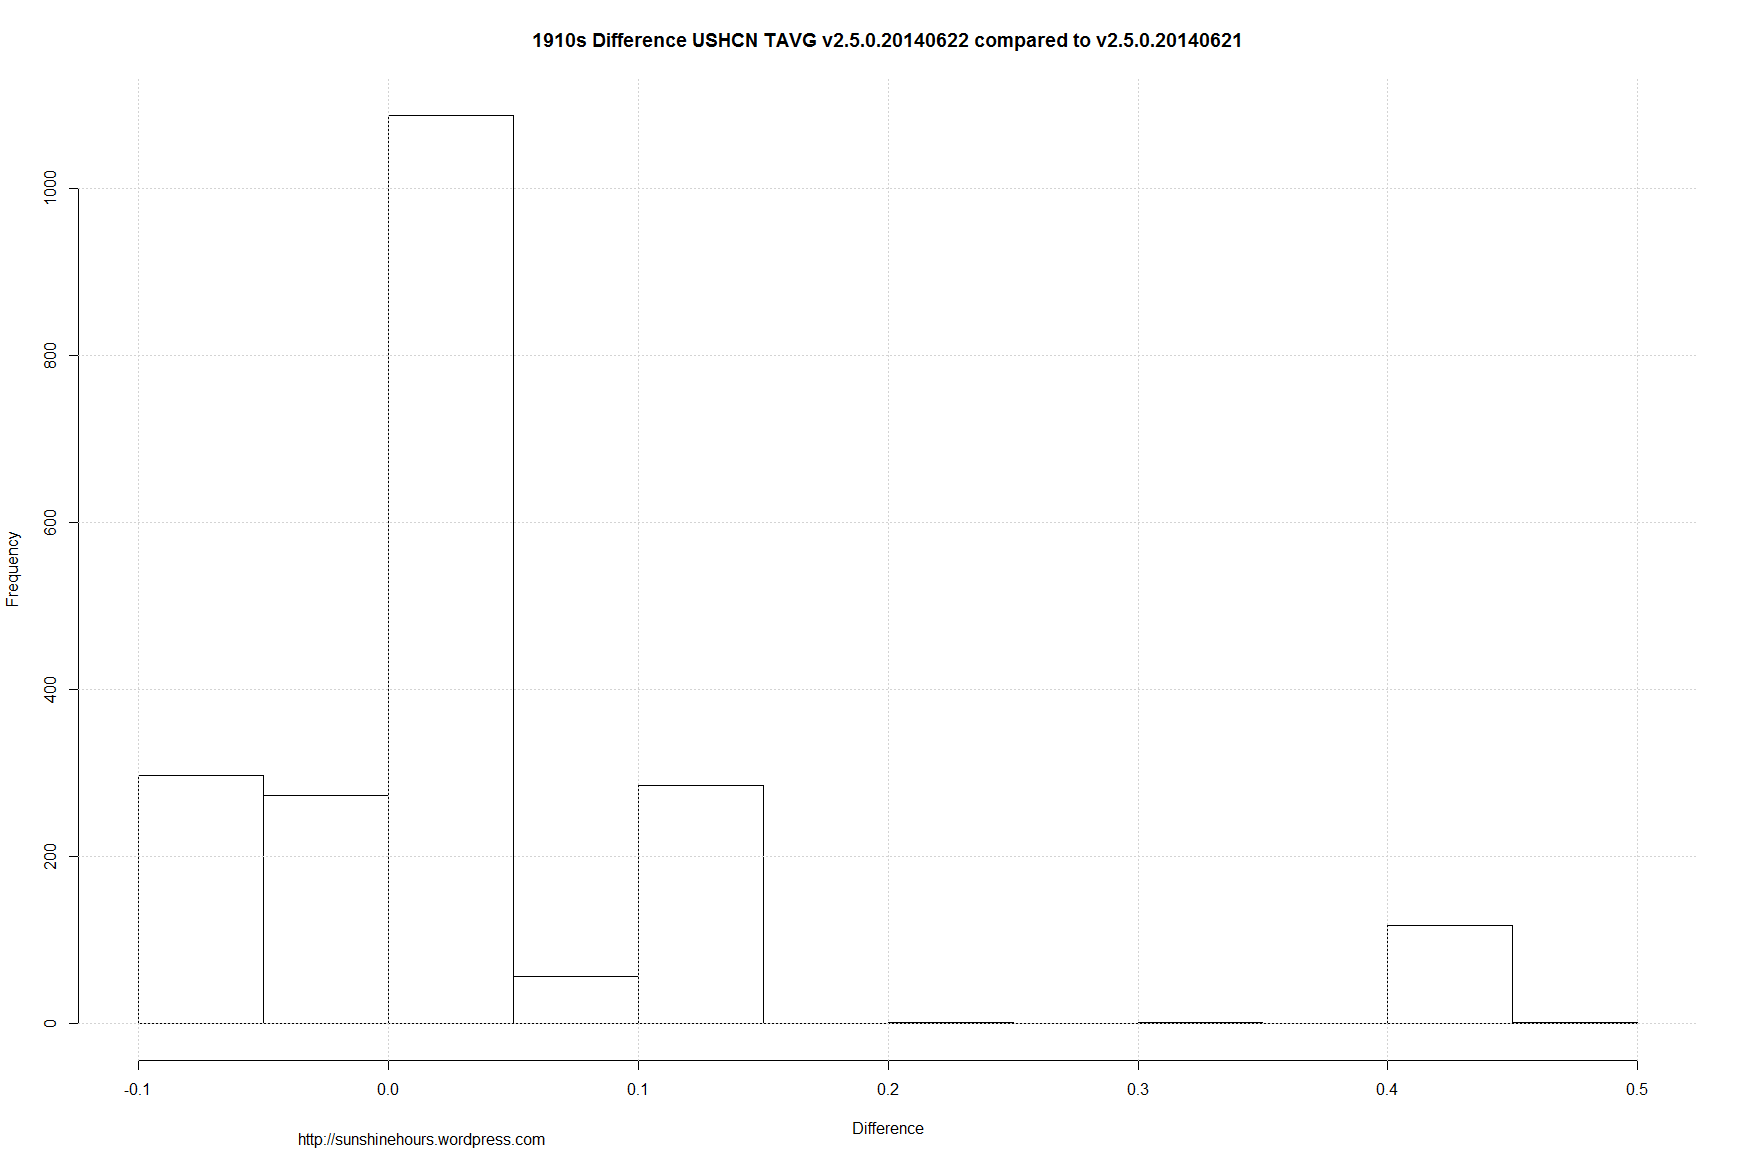
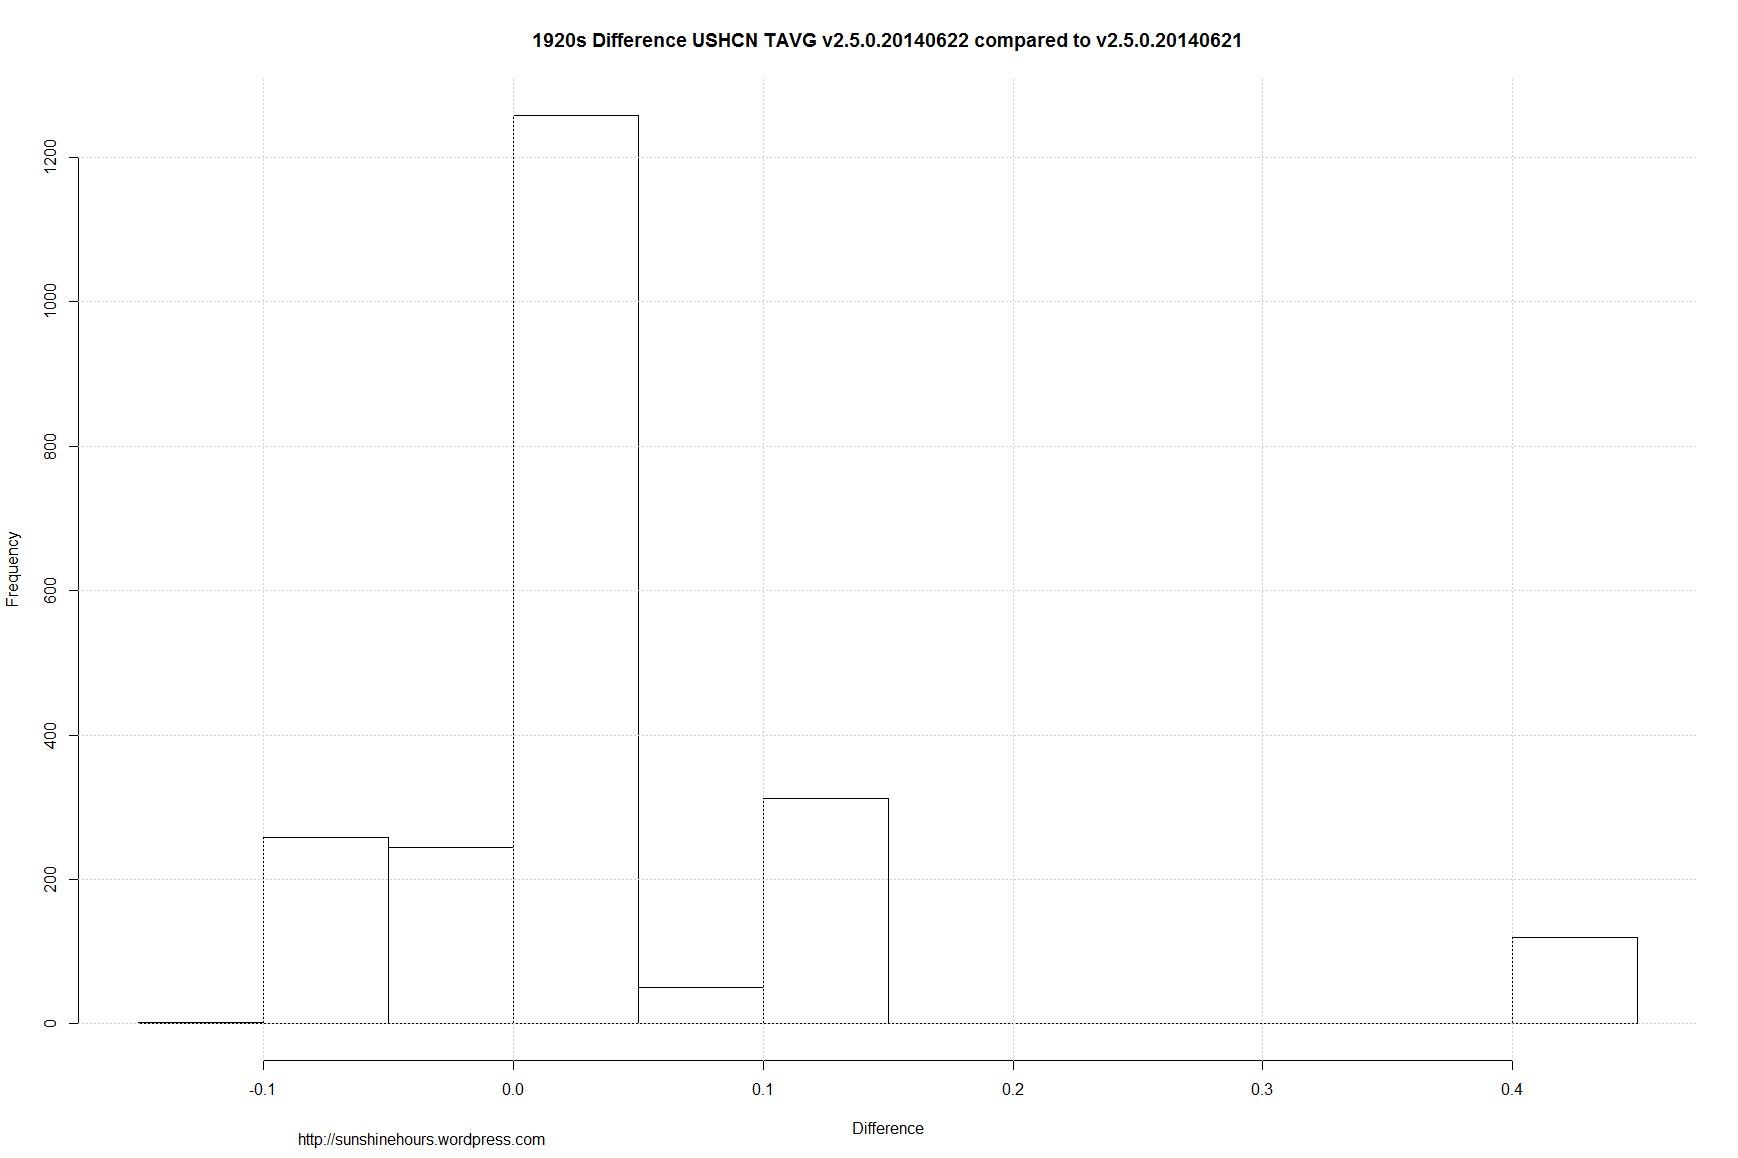
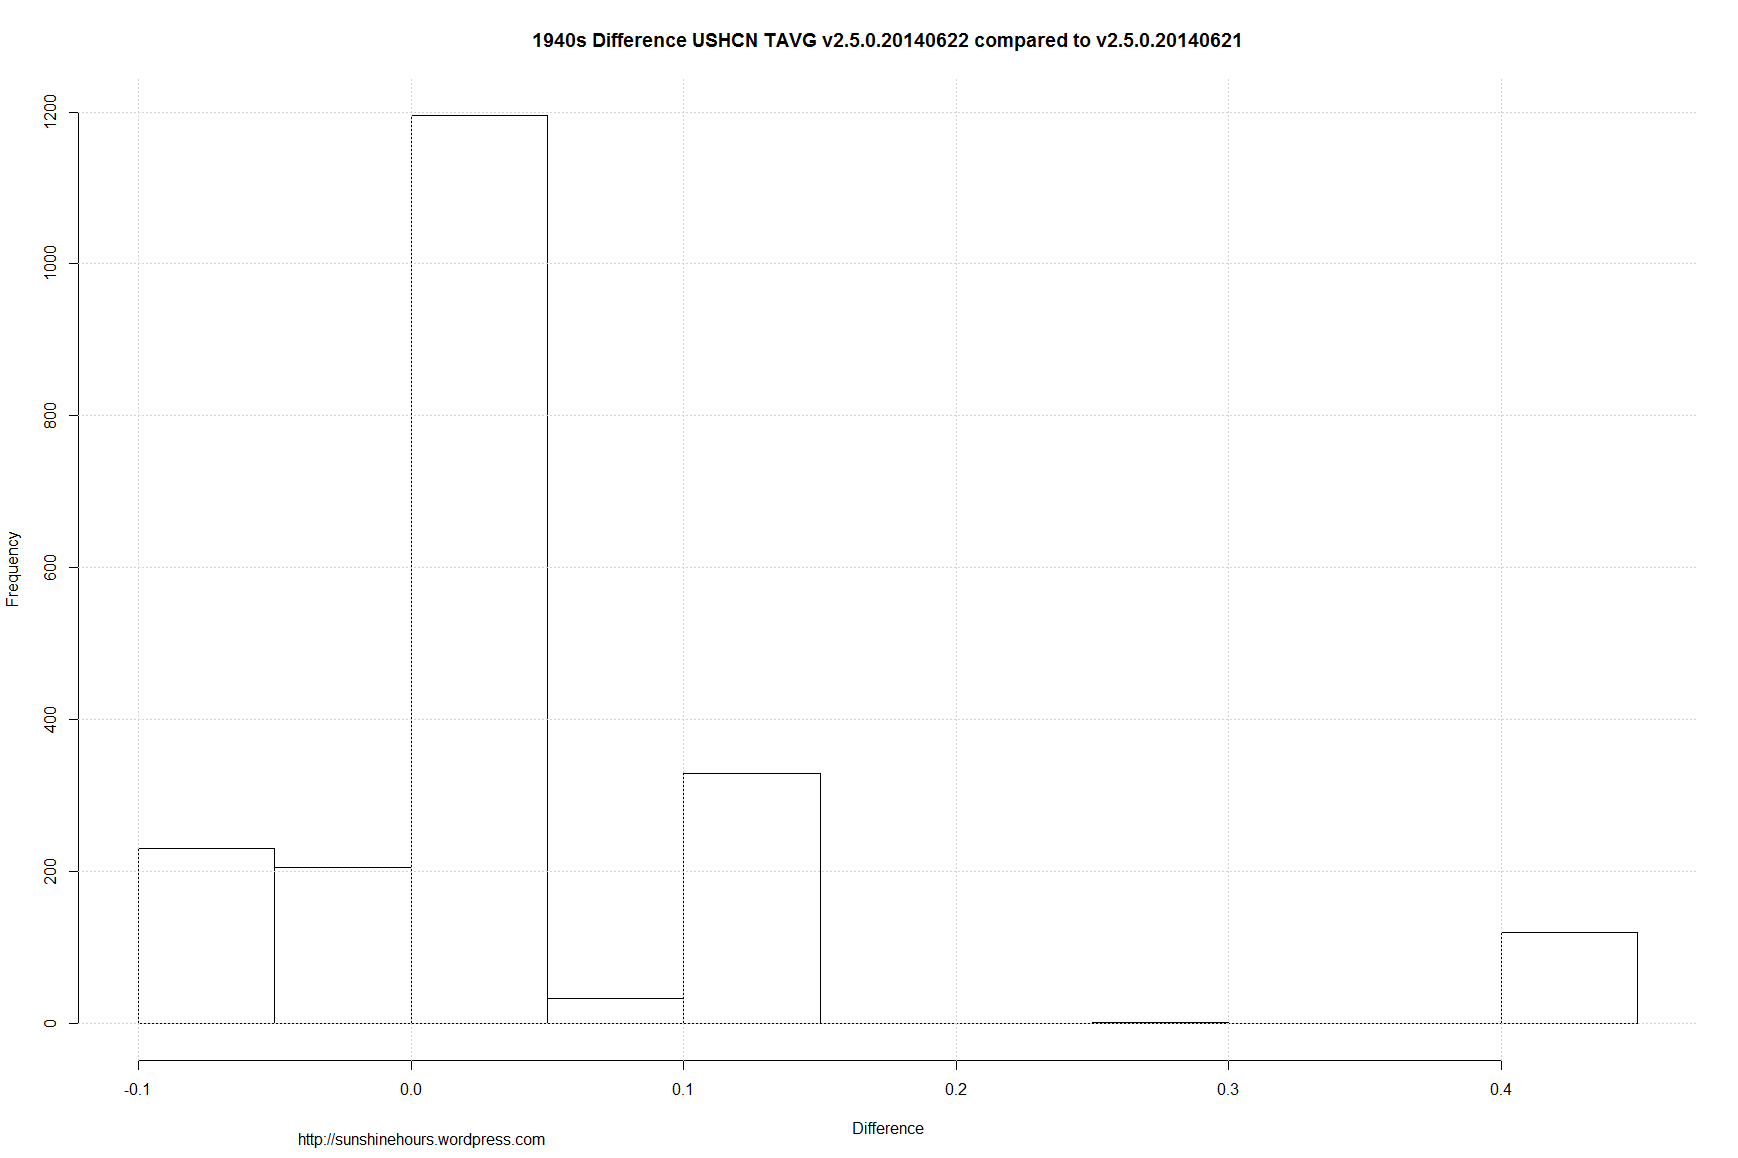
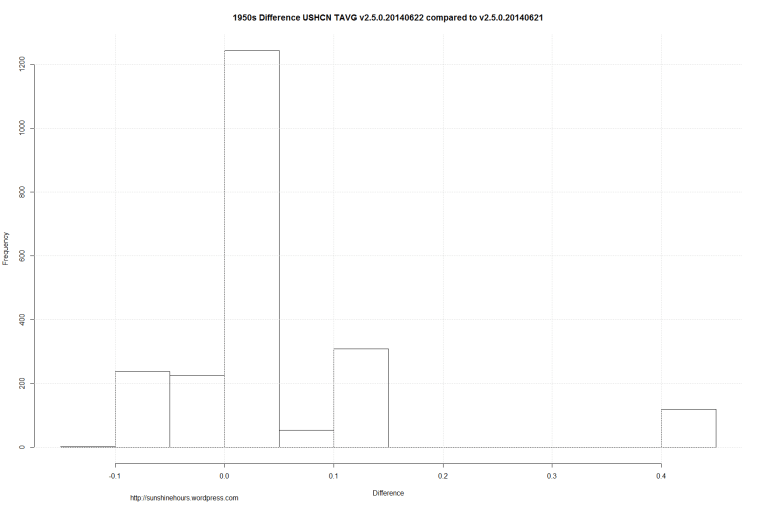
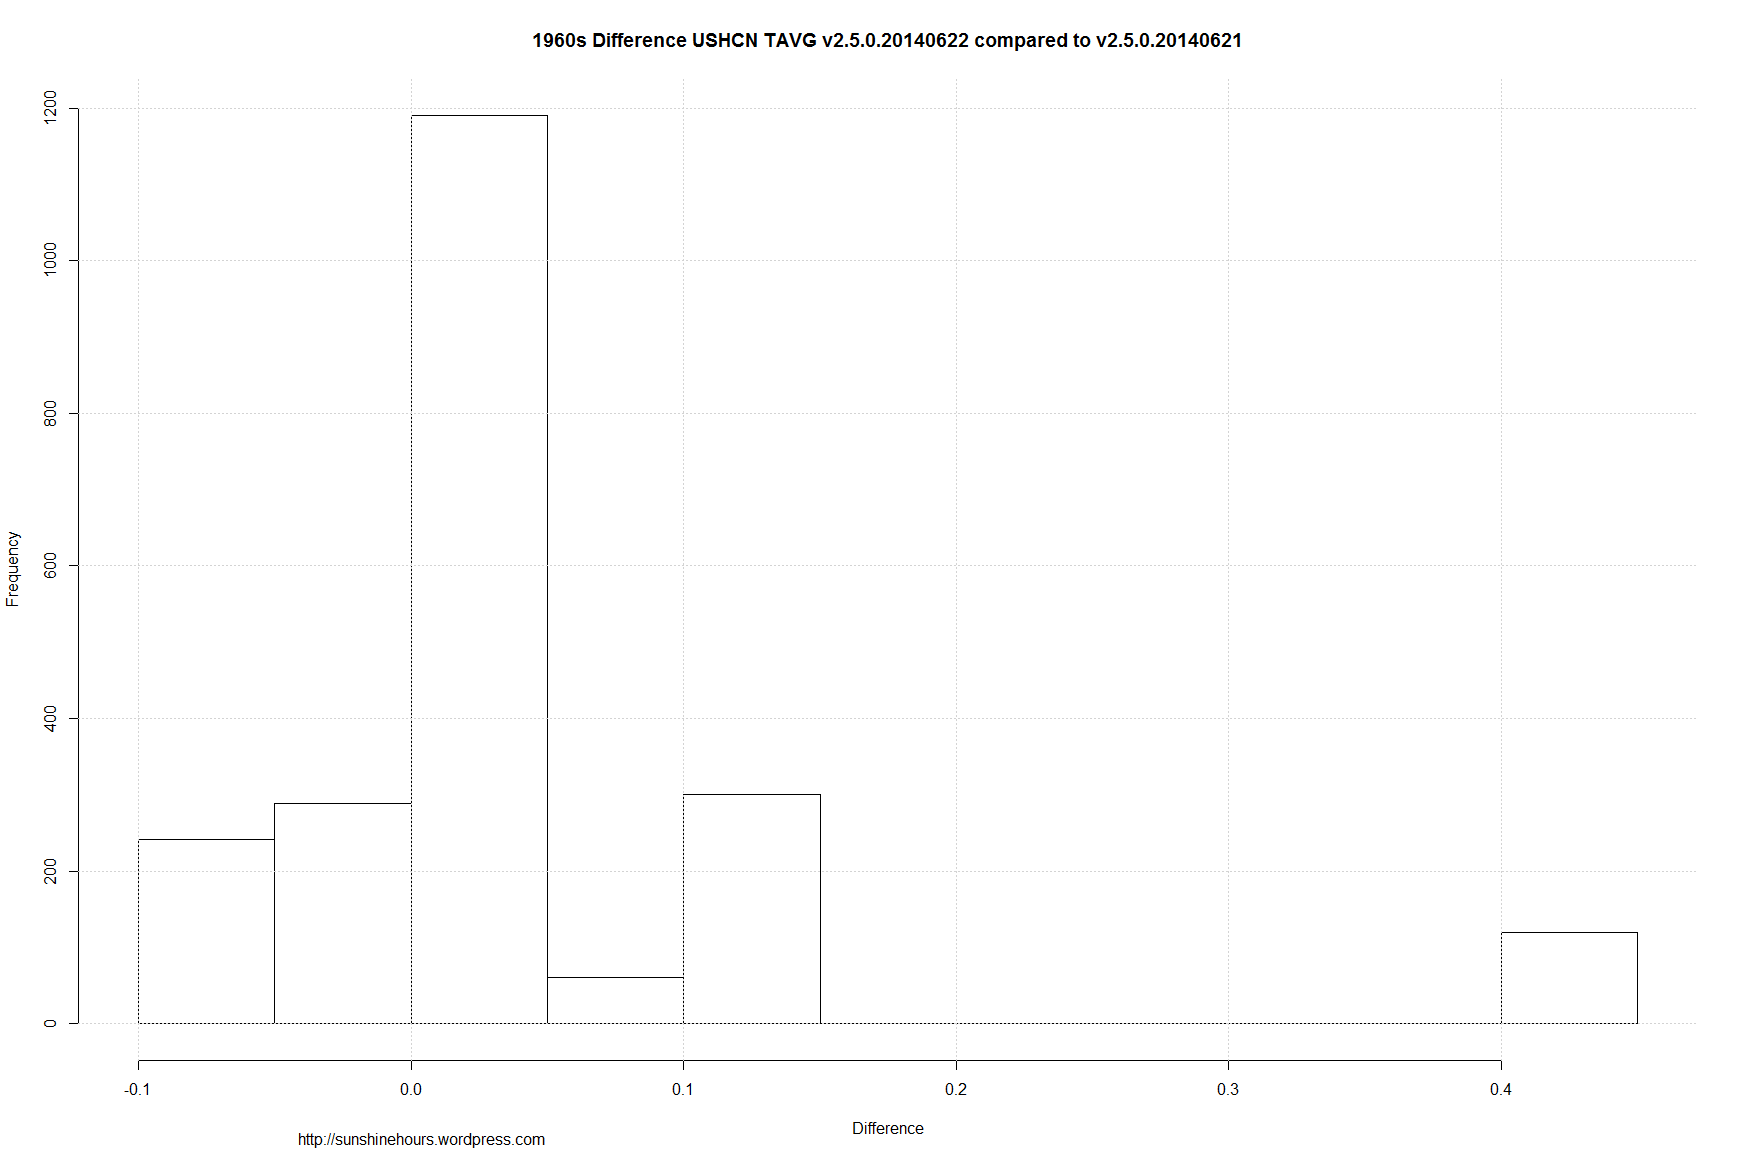
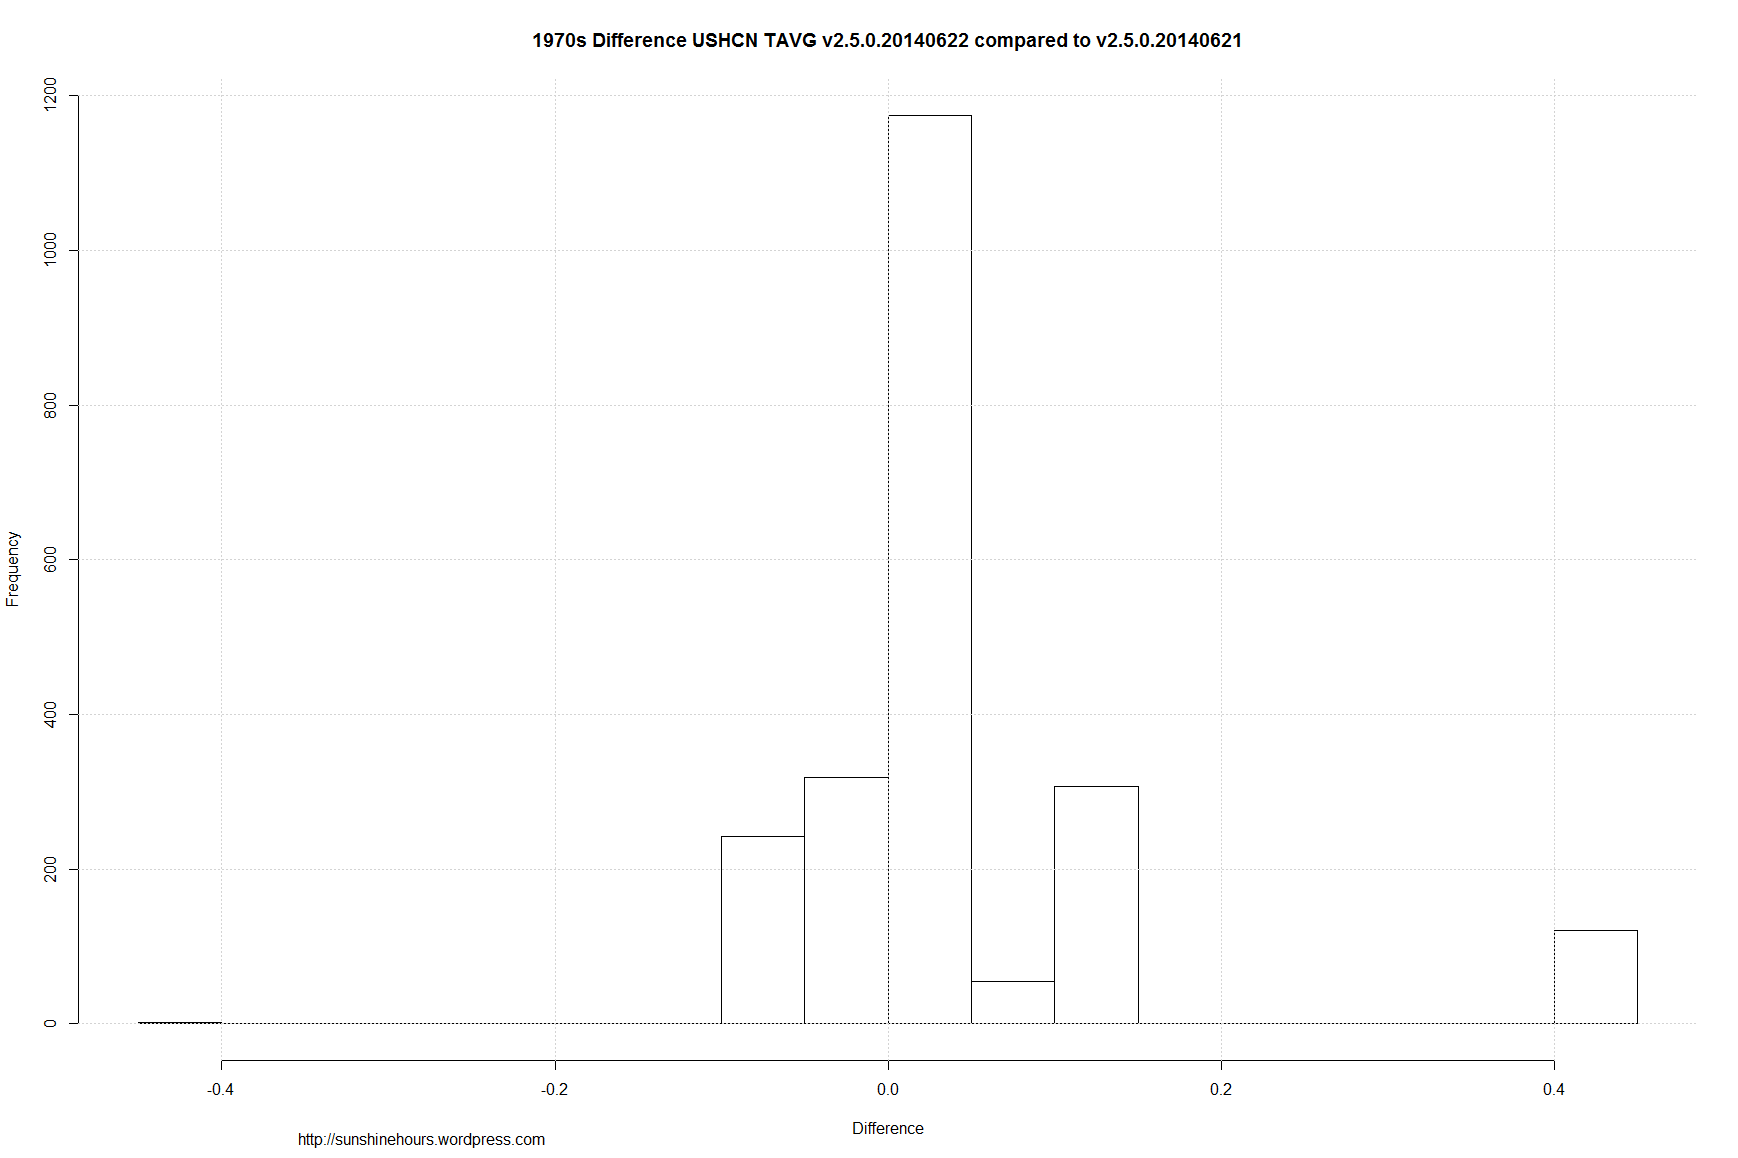
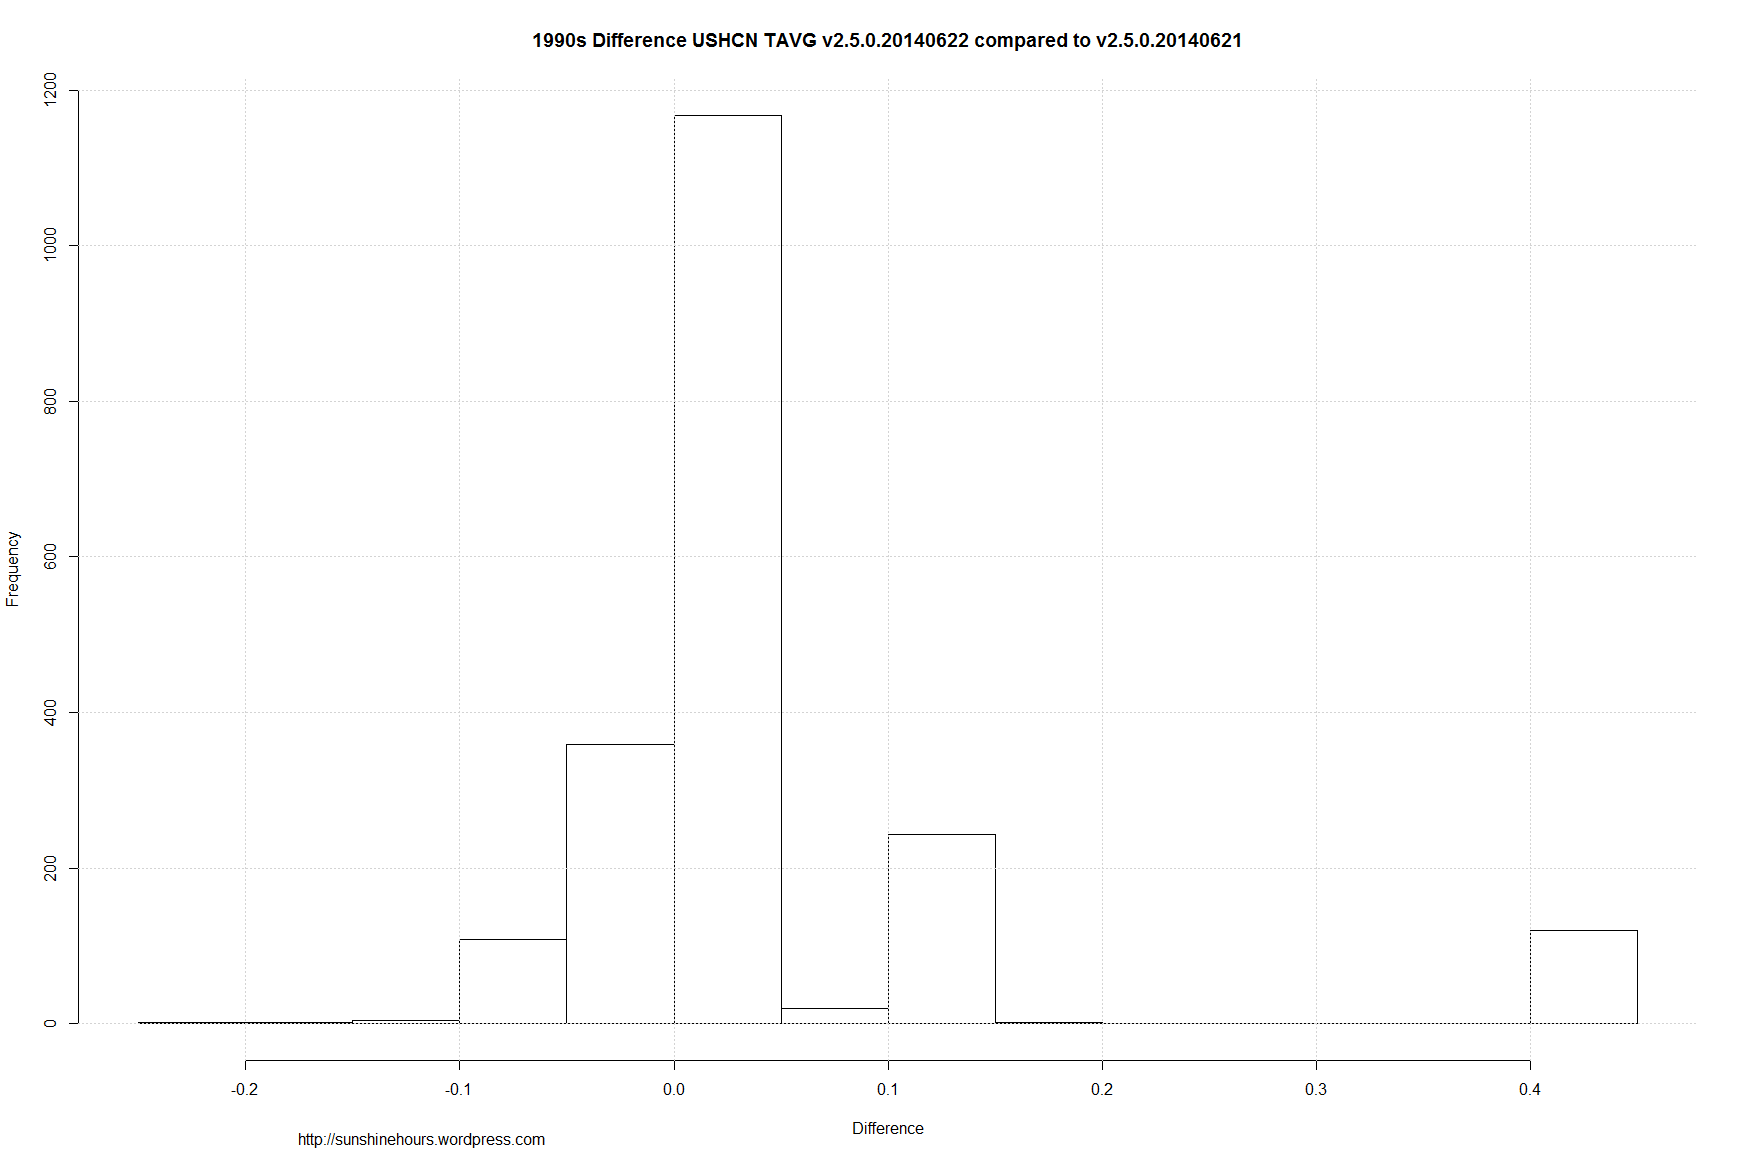
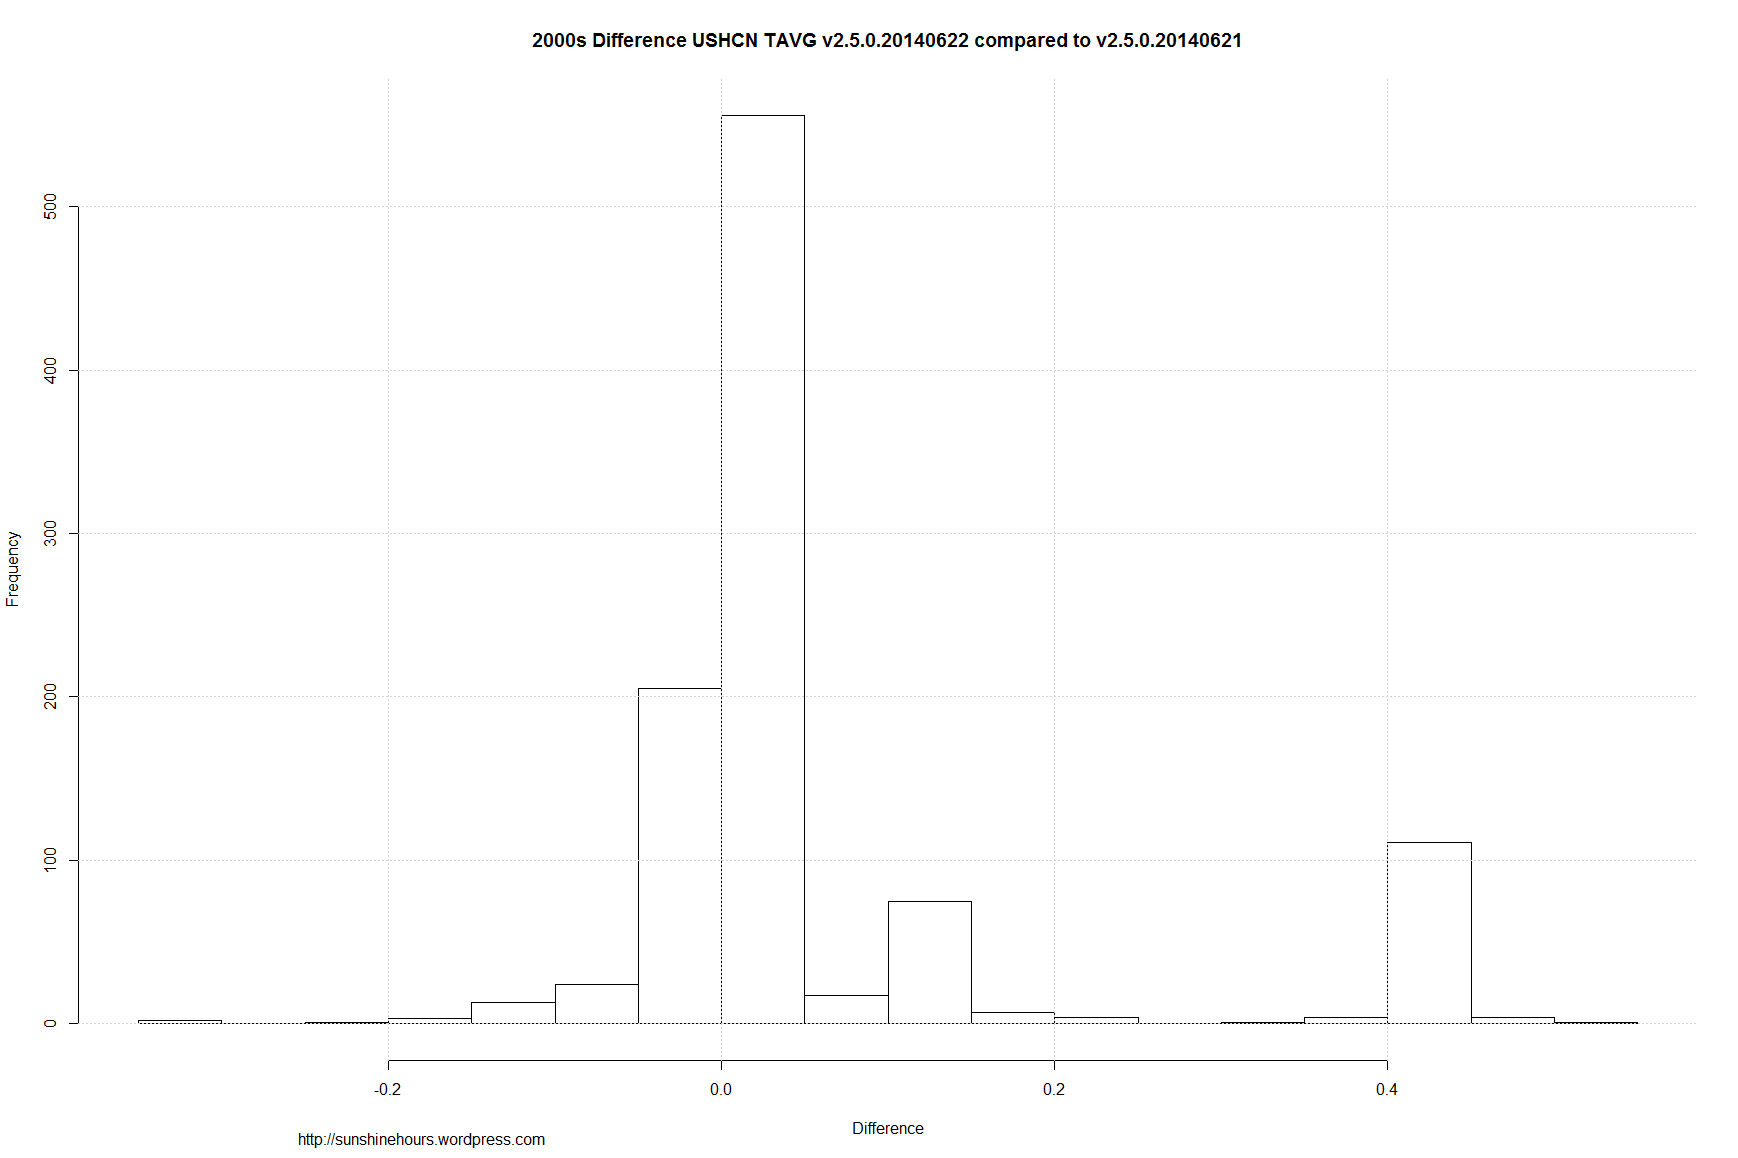
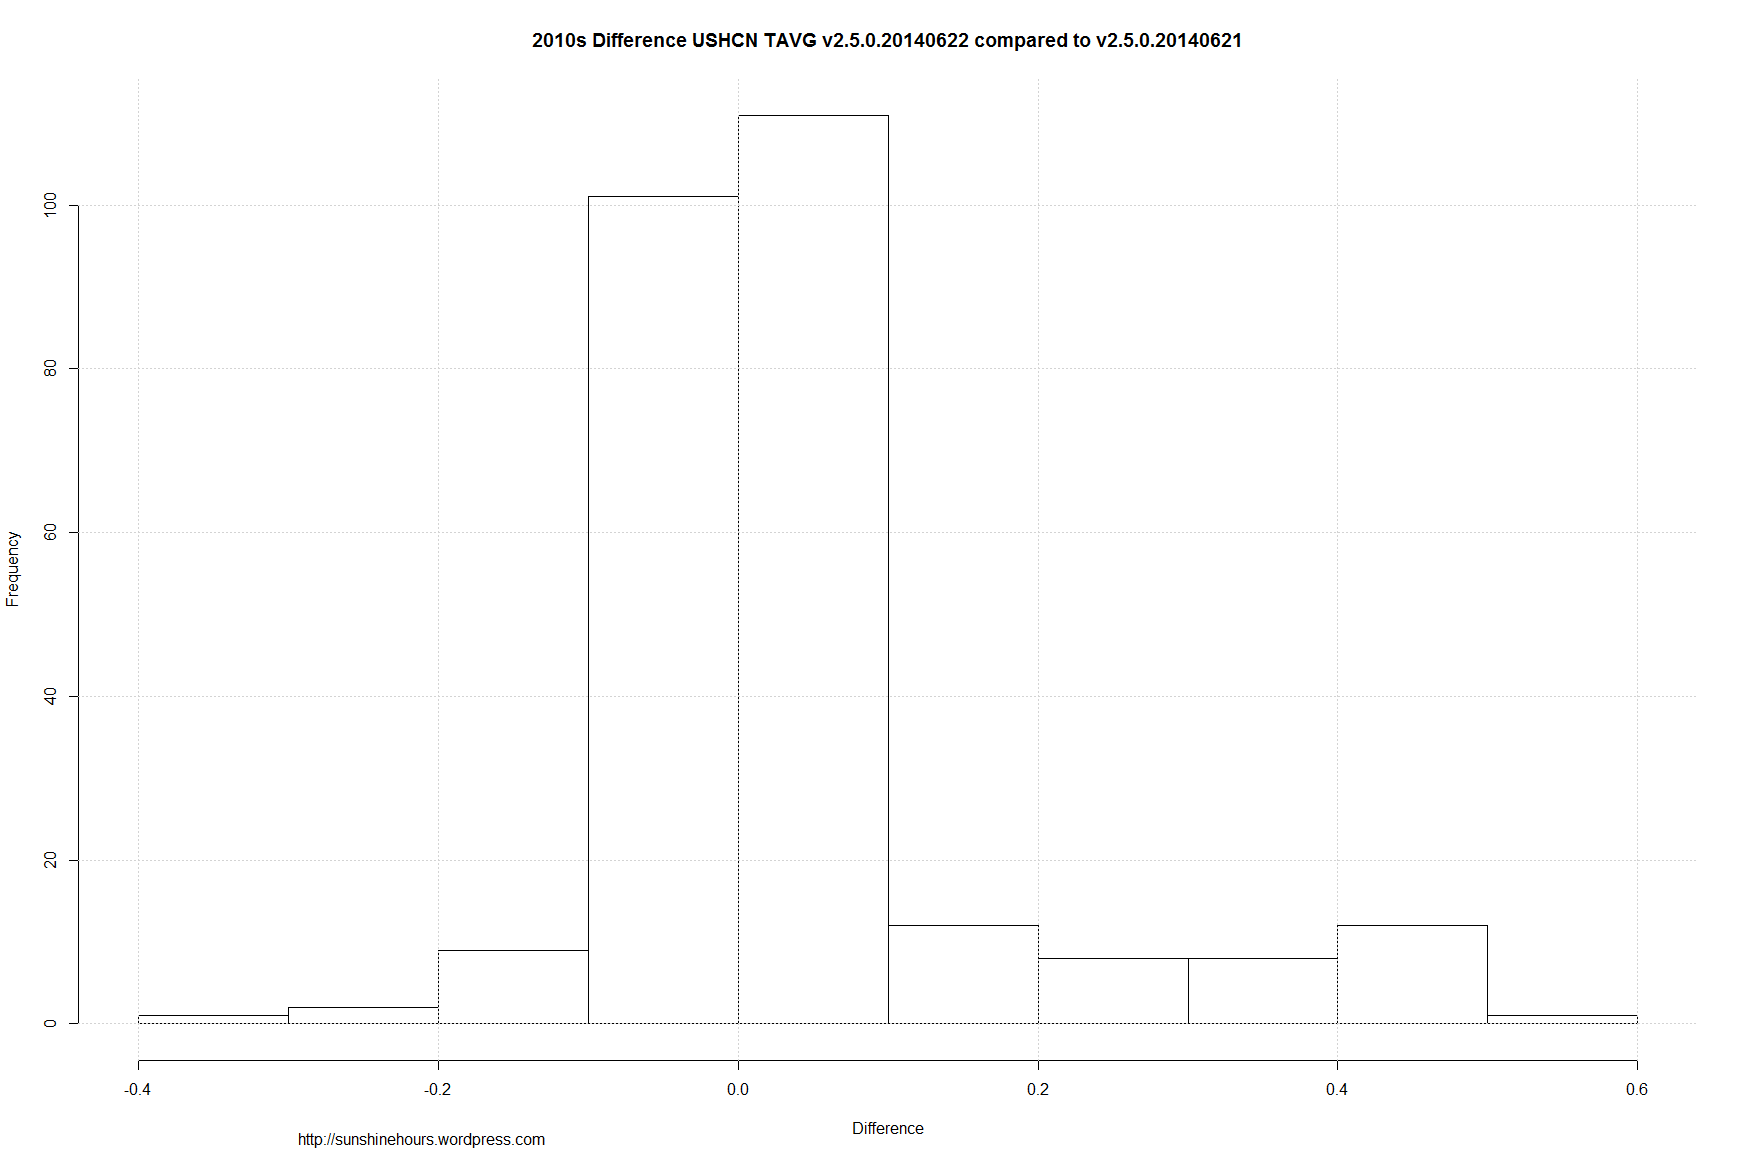
UPDATE: I got a request for a histogram by Decade for the differences. I have attached them at the bottom.
A few days ago I did a post about the USHCN data changing every day. I focused on one month of one year,
So this is a stats update. From Jun 21 2014 to Jun 22 2014 the TAVG data had 22,996 temperature values changed (out of 138136)
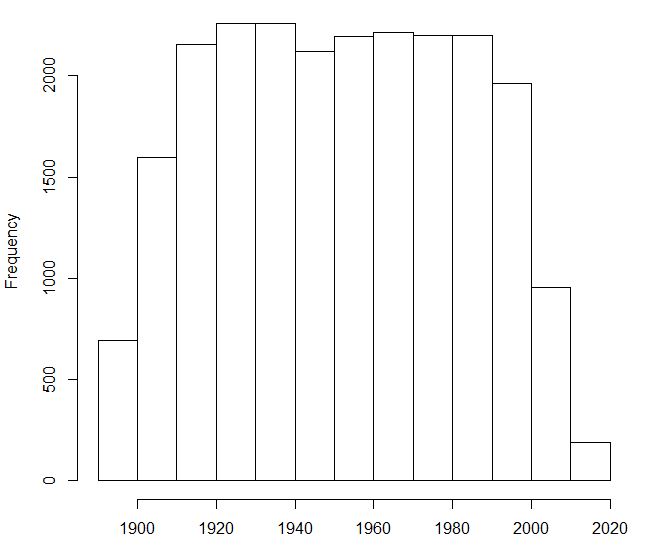
The changes were spread out through the years. And the change was predominantly to warm the data.
This is a histogram of the Year.
This is a histogram of the change. (The right side of 0 says the data got warmer)
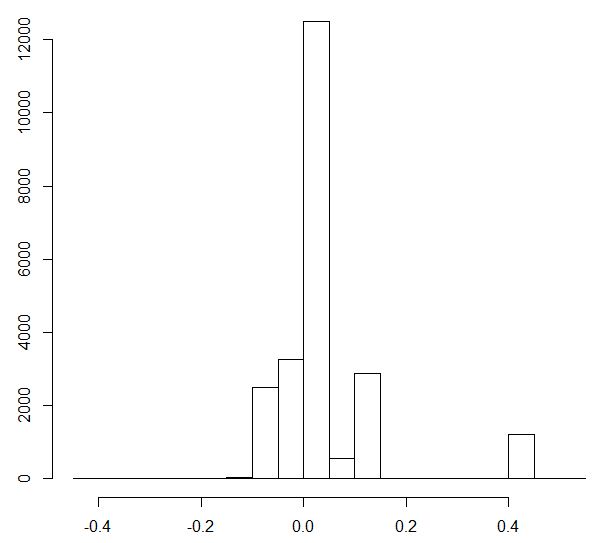


Do a histogram of each 10-year block, please.
Done. Added to post.