MASIE Arctic July 31 2014 – A Small Increase After Two Days of ‘Melt’

July 31 2014  MASIE Update – A Small Increase After Two Days of ‘Melt’ (wind may play some role).

The Central Arctic (1st bar graph) shows the Central Arctic refusing to melt — up 20,598 in last 7 days.

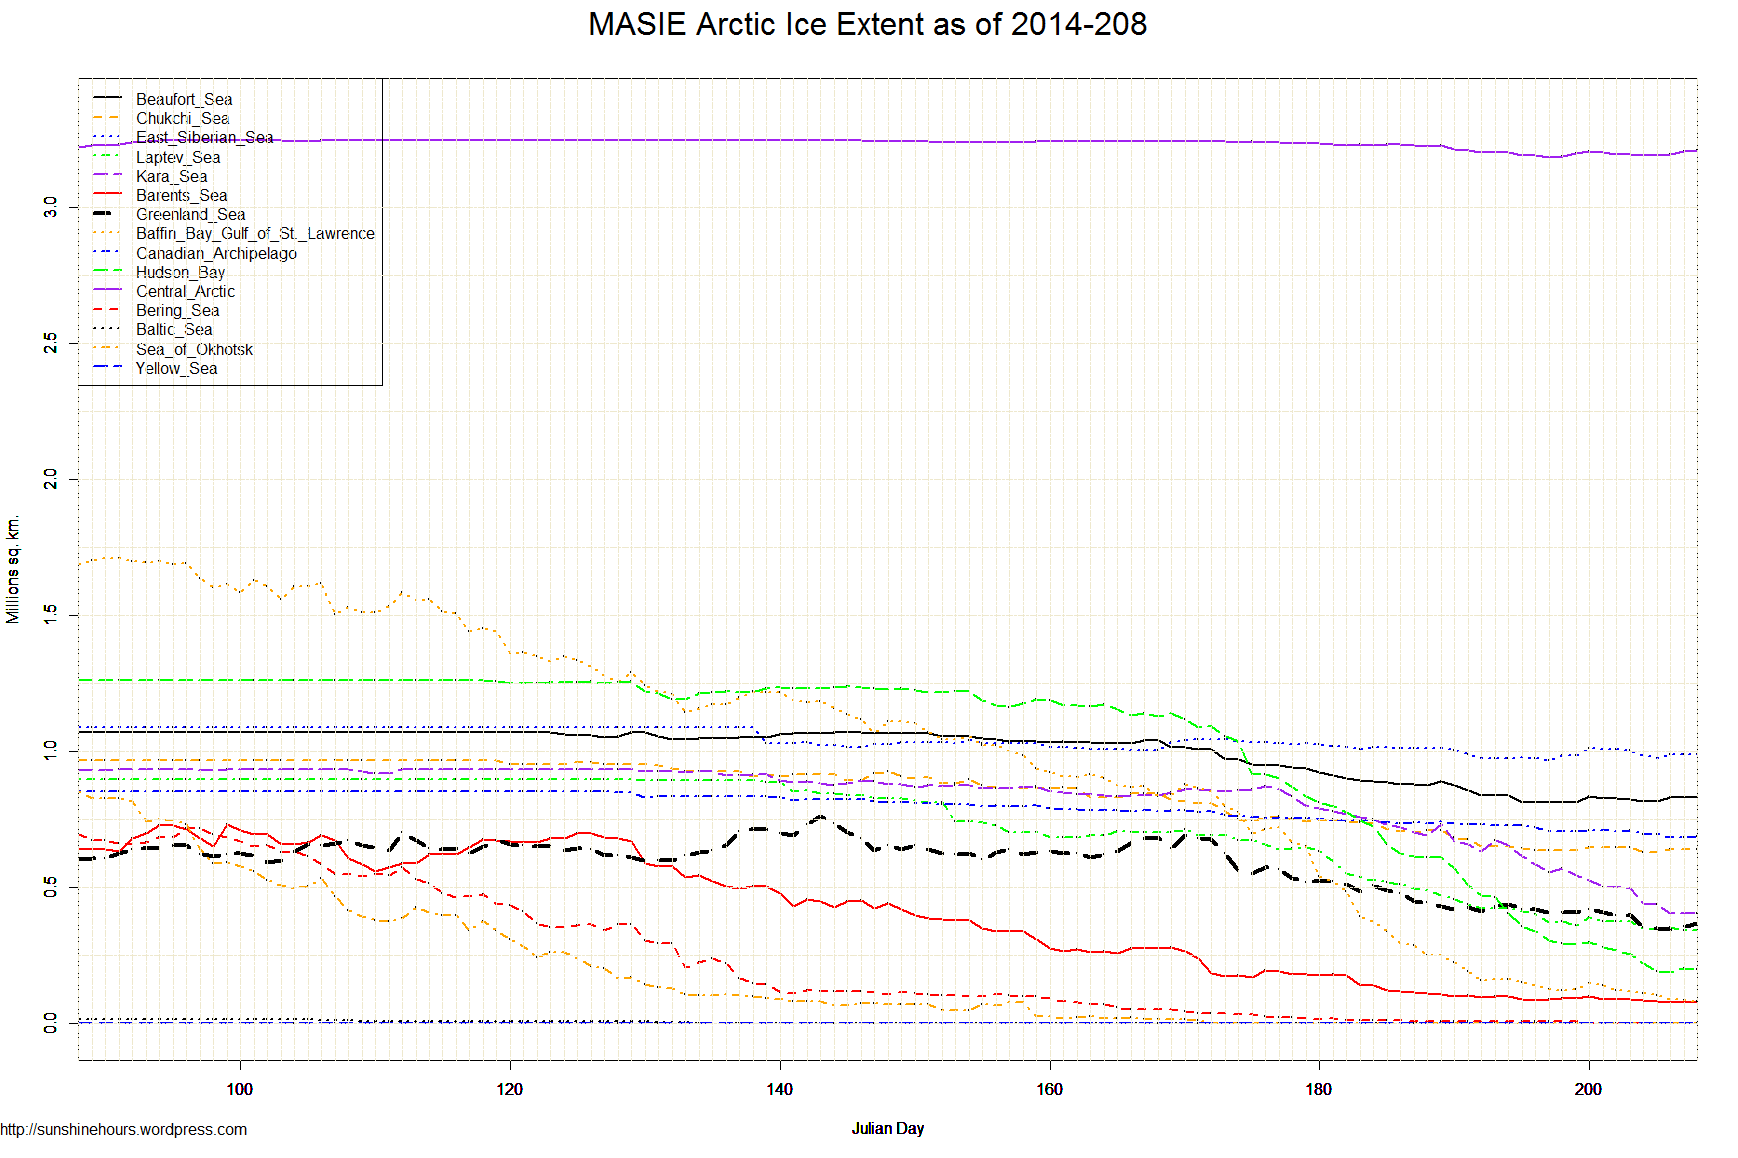
The Northern Hemisphere is the 2nd bar graph. Lots of melting.

Data here.  Click for bigger.

MASIE Central_Arctic Freeze.Melt as of 2014211

MASIE Northern_Hemisphere Freeze.Melt as of 2014211

MASIE Arctic Ice Extent as of 2014-211

Region 124 days ago End Last 123 Last 28 Last 14 Last 7 Last 3 Last 1
East Siberian Sea 1,087,137 935,195 -151,942 -73,734 -33,403 -51,653 -55,726 -12,962
Laptev Sea 897,845 261,389 -636,456 -277,564 -111,623 -87,147 -79,694 -11,824
Beaufort Sea 1,070,445 838,243 -232,202 -56,602 25,732 21,775 5,711 -1,770
Canadian Archipelago 853,214 694,873 -158,341 -52,393 -10,769 159 7,285 -1,120
Hudson Bay 1,260,903 165,379 -1,095,524 -583,222 -140,218 -54,381 -35,075 -336
Bering Sea 697,324 0 -697,324 -11,314 -7,345 -15 -15 0
Baltic Sea 15,337 0 -15,337 0 0 0 0 0
Sea of Okhotsk 853,240 0 -853,240 0 0 0 0 0
Yellow Sea 0 0 0 0 0 0 0 0
Chukchi Sea 966,006 612,946 -353,060 -128,237 -25,276 -15,076 -28,860 1,310
Baffin Bay Gulf of St. Lawrence 1,688,530 76,451 -1,612,079 -316,965 -49,116 -35,228 -6,171 1,953
Central Arctic 3,221,921 3,210,238 -11,683 -20,086 25,127 20,598 1,131 2,983
Greenland Sea 603,416 356,821 -246,595 -129,540 -53,747 1,431 -12,457 6,824
Barents Sea 645,917 83,937 -561,980 -55,310 -3,953 -2,360 4,090 7,261
Kara Sea 933,859 348,137 -585,722 -408,507 -208,894 -92,049 -56,512 17,681
Northern Hemisphere (Total) 14,805,115 7,584,752 -7,220,363 -2,113,700 -593,483 -293,946 -256,293 10,000
NH (Average Loss per Day) -58,229 -75,489 -42,392 -41,992 -85,431 10,000

Antarctic Sea Ice Extent July 31 2014 – 1,110,000 sq km Above Normal – 133rd Daily Record

Antarctic Sea Ice Extent is 1,110,000 sq km above the 1981-2010 mean. That is the 133rd daily record for the year.

An interesting note: Both 2013 (black line) and 2012 (orange line) set all time maximum records … yet were 900,000 sq km apart at this day.

Antarctic_Sea_Ice_Extent_Zoomed_2014_Day_211_1981-2010Antarctic_Sea_Ice_Extent_2014_Day_211_1981-2010


Antarctic Sea Ice Extent July 29 2014 – Zigzag – 131st Daily Record

Antarctic Sea Ice Extent is 1,107,000 sq km above the 1981-2010 mean.

After dropping 90,000 sq km two days ago, ice extent rose 100,000 sq km the next day.

131 daily records in 2014. And 209 out of 209 in the top 5.

 Year First Second Third Fourth Fifth Top 5
 2014 131   33     16    28     1      209

Antarctic_Sea_Ice_Extent_Zoomed_2014_Day_209_1981-2010


Sea Ice Data is late today – July 29 2014

Update: Arctic/Antarctic have appeared. MASIE is still one day old.

Normally the NSIDC Sea Ice Data is posted on their site at 6:51am Pacific Time.

Some days it is late or isn’t updated until the next day.

The MASIE data gets updated about 7:17am Pacific. It was updated … but it the previous days data.


MASIE Arctic July 28 2014 – Freezing and More Ice

July 28 2014  MASIE Update

The top graph just shows the Central Arctic … and shows 4 days in a row of freezing. The Central Arctic has 3.2 million sq km out of 7.8 million sq km left for the whole Northern Hemisphere.

The 2nd graph shows 2 days of freezing for the whole Northern Hemisphere … about 30,000 sq km net total freezing. (When I use the term freezing I mean more ice. It could be wind moving the ice around too)

The graphs have different scales.

Data here.  Click for bigger.

MASIE Central_Arctic Freeze.Melt as of 2014208

MASIE Northern Hemisphere Freeze.Melt as of 2014208

MASIE Arctic Ice Extent as of 2014-208

Region 121 days ago End Last 120 Last 28 Last 14 Last 7 Last 3 Last 1
Baffin Bay Gulf of St. Lawrence 1,688,530 82,623 -1,605,908 -457,782 -80,285 -58,263 -20,616 -2,124
Hudson Bay 1,260,903 200,454 -1,060,449 -614,568 -206,510 -78,954 9,293 -1,182
Chukchi Sea 966,006 641,806 -324,200 -103,665 -9,047 -5,570 13,239 0
East Siberian Sea 1,087,137 990,921 -96,217 -36,503 17,263 -17,514 14,910 0
Laptev Sea 897,845 341,083 -556,761 -290,827 -82,700 -36,438 -5,488 0
Kara Sea 933,859 404,649 -529,211 -387,393 -250,763 -97,913 -33,492 0
Barents Sea 645,917 79,847 -566,070 -98,773 -18,726 -10,705 -2,398 0
Bering Sea 697,324 15 -697,308 -15,501 -8,643 -1,323 0 0
Baltic Sea 15,337 0 -15,337 0 0 0 0 0
Sea of Okhotsk 853,240 0 -853,240 0 0 0 0 0
Yellow Sea 0 0 0 0 0 0 0 0
Beaufort Sea 1,070,445 832,532 -237,913 -92,230 -8,058 6,114 14,784 782
Canadian Archipelago 853,214 687,588 -165,626 -63,792 -41,190 -21,383 -6,888 3,914
Central Arctic 3,221,921 3,209,107 -12,815 -24,789 6,856 7,042 17,737 4,332
Greenland Sea 603,416 369,278 -234,138 -154,382 -68,624 -40,760 18,619 12,491
Northern Hemisphere (Total) 14,805,115 7,841,045 -6,964,070 -2,340,592 -750,426 -355,666 19,701 18,212
NH (Average Loss per Day) -57,554 -83,593 -53,602 -50,809 6,567 18,212