The other day I noted that NOAA had July 1936 back on top. Now don’t take this post as an endorsement of the adjustments and infilling, but I thought I would check which years did stations set their hottest July and coldest July.
I am using USHCN Final Tmax monhtly data . From the file v2.5.0.20140627. (This is not necessarily all the data NOAA uses)
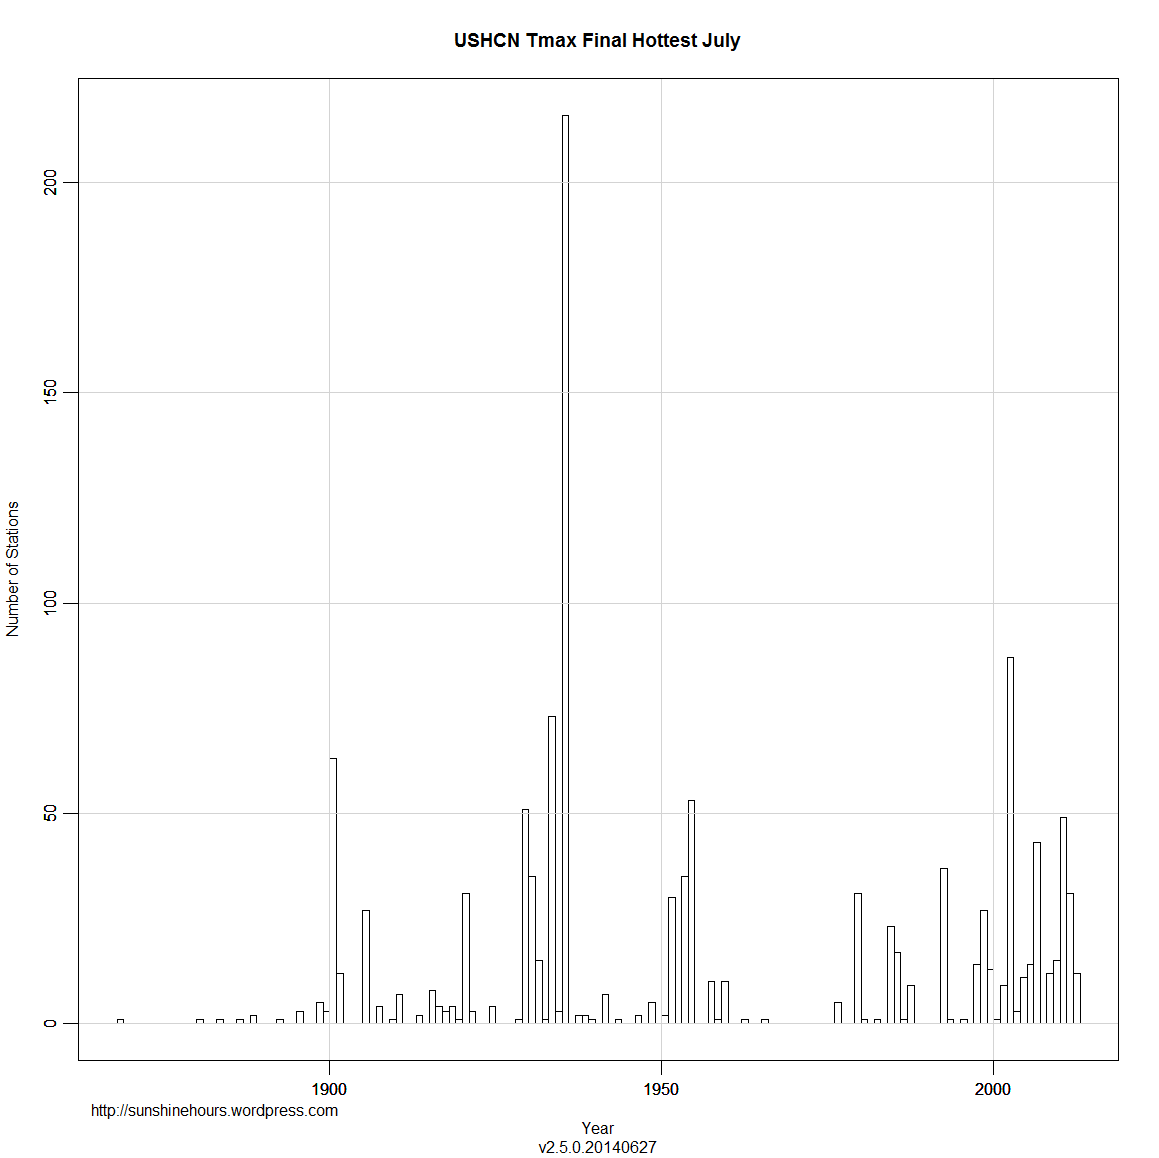
I don’t think the histogram of the hottest July will actually be a surprise. 216 stations had their hottest July in 1936.
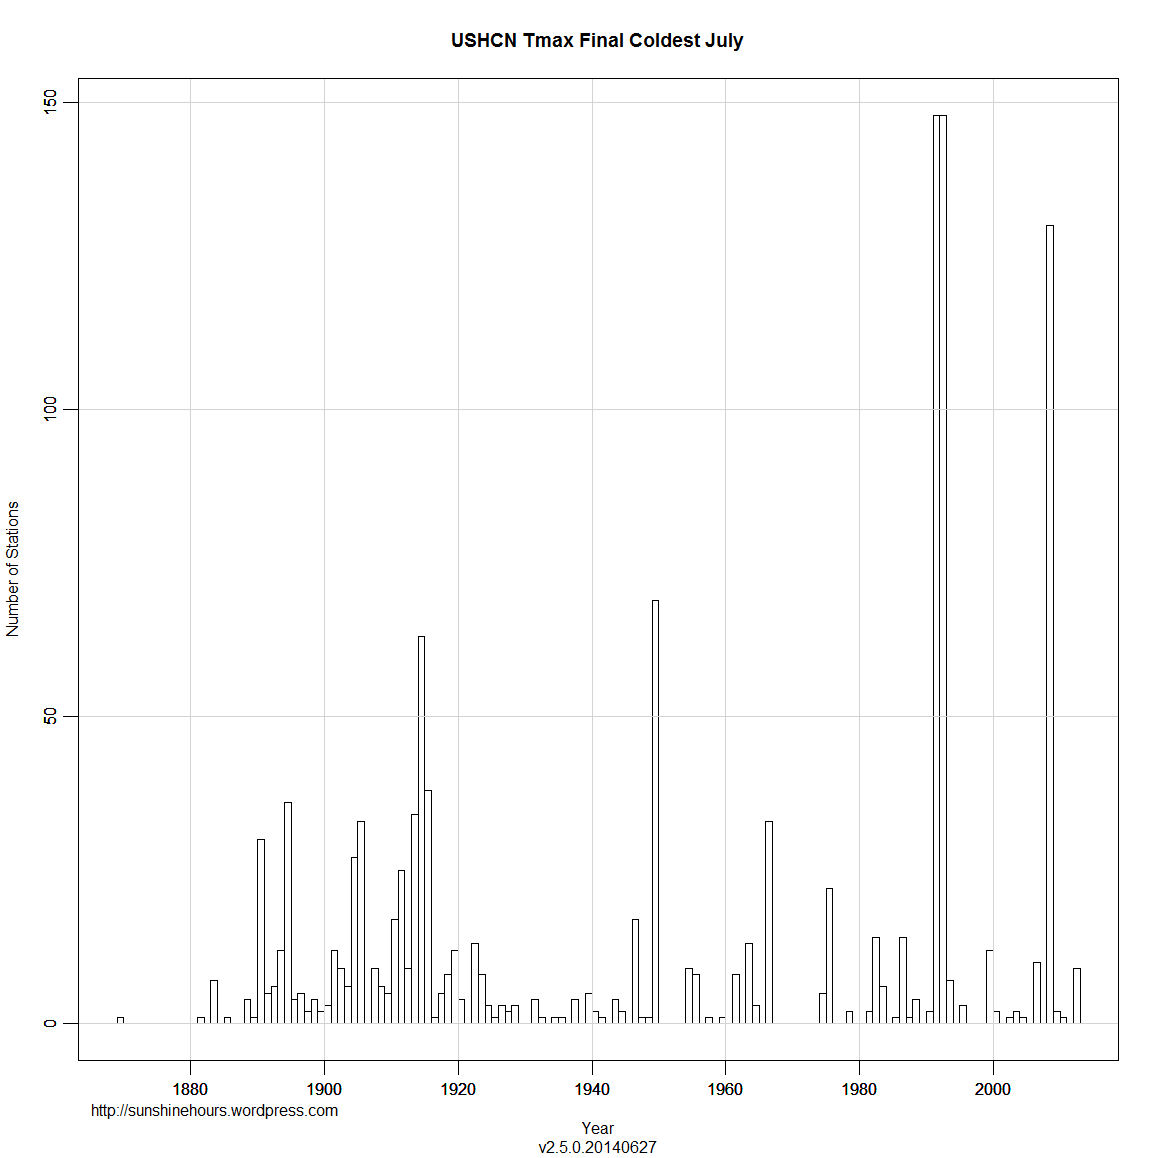
But the coldest July histogram will surprise you. 1992 and 1993 tied with 148 stations each having the coldest July. A small subset of the stations at bottom.
I just picked the top 15 stations with the coldest July in 1992 and the hottest July in 1936. There are 92. The temperatures are in Celsius.
| STATE | Station | NAME | Coldest_Year | Coldest_July | Hottest_Year | Hottest_July |
| IA | USH00130133 | ALGONA 3 W | 1992 | 23.22 | 1936 | 35.98 |
| IA | USH00131402 | CHARLES CITY | 1992 | 24.18 | 1936 | 34.5 |
| IA | USH00132724 | ESTHERVILLE 2 N | 1992 | 23.06 | 1936 | 35.82 |
| IA | USH00132977 | FOREST CITY 2 NNE | 1992 | 23.69 | 1936 | 35.72 |
| IA | USH00132999 | FORT DODGE 5NNW | 1992 | 24.73 | 1936 | 36.1 |
| IA | USH00134063 | INDIANOLA 2W | 1992 | 26.57 | 1936 | 37.13 |
| IA | USH00134894 | LOGAN | 1992 | 26.56 | 1936 | 39.88 |
| IA | USH00135952 | NEW HAMPTON | 1992 | 23.38 | 1936 | 35.31 |
| IA | USH00137147 | ROCK RAPIDS | 1992 | 23.96 | 1936 | 37.48 |
| IA | USH00137161 | ROCKWELL CITY | 1992 | 24.81 | 1936 | 36.69 |
| IA | USH00137979 | STORM LAKE 2 E | 1992 | 23.85 | 1936 | 36.54 |
| IA | USH00138296 | TOLEDO 3N | 1992 | 24.82 | 1936 | 35.34 |
| IL | USH00115326 | MARENGO | 1992 | 24.66 | 1936 | 33.89 |
| IL | USH00118916 | WALNUT | 1992 | 24.94 | 1936 | 36.2 |
| IN | USH00122149 | DELPHI 2 N | 1992 | 26.5 | 1936 | 36.38 |
Here are a sample of 15 that have neither.
| STATE | Station | NAME | Coldest_Year | Coldest_July | Hottest_Year | Hottest_July |
| AL | USH00011084 | BREWTON 3 SSE | 1989 | 30.77 | 1902 | 36.71 |
| AL | USH00012813 | FAIRHOPE 2 NE | 1928 | 30.05 | 2000 | 34.93 |
| AL | USH00013160 | GAINESVILLE LOCK | 1916 | 30.25 | 1952 | 37.26 |
| AL | USH00013511 | GREENSBORO | 1967 | 28.49 | 1901 | 35.09 |
| AL | USH00015749 | MUSCLE SHOALS AP | 1967 | 29.59 | 1930 | 36.57 |
| AL | USH00017157 | SAINT BERNARD | 1967 | 27.33 | 1952 | 35.2 |
| AL | USH00017304 | SCOTTSBORO | 1906 | 29.21 | 1980 | 35.86 |
| AL | USH00017366 | SELMA | 1916 | 28.1 | 2000 | 36.65 |
| AL | USH00018178 | THOMASVILLE | 1916 | 29.87 | 1930 | 36.35 |
| AL | USH00018380 | TUSCALOOSA ACFD | 1889 | 29.5 | 1930 | 37.77 |
| AL | USH00018469 | VALLEY HEAD | 1967 | 28.31 | 1930 | 36.48 |
| AR | USH00031596 | CONWAY | 1989 | 27.83 | 1954 | 38.96 |
| AR | USH00031632 | CORNING | 1905 | 29.14 | 1930 | 38.45 |
| AR | USH00032356 | EUREKA SPRINGS 3 WNW | 1950 | 27.51 | 1980 | 38.65 |
| AR | USH00032444 | FAYETTEVILLE EXP STN | 1950 | 27.86 | 1954 | 38.03 |

Noticing that you reference the Alabama stations in your second chart. Interesting that Paul Homewood found spurious warming in those stations by comparing January 1934 with January 2013
The average was 1.34F added over that time frame.
Yes. I read Paul’s blog.
I may do the same histograms with the raw data and then not using Estimated data.