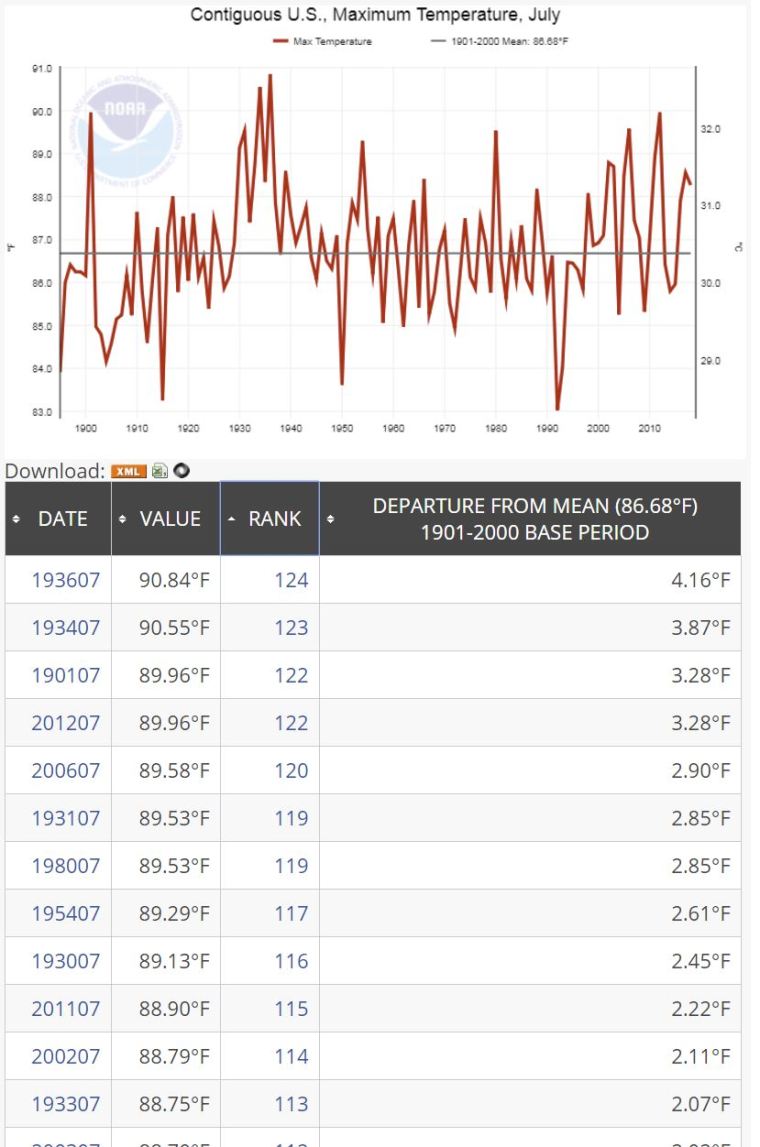
July 2018 USA – 1936, 1934 and 1901 (tied with 2012) Are Still the Hottest (Maximum) in USA.
2018 is 19th. I’m using Maximum Temperature. Not Average.
July 2018 USA – 1936, 1934 and 1901 (tied with 2012) Are Still the Hottest (Maximum) in USA.
2018 is 19th. I’m using Maximum Temperature. Not Average.
I posted some data about temperatures in Edmonton and Alberta. I wanted to visualize it. So I’ve made a grid.
The source of the data is Environment Canadas monthly summaries.
I’m using Tmax, not Tmean. (The logic being that max temps are the problem)
And I’m starting with the July only average for the decade. (I’ll expand in later posts).
There are 1087 stations with July data in Alberta.
I’m narrowing it down to stations with 25 years of data and data all the way up to 2017 and 80% complate.
Things to note:
Only 29 stations make the cut. Only 1 station has the 2010s as the decade with the hottest July average Tmax.
Only 2 stations have data from the 1940s (none before that).
So … AGW ain’t going to kill Albertans in July. They already survived July in the 2000s.
And there isn’t any stations with old and new data. (By that I mean the 30s).
| Station |
Station No |
Records | Min Year | Max Year | pct of data | 2010s | 2000s | 1990s | 1980s | 1970s | 1960s | 1950s | 1940s | 1930s | 1920s | 1910s | 1900s | 1890s | 1880s |
| KANANASKIS | 3053600 | 77 | 1940 | 2017 | 98.7 | 30.4 | 31.1 | 28.3 | 30.1 | 29.3 | 28.8 | 29.3 | 29.9 | – | – | – | – | – | – |
| CAMROSE | 3011240 | 70 | 1946 | 2017 | 97.2 | 29.9 | 31.6 | 28.7 | 30 | 29.1 | 31.1 | 31.2 | 30.9 | – | – | – | – | – | – |
| COLD LAKE A | 3081680 | 65 | 1953 | 2017 | 100 | 30.2 | 31.2 | 29.8 | 30 | 29.3 | 31.4 | 30.9 | – | – | – | – | – | – | – |
| FORT SASKATCHEWAN | 3012710 | 58 | 1958 | 2017 | 96.7 | 31.4 | 32 | 29 | 30.3 | 29.9 | 31.6 | 33.9 | – | – | – | – | – | – | – |
| CRAIGMYLE | 3021940 | 52 | 1960 | 2017 | 89.7 | 31.8 | 33.5 | 30.3 | 32.8 | 32.6 | 32.7 | – | – | – | – | – | – | – | – |
| EDMONTON STONY PLAIN | 301222F | 52 | 1966 | 2017 | 100 | 29.8 | 30.8 | 27.8 | 29.2 | 28.4 | 28.6 | – | – | – | – | – | – | – | – |
| QUEENSTOWN | 3035340 | 51 | 1967 | 2017 | 100 | 31.9 | 33.3 | 31.4 | 33.8 | 34.2 | 32.2 | – | – | – | – | – | – | – | – |
| FORESTBURG PLANT SITE | 3012652 | 50 | 1968 | 2017 | 100 | 31.7 | 34 | 30.9 | 32.6 | 31.8 | 31.7 | – | – | – | – | – | – | – | – |
| HIGH LEVEL A | 3073146 | 47 | 1971 | 2017 | 100 | 30.9 | 29.9 | 29.7 | 29.8 | 29.2 | – | – | – | – | – | – | – | – | – |
| SIMONETTE | 3075937 | 44 | 1974 | 2017 | 100 | 28.9 | 30 | 29.1 | 29.3 | 28.6 | – | – | – | – | – | – | – | – | – |
| VEGREVILLE | 3016GF0 | 37 | 1981 | 2017 | 100 | 30.7 | 31.3 | 29.7 | 30.3 | – | – | – | – | – | – | – | – | – | – |
| FABYAN | 3012515 | 36 | 1981 | 2017 | 97.3 | 29.9 | 32.2 | 29.7 | 31.9 | – | – | – | – | – | – | – | – | – | – |
| LLOYDMINSTER A | 3013961 | 36 | 1982 | 2017 | 100 | 29.4 | 31.6 | 29.6 | 31.7 | – | – | – | – | – | – | – | – | – | – |
| ELK ISLAND NAT PARK | 3012275 | 33 | 1982 | 2017 | 91.7 | 30.8 | 31.3 | 29.9 | 29.4 | – | – | – | – | – | – | – | – | – | – |
| BRULE BLACK CAT | 3060903 | 31 | 1987 | 2017 | 100 | 30.7 | 31 | 28.8 | 29.8 | – | – | – | – | – | – | – | – | – | – |
| PICTURE BUTTE WEST | 303N1G3 | 31 | 1987 | 2017 | 100 | 33.6 | 34.6 | 31.3 | 33.2 | – | – | – | – | – | – | – | – | – | – |
| ENTWISTLE | 3062451 | 30 | 1988 | 2017 | 100 | 29.9 | 31.3 | 29.1 | 29.8 | – | – | – | – | – | – | – | – | – | – |
| UNIVERSITY OF ALBERTA METABOLIC CENTRE | 301FFNJ | 30 | 1987 | 2017 | 96.8 | 31.8 | 32.2 | 29.5 | 30.8 | – | – | – | – | – | – | – | – | – | – |
| OKOTOKS | 303M9JM | 28 | 1990 | 2017 | 100 | 32.8 | 33.3 | 29.9 | – | – | – | – | – | – | – | – | – | – | – |
| BROOKS | 3030QLP | 26 | 1989 | 2017 | 89.7 | 33.3 | 35 | 33.2 | 34 | – | – | – | – | – | – | – | – | – | – |
| BOW ISLAND | 3030768 | 25 | 1993 | 2017 | 100 | 33.7 | 34.3 | 31.6 | – | – | – | – | – | – | – | – | – | – | – |
| BOW VALLEY | 3050778 | 25 | 1993 | 2017 | 100 | 32.1 | 32.2 | 29.1 | – | – | – | – | – | – | – | – | – | – | – |
| COP UPPER | 3031875 | 25 | 1993 | 2017 | 100 | 31.1 | 31.3 | 28.5 | – | – | – | – | – | – | – | – | – | – | – |
| CROWSNEST | 3051R4R | 25 | 1993 | 2017 | 100 | 31 | 32 | 29.1 | – | – | – | – | – | – | – | – | – | – | – |
| ESTHER 1 | 301B460 | 25 | 1993 | 2017 | 100 | 32.9 | 34.8 | 32.3 | – | – | – | – | – | – | – | – | – | – | – |
| LACOMBE CDA 2 | 3023722 | 25 | 1993 | 2017 | 100 | 30.1 | 31.3 | 28.4 | – | – | – | – | – | – | – | – | – | – | – |
| SUNDRE A | 3026KNQ | 25 | 1993 | 2017 | 100 | 30.6 | 31.1 | 28.5 | – | – | – | – | – | – | – | – | – | – | – |
| THREE HILLS | 3026479 | 25 | 1993 | 2017 | 100 | 30.7 | 32.5 | 29.9 | – | – | – | – | – | – | – | – | – | – | – |
| VAUXHALL CDA CS | 3036682 | 25 | 1993 | 2017 | 100 | 33.6 | 34.8 | 32.8 | – | – | – | – | – | – | – | – | – | – | – |
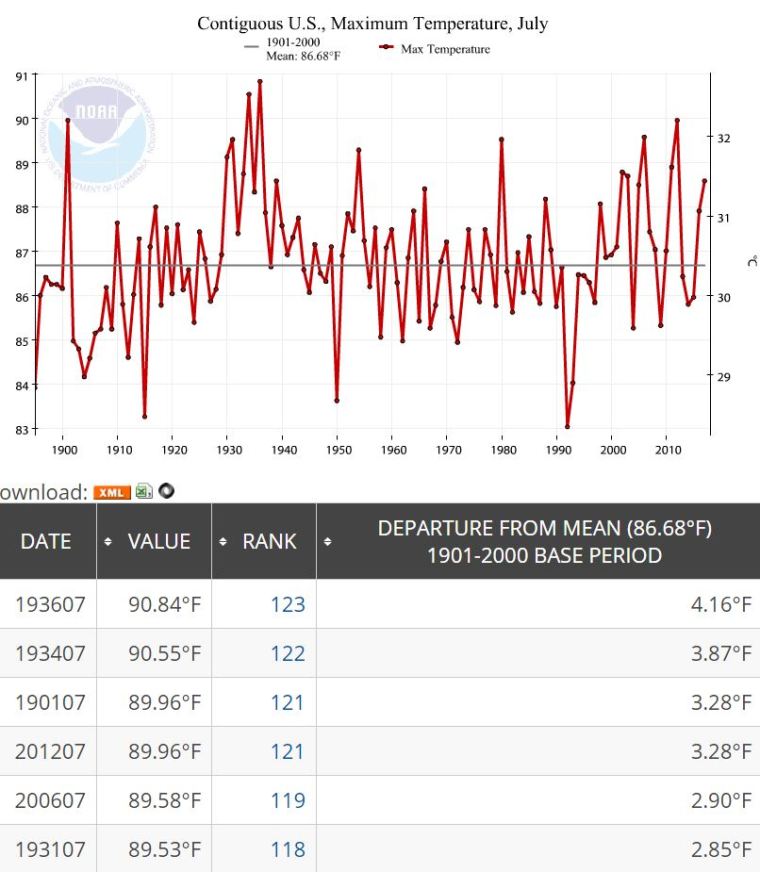
July USA – 1936, 1934 and 1901 (tied with 2012) Are Still the Hottest (Maximum) in USA.
Correction: 2017 is 15th. 2017 is tied for 14th.
Clarification: I’m using Maximum Temperature. Not Average.
Using Environment Canada monthly summaries, Woodstock Ontario had the coldest average Tmax for July since 1872 (which is when the data starts).
Warm July’s seem kind of cyclic too on this graph.
This graph is just July’s monthly anomaly from the 1981-2010 average.

Nick Stoke and Zeke Hausfather don’t like my graphs showing a difference between Estimated (infilled) and non-Estimated (not infilled) USHCN data
Nick said:
“The difference between average estimated and average non-estimated, doesn’t reflect estimation. It just reflects changes in the kind of stations that were being estimated.
For some reason, they were more likely to be warmer. I don’t know why, but they were. It’s just the wrong way to do it.”
I’m not sure I believe in coincidences.
I believe Nick and Zeke both created an anomaly baseline for each month for each station. Nick used 1900 to 2013. Zeke said he used 1961-1990.
Neither of them added trend lines.
I believe both used all the data (infilled and non-infilled). (As of my posting this they had not confirmed). I disagree with that. Infilled data should not be used in the baseline.
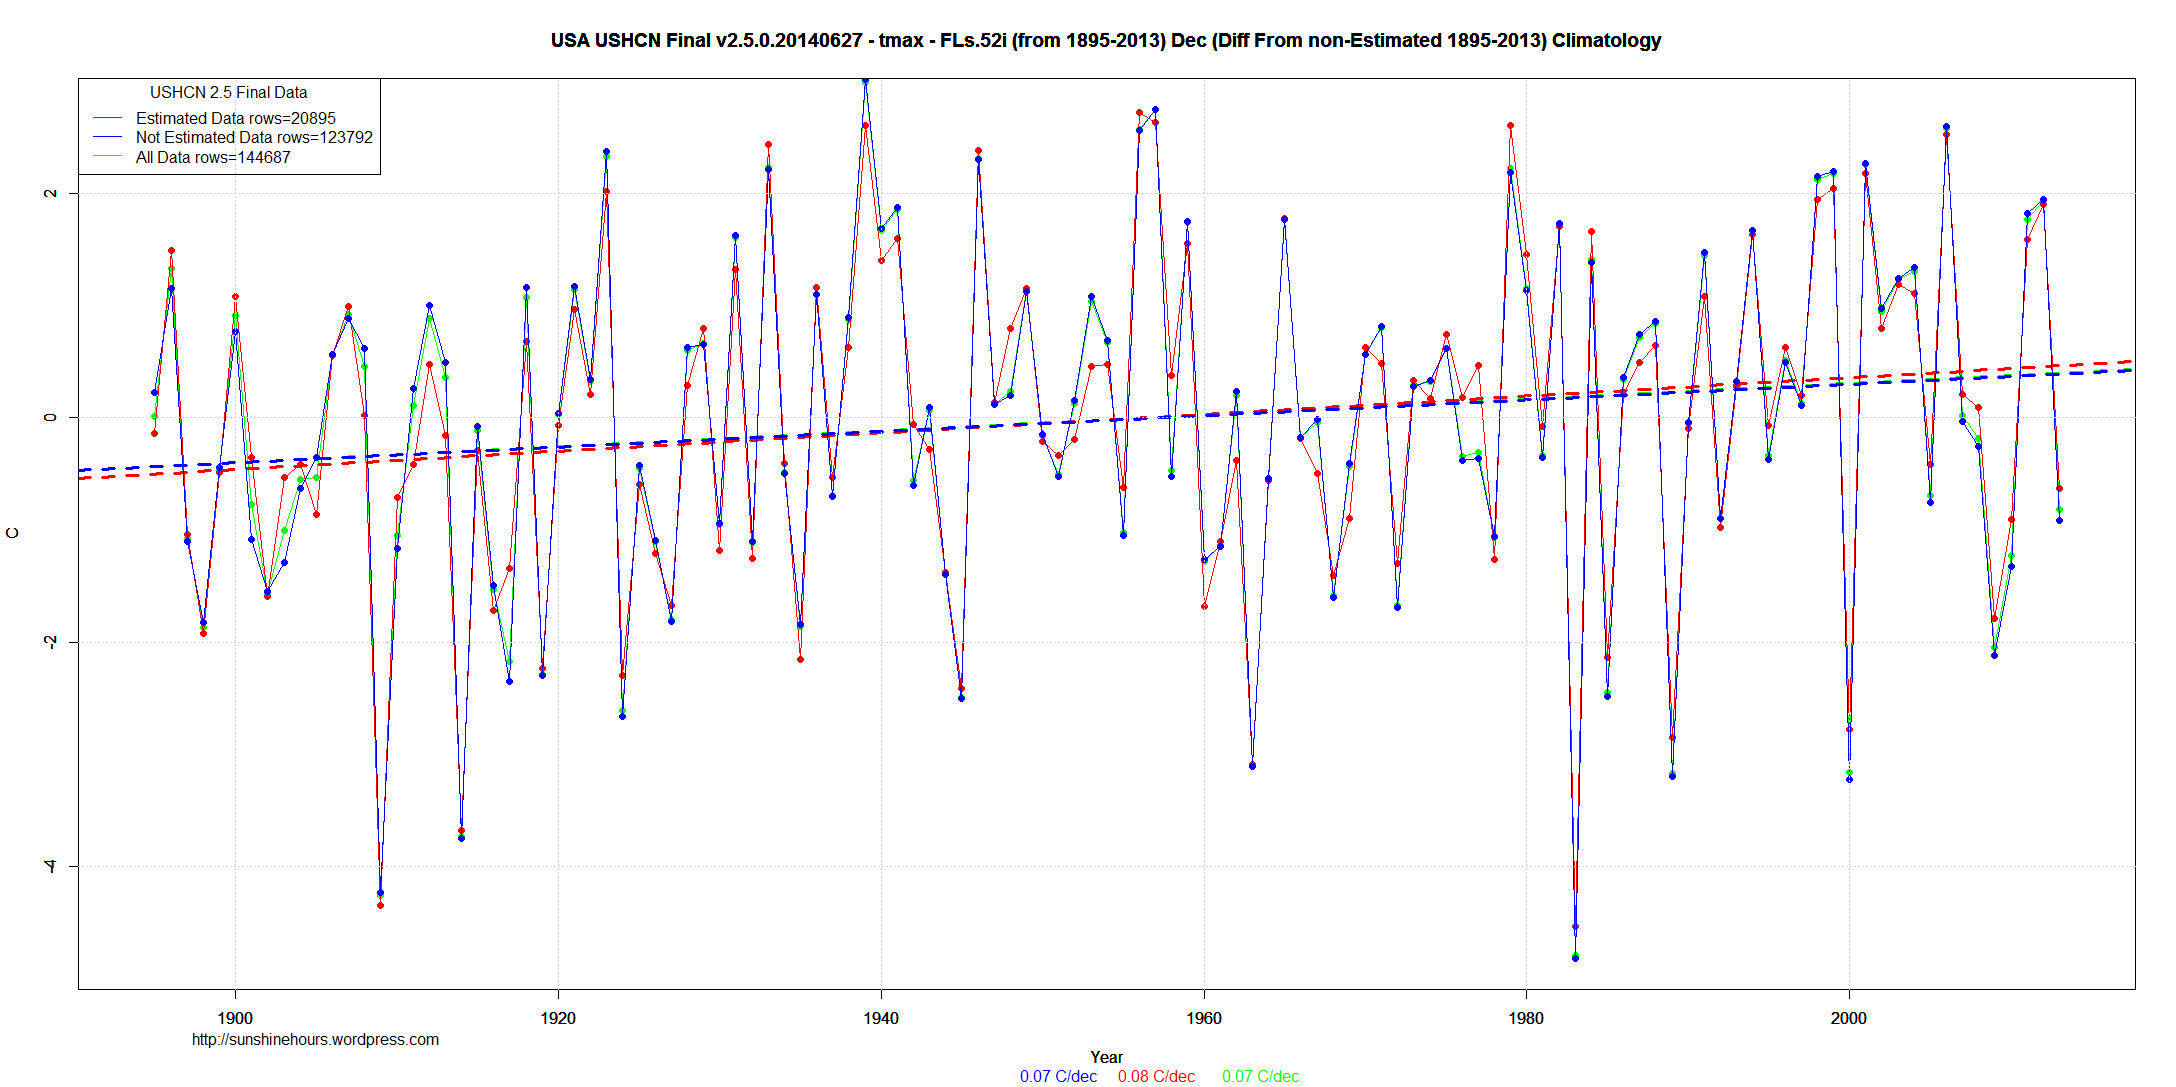
As an example of what infilling does using the difference by station from the 1895-2013 baseline here is Dec 1998 to 2013 Tmax.
In this case, the real data had a downwards trend of -0.82C/decade and the infilled data was -0.64C/decade which is .18C/decade higher not because infilled data was hotter, but because it was less cold.
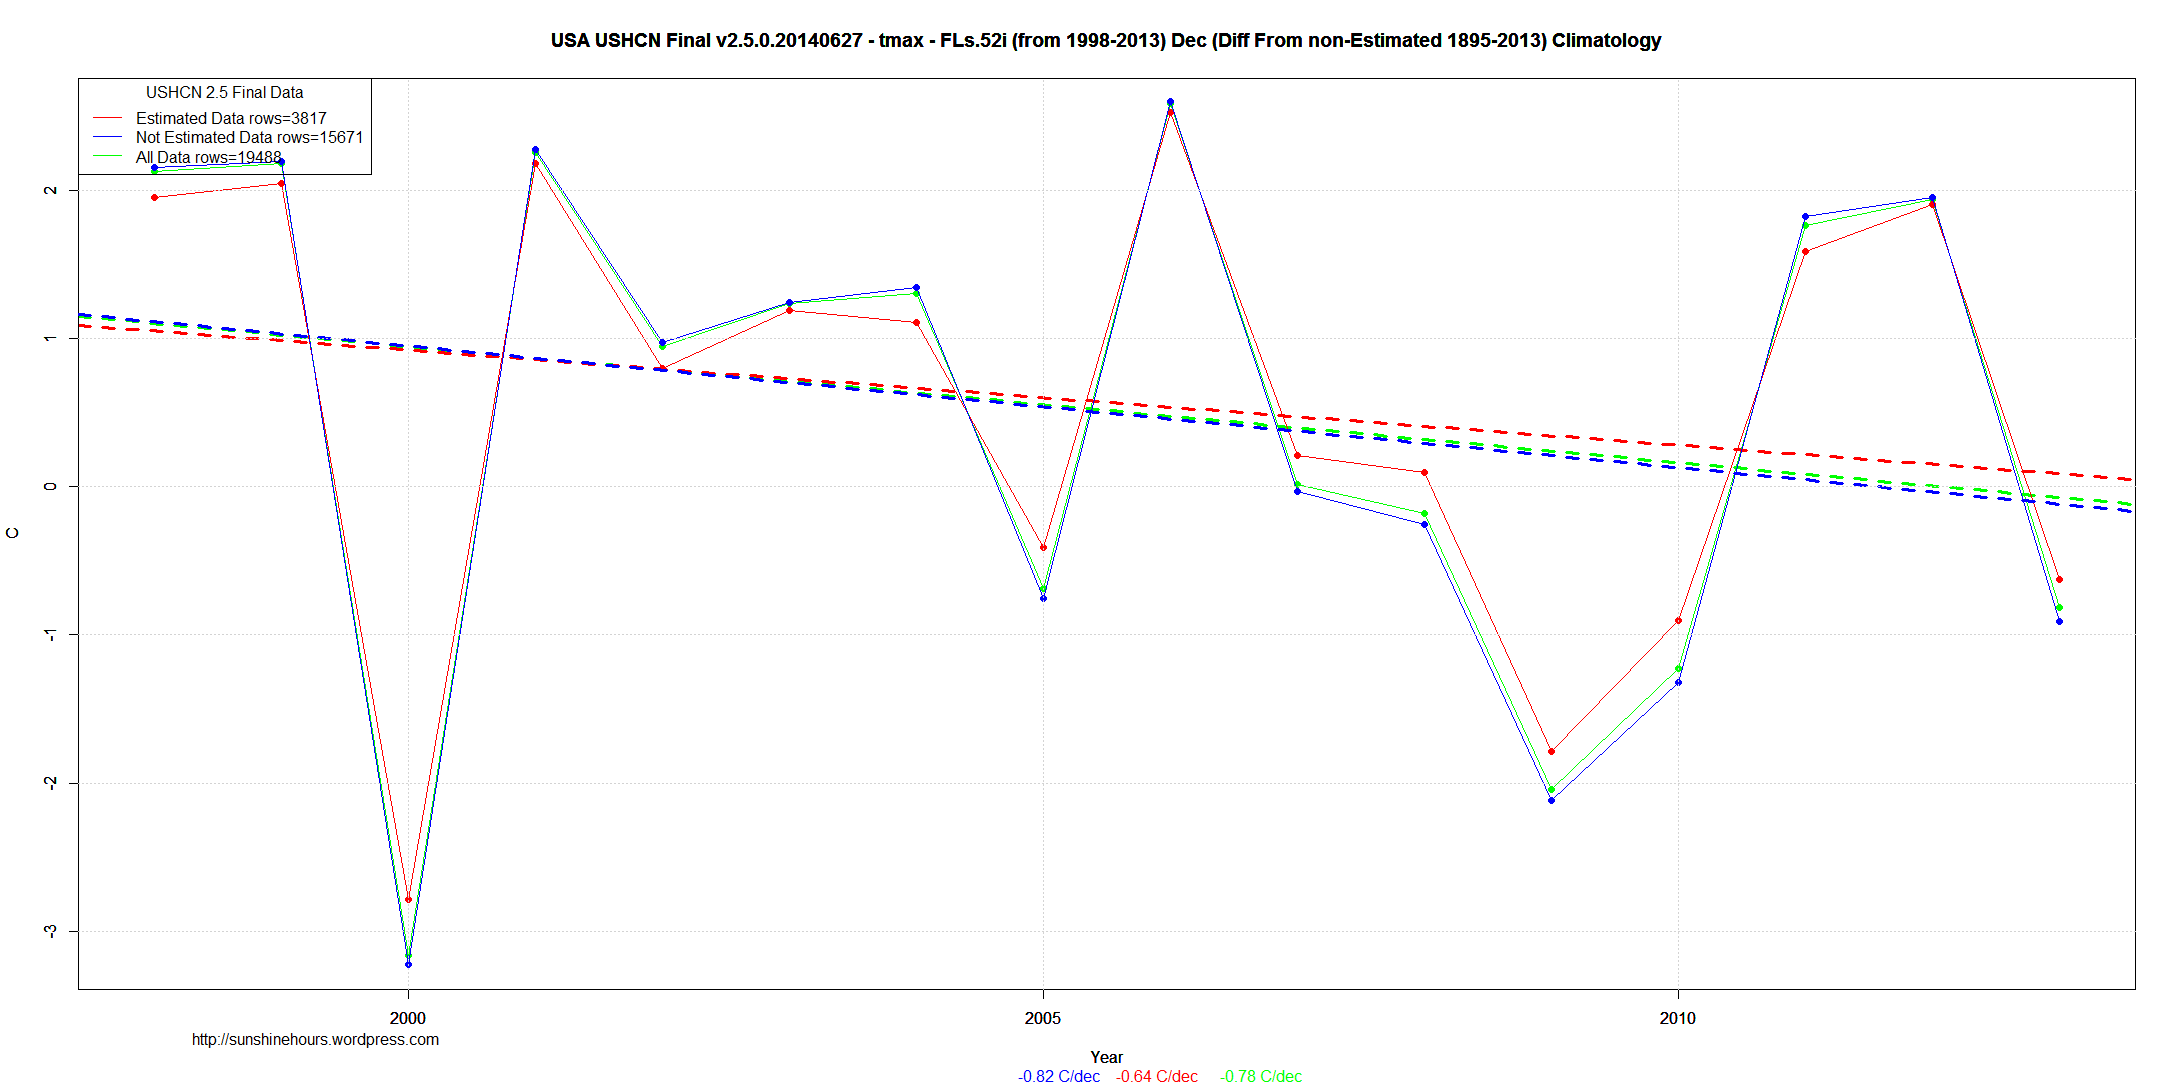
From 1895 to 2013 the infilled trend is consistently .02C/decade to .03C/decade higher than the non-infilled trend.
The red dots are higher on the 1980 and later side of the graph while they are lower on the pre-1960 part of the graph.
Cooling the past, warming the present.
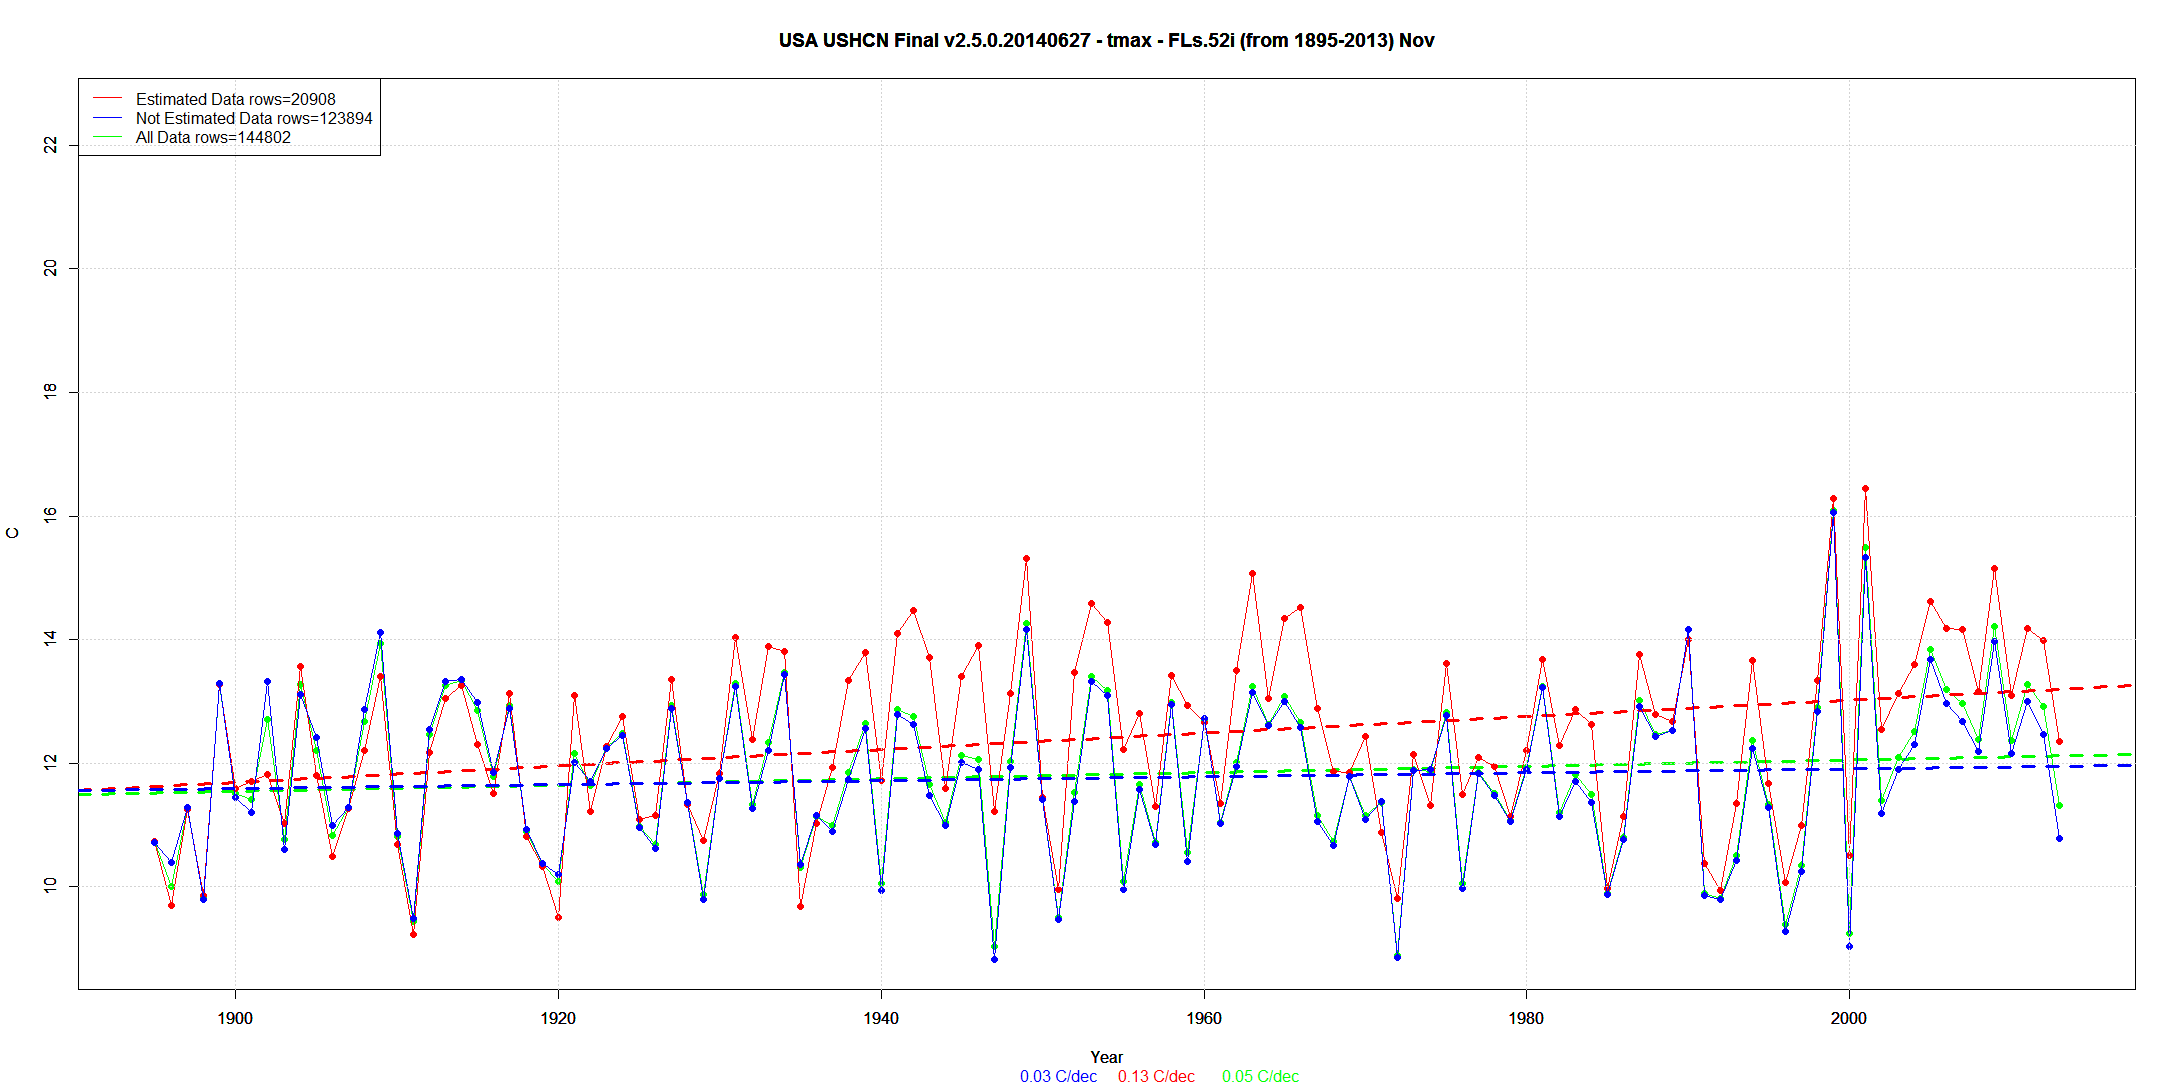
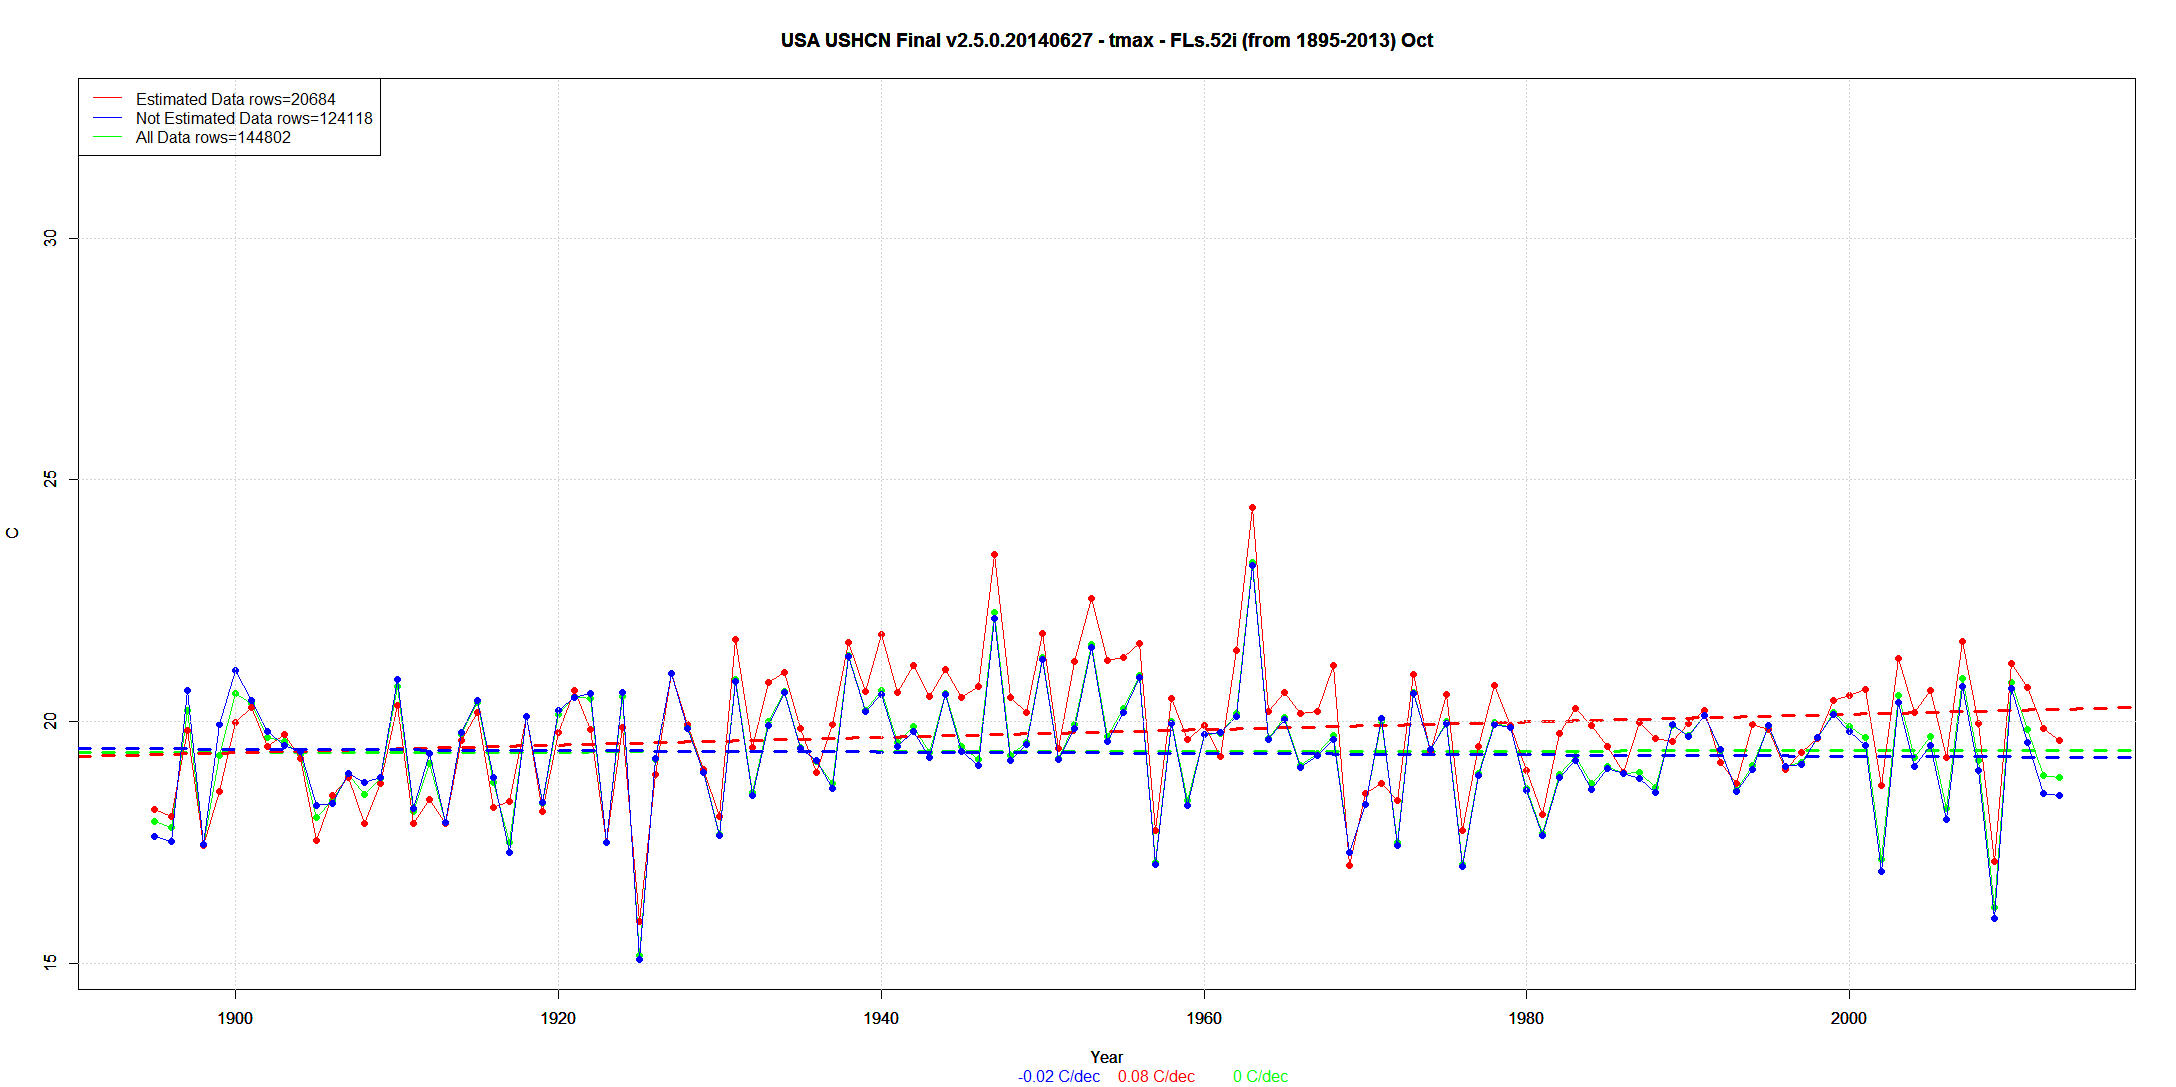
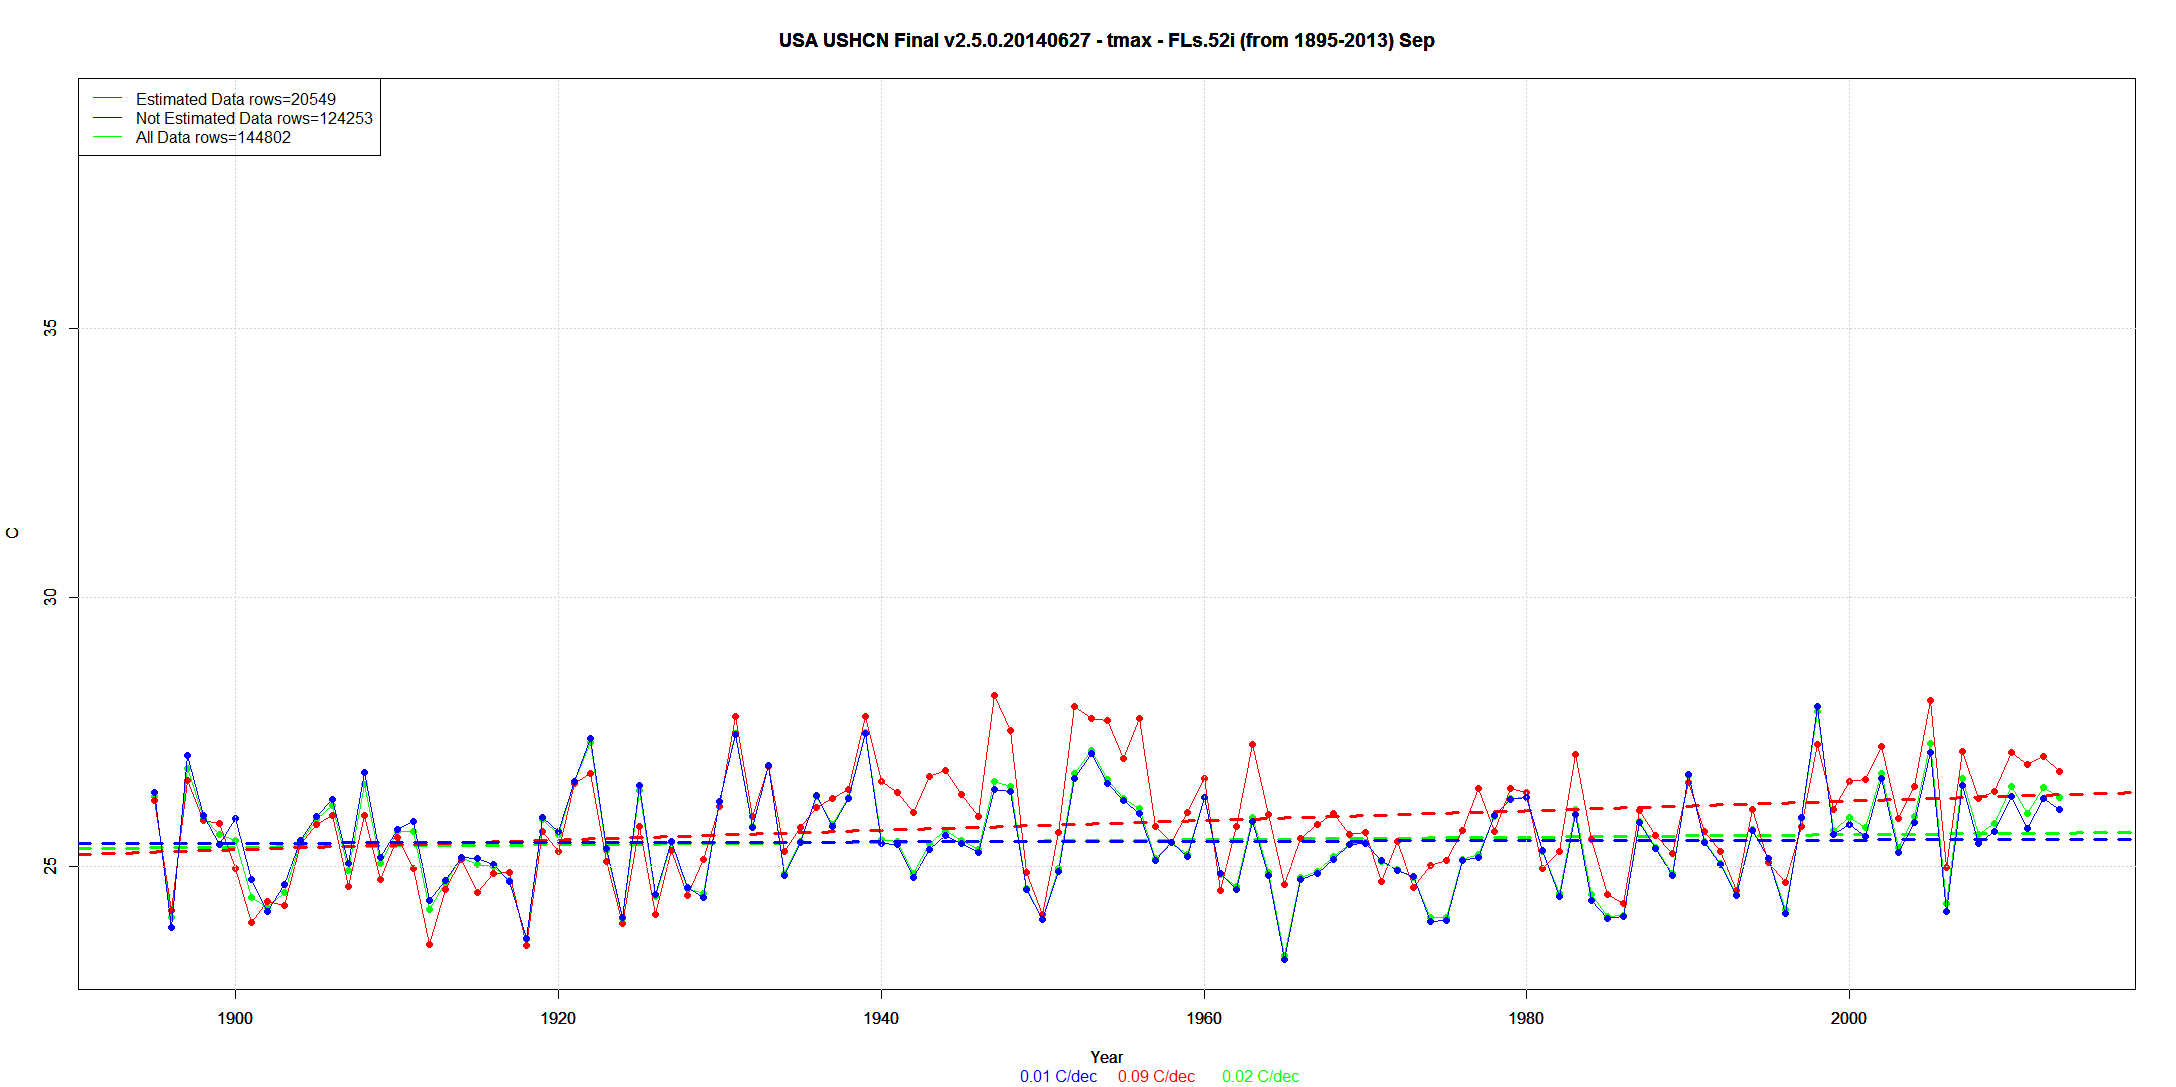
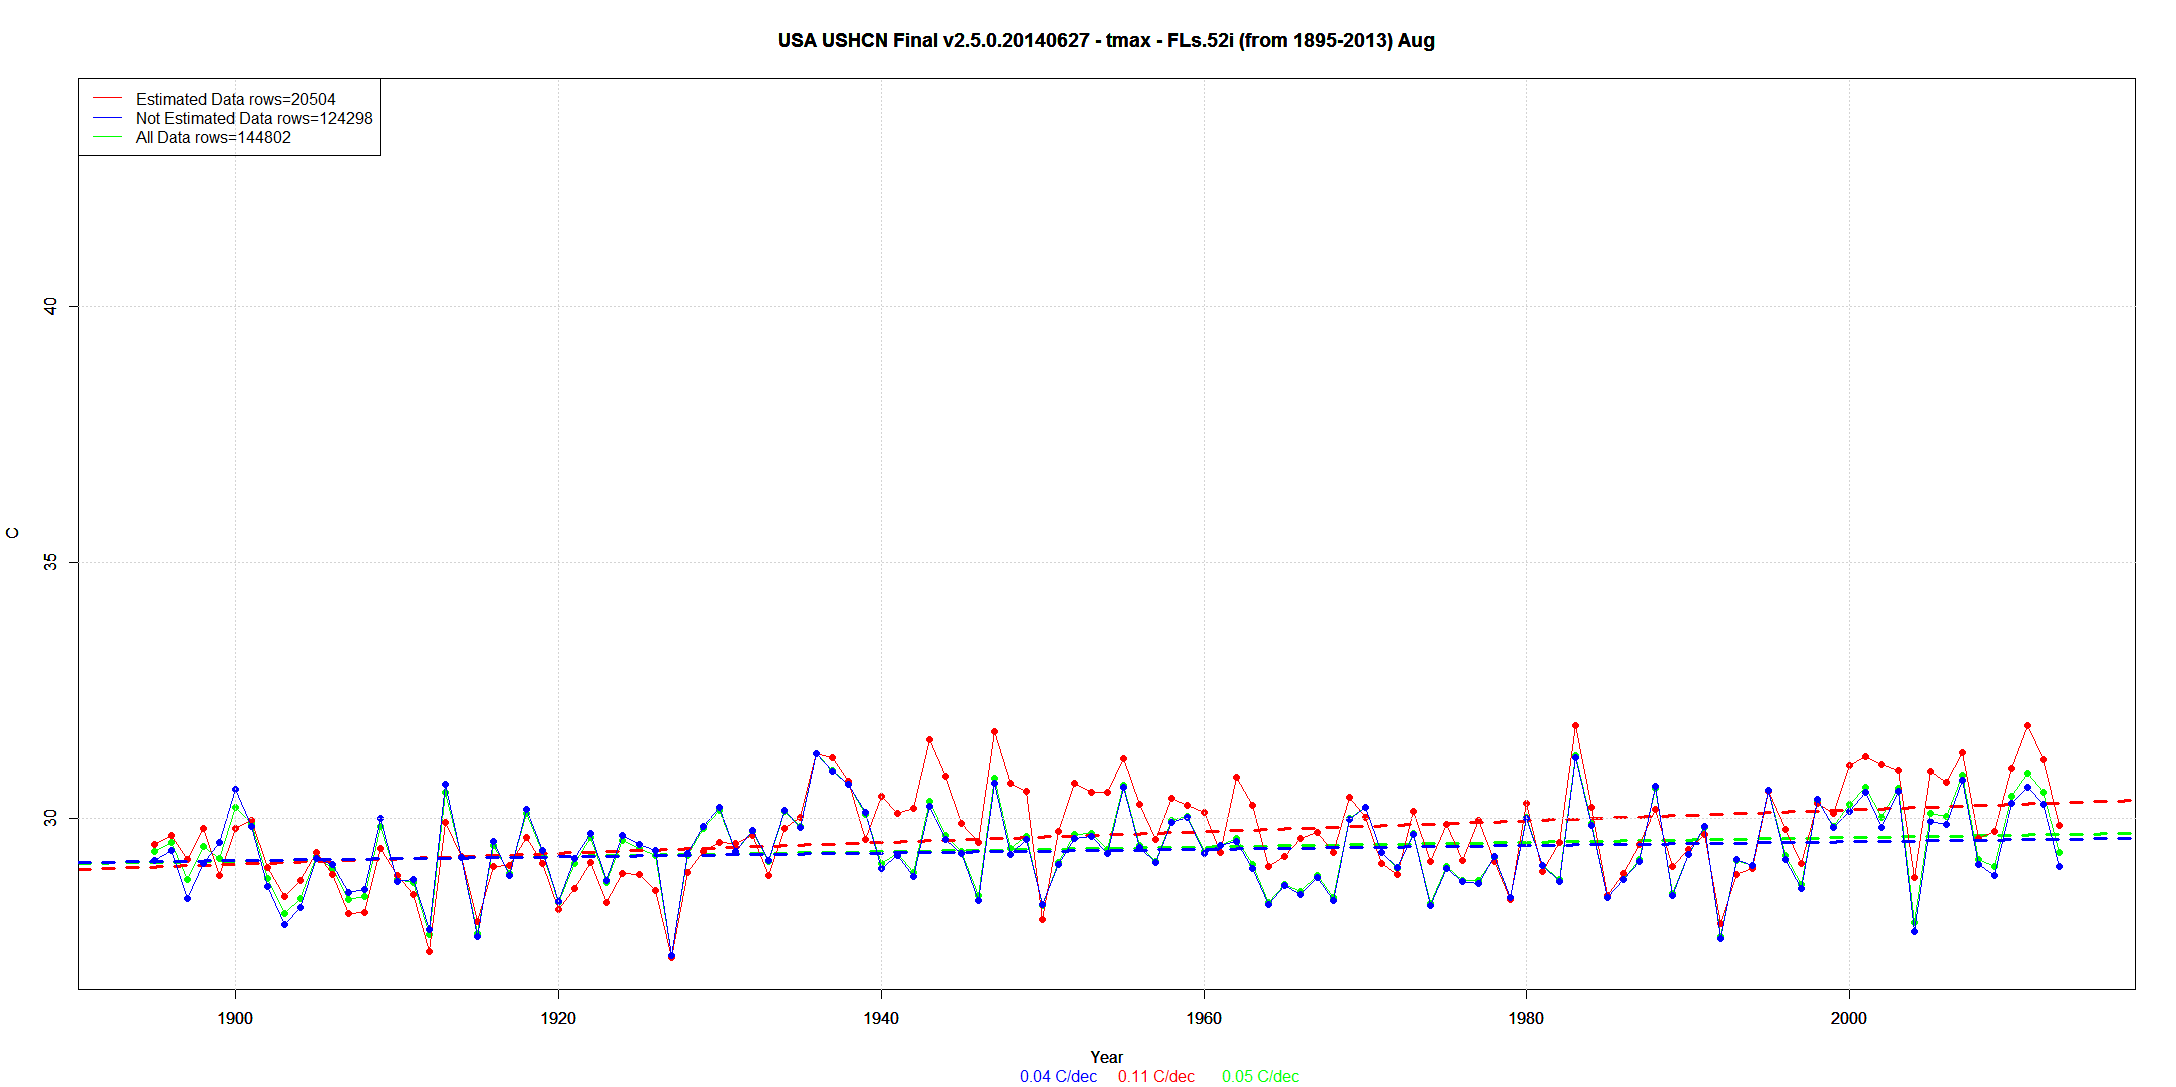
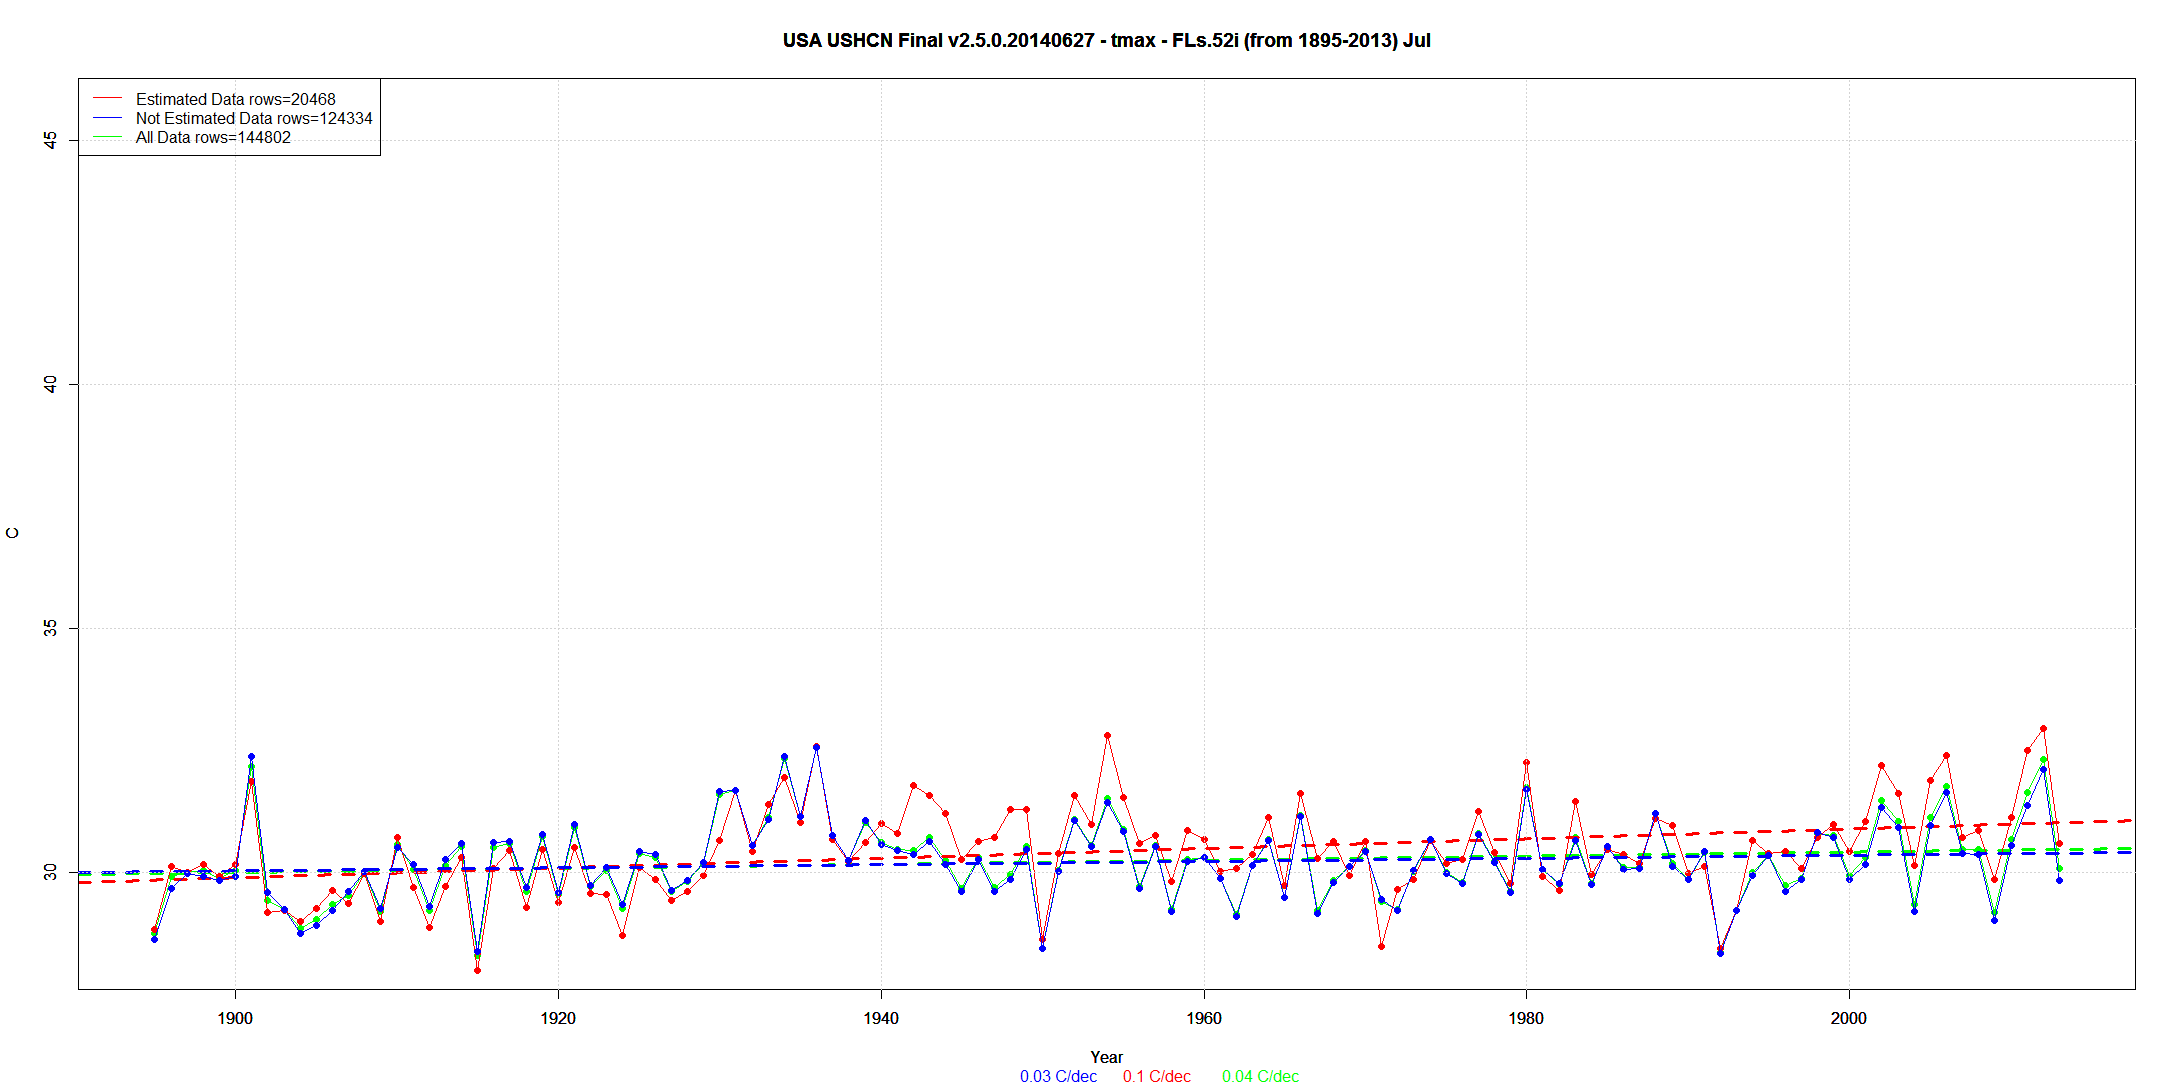
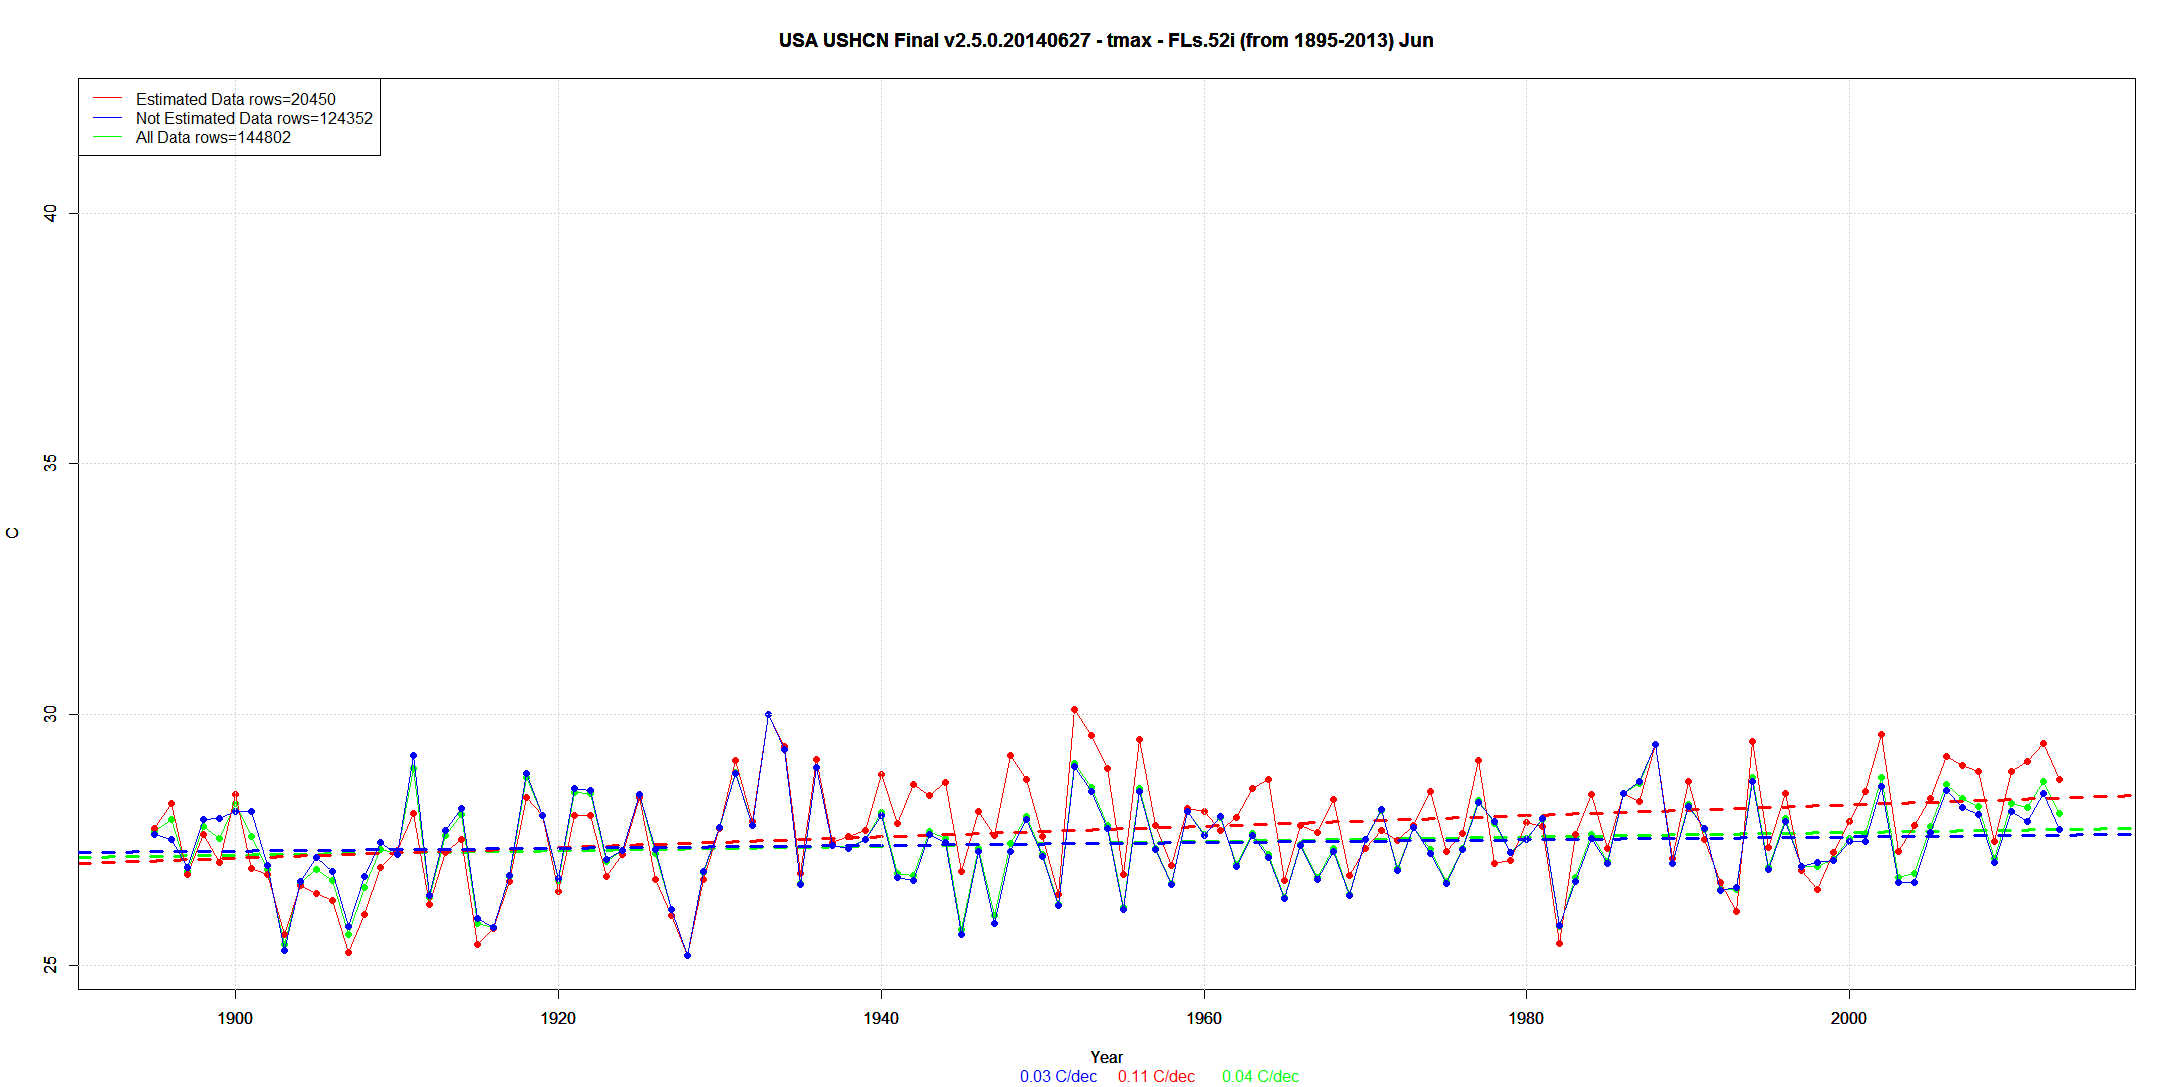
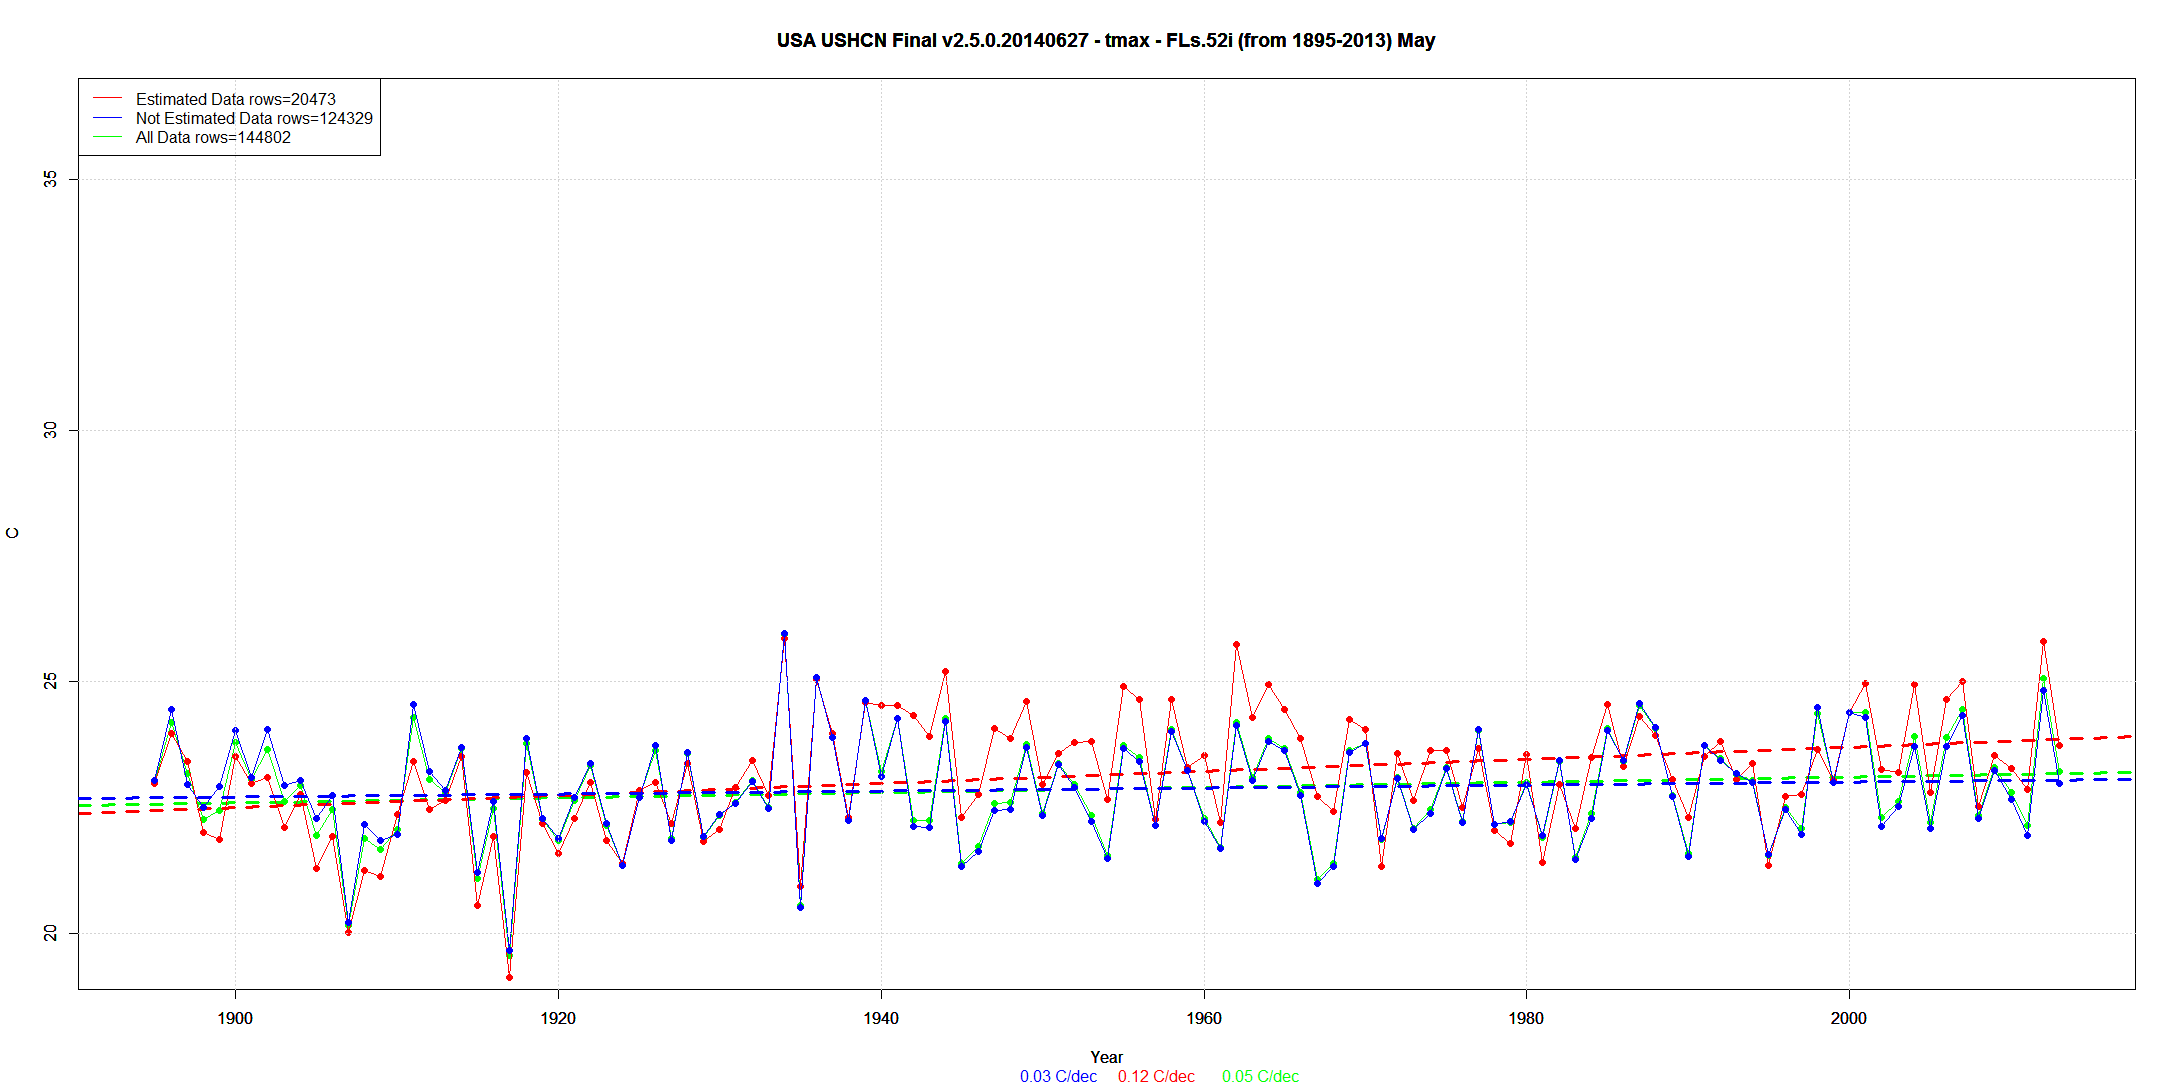
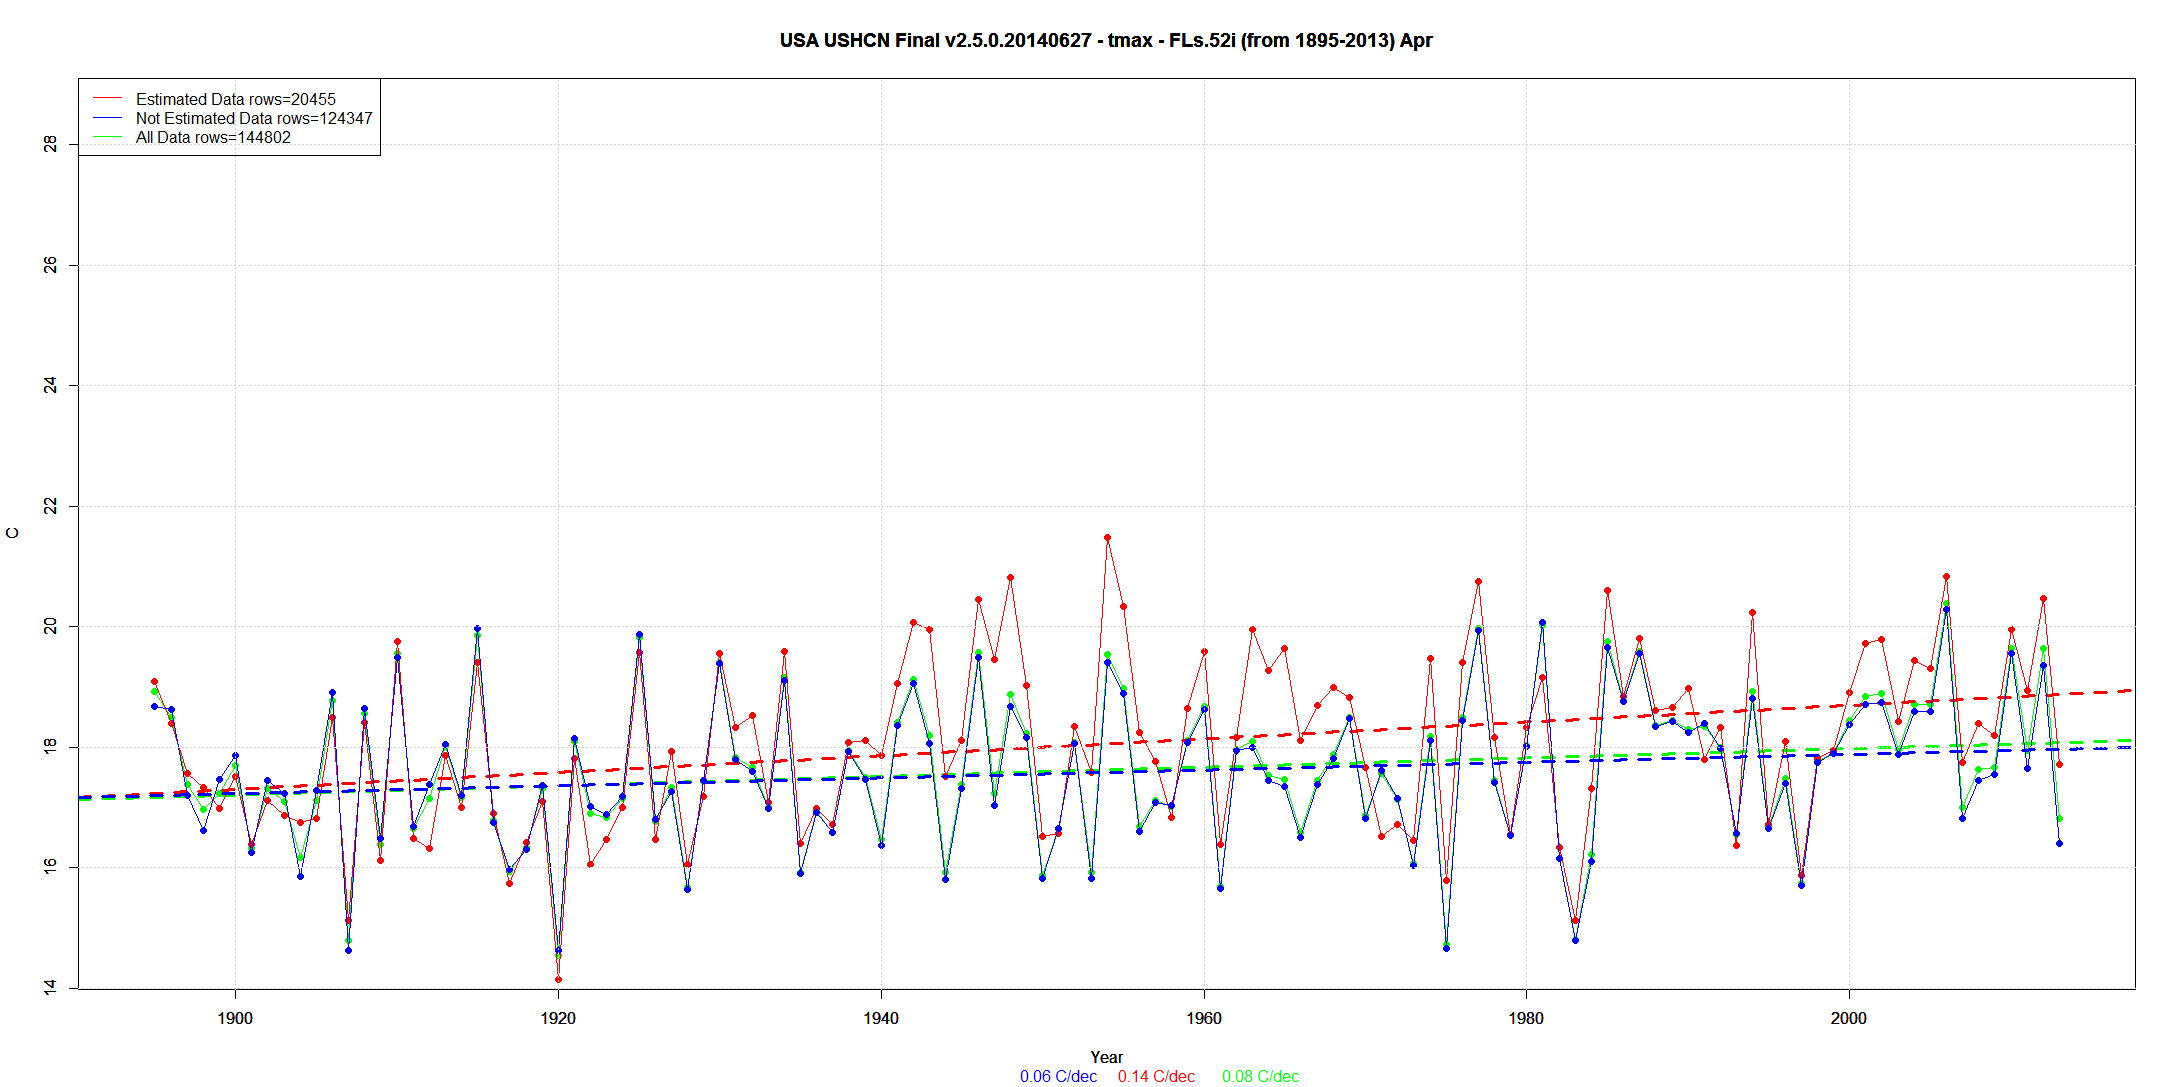
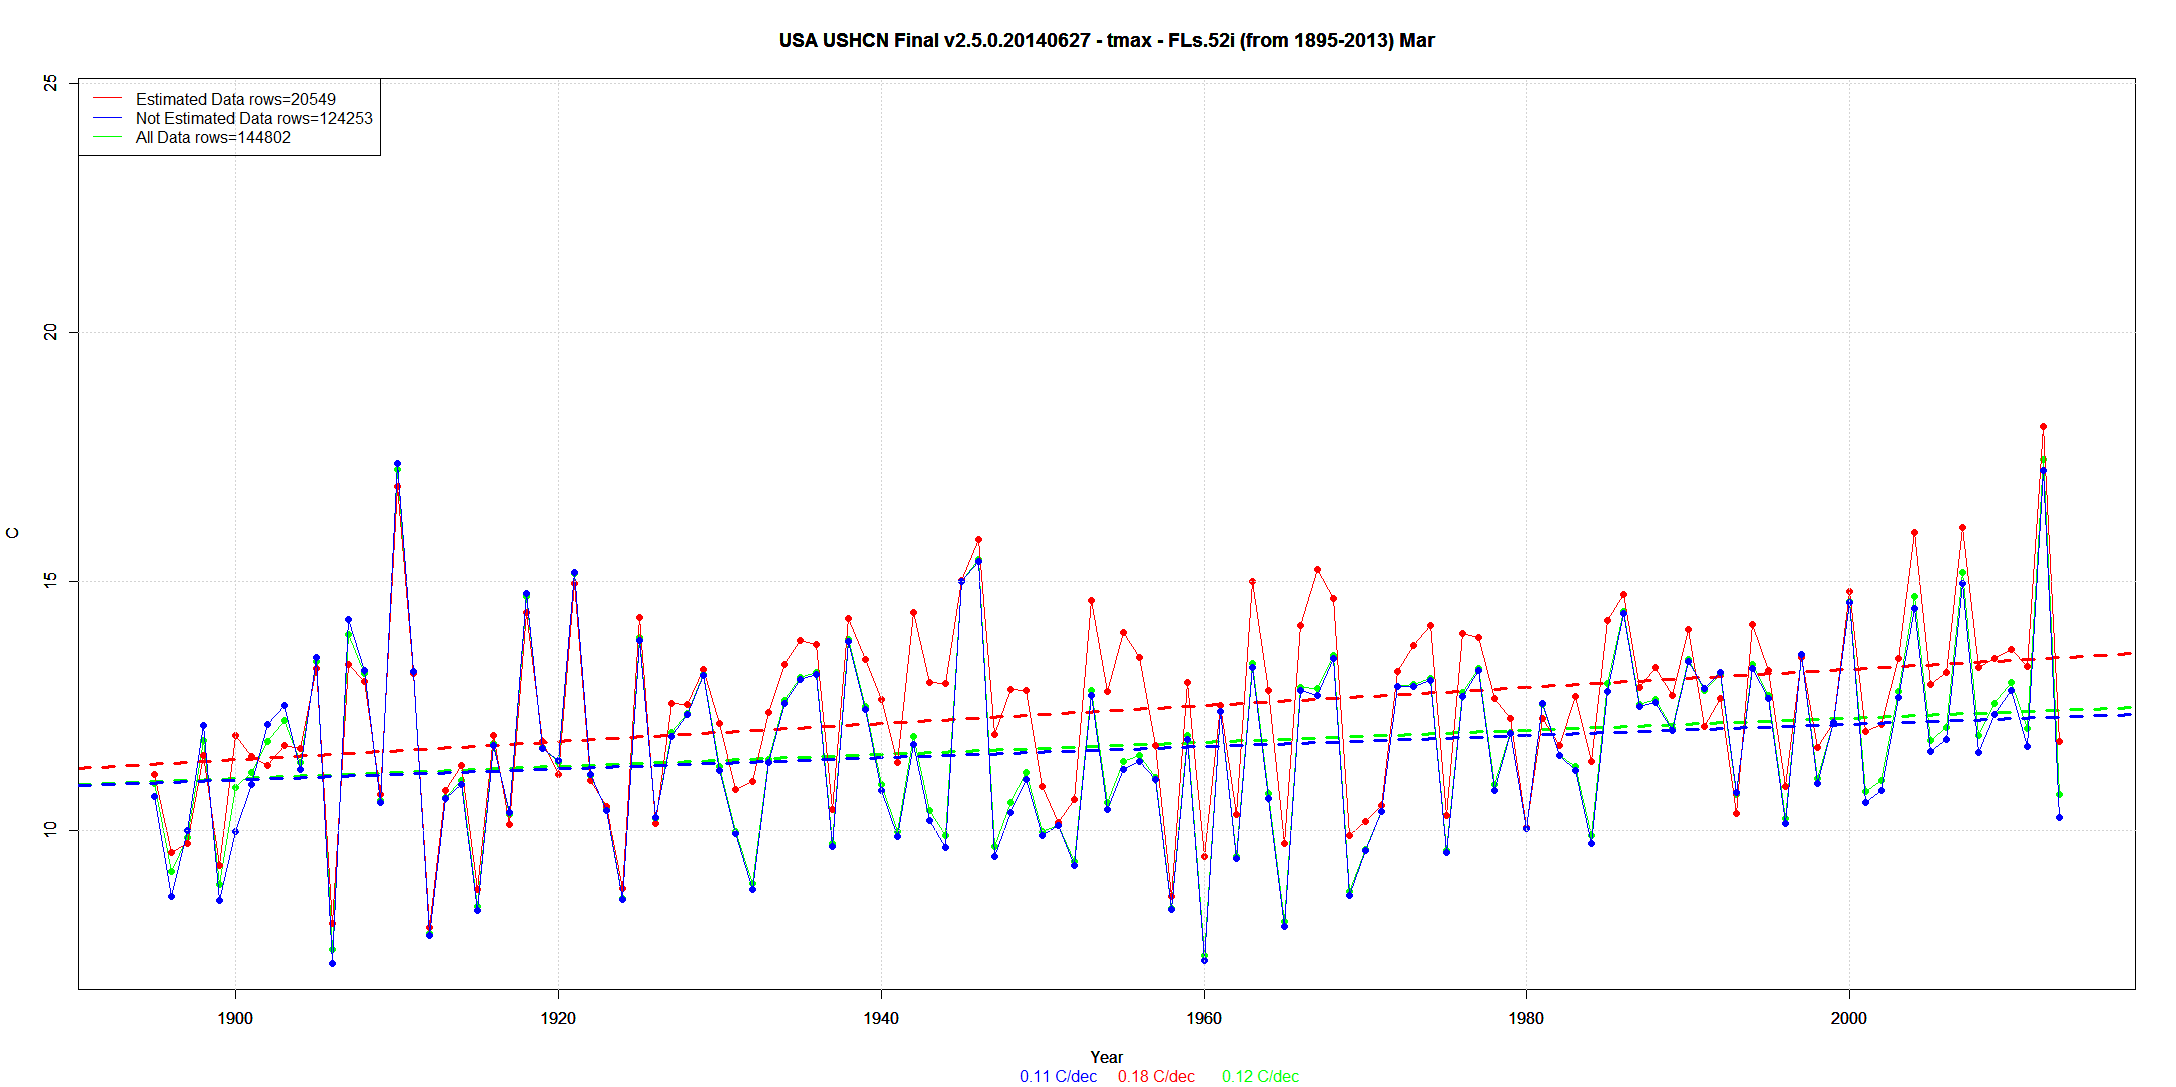
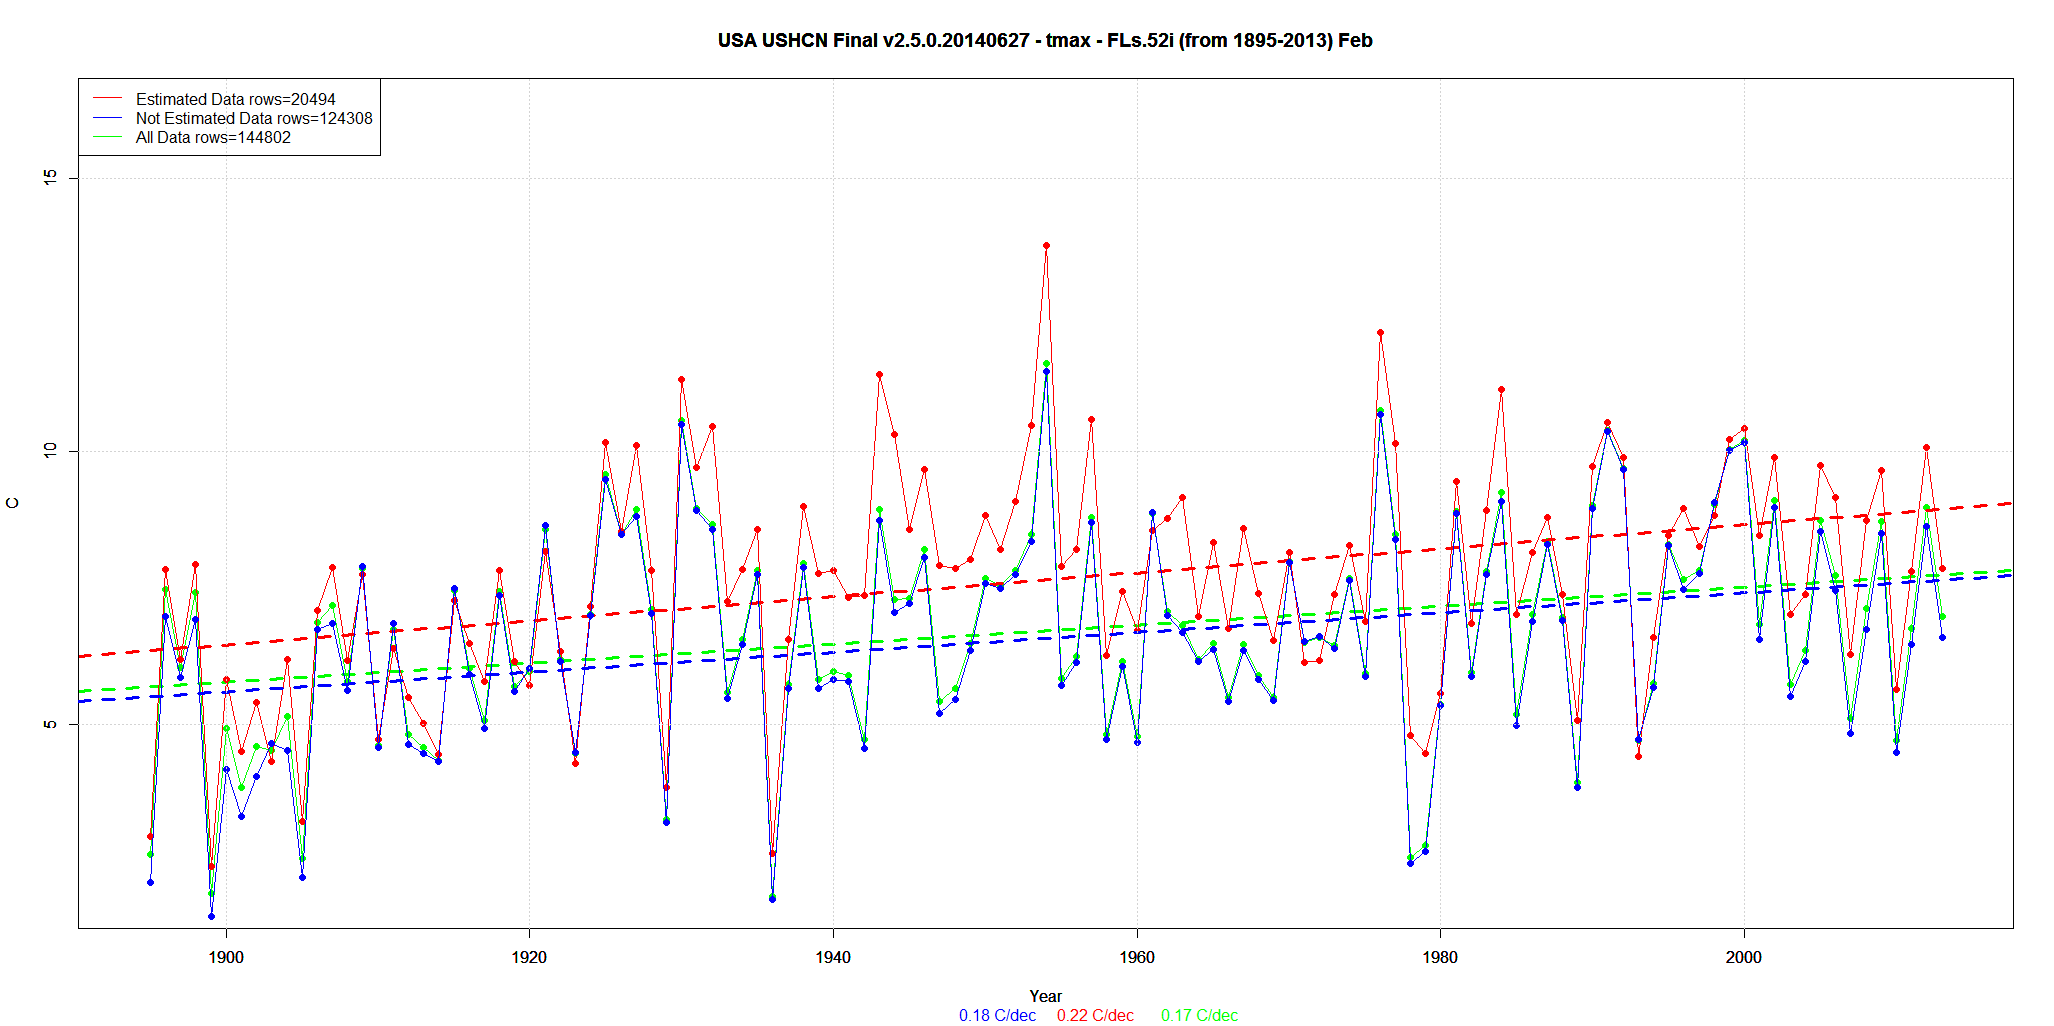
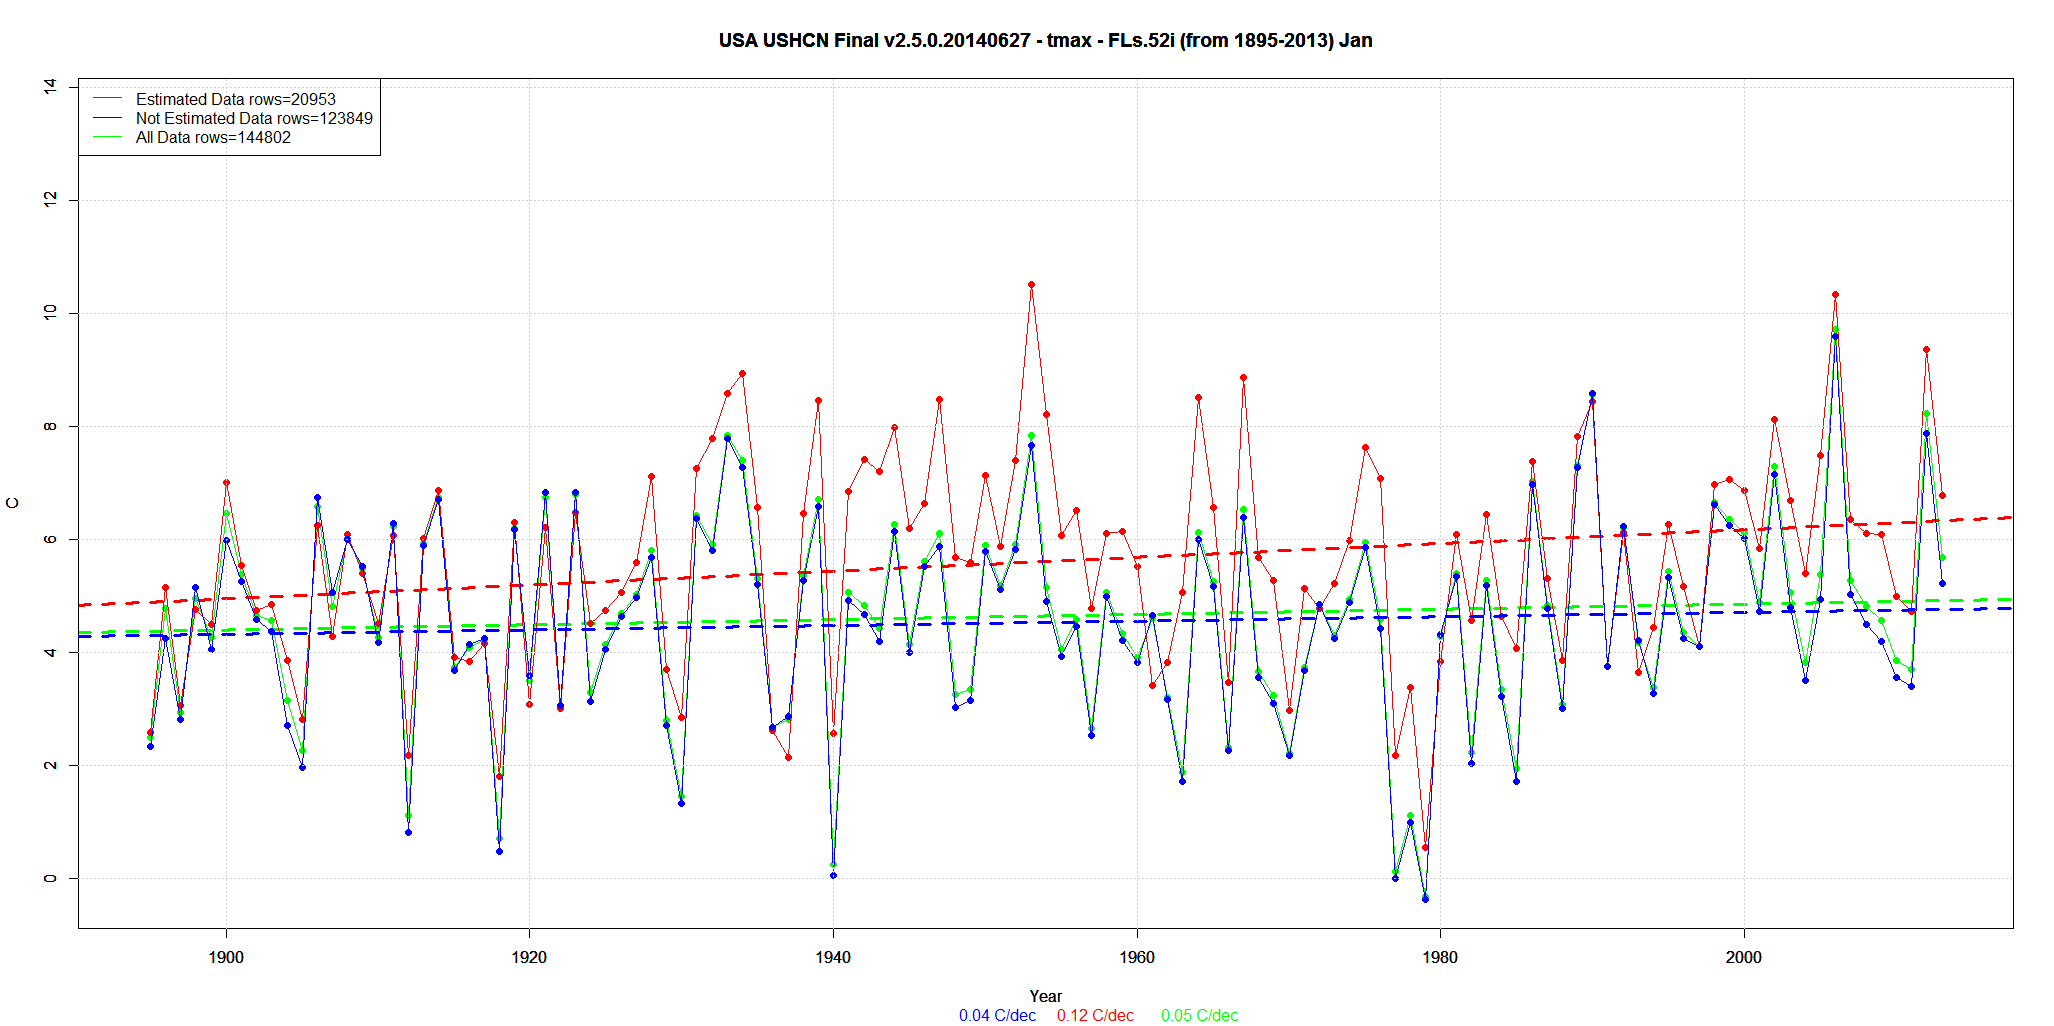
Zeke has an post over at Judith Curry’s blog where he makes a claim that “infill has no effect on CONUS-wide trends” (among other claims).
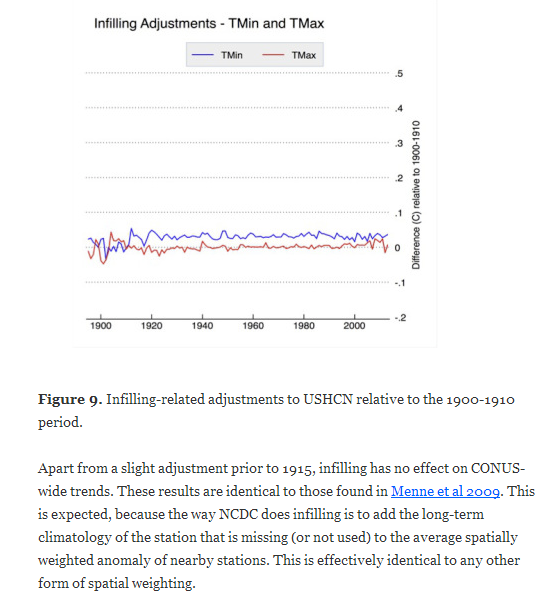
I disagree. Here are the 12 months comparing Estimated and Non-Estimated and then all the data. Blue = Final data (non-Estimated) Red = Final Data Estimated Green = All Final Data.
Infilling does change the trend. For example, Estimating changed the trend in Dec from .06C per decade to .07C per decade because the Estimated data had a trend of .15C/decade.

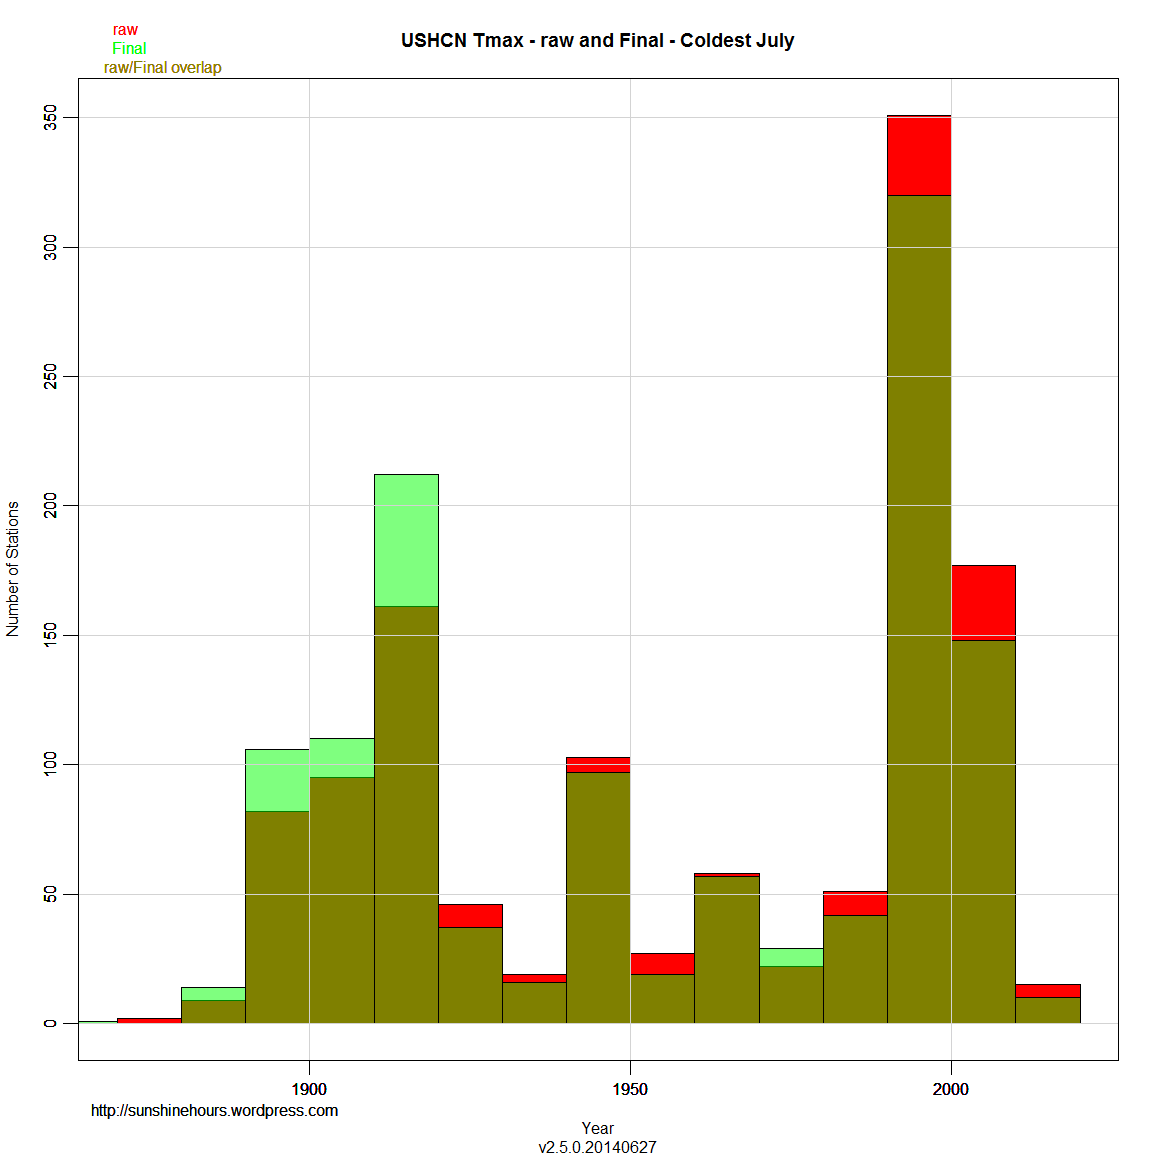
Yesterday I did a post looking at every station and finding out which year had the hottest July. Today I am showing you what effect the adjustments have.
I am using USHCN Final Tmax monthly data and comparing it to the raw data . From the file v2.5.0.20140627. (This is not necessarily all the data NOAA uses)
The format is a little different, but it is designed to allow easy comparison. Red is the raw data. Green is Final and muddy green is where raw and final overlap.
As you can see, the number of years near the present have a lot green. Which means the adjustments created more record hot years.
The 1910s to 1980s have red at the top which indicates raw data. Translation: More record July’s occurred in the past using raw data.
For the Coldest July data, the results are the opposite. Adjusting creates more colder July’s in the past and takes away cold July’s from the present.

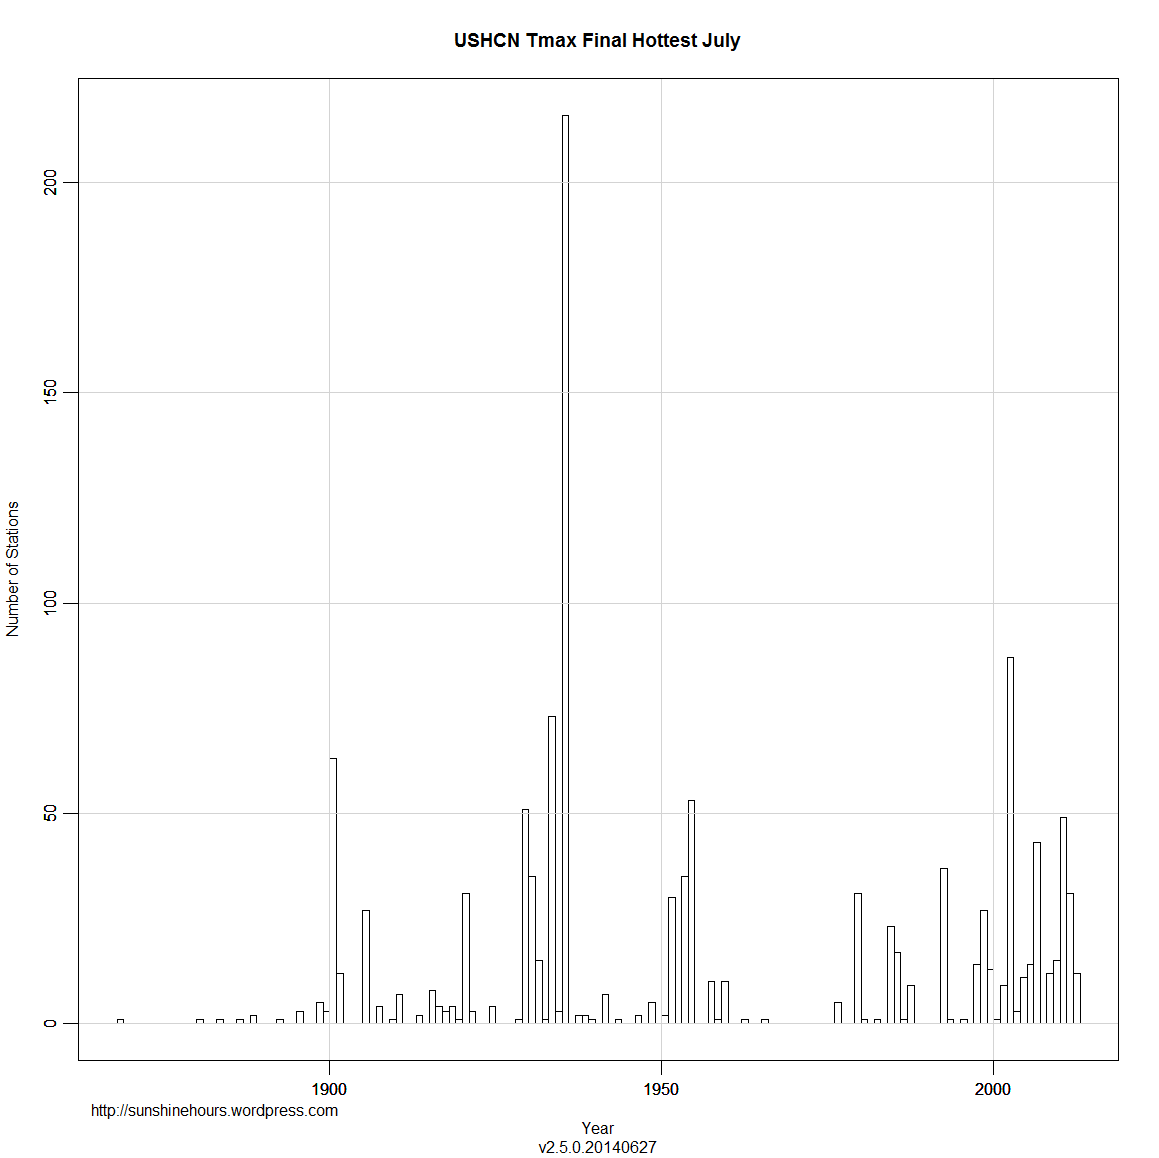
The other day I noted that NOAA had July 1936 back on top. Now don’t take this post as an endorsement of the adjustments and infilling, but I thought I would check which years did stations set their hottest July and coldest July.
I am using USHCN Final Tmax monhtly data . From the file v2.5.0.20140627. (This is not necessarily all the data NOAA uses)
I don’t think the histogram of the hottest July will actually be a surprise. 216 stations had their hottest July in 1936.
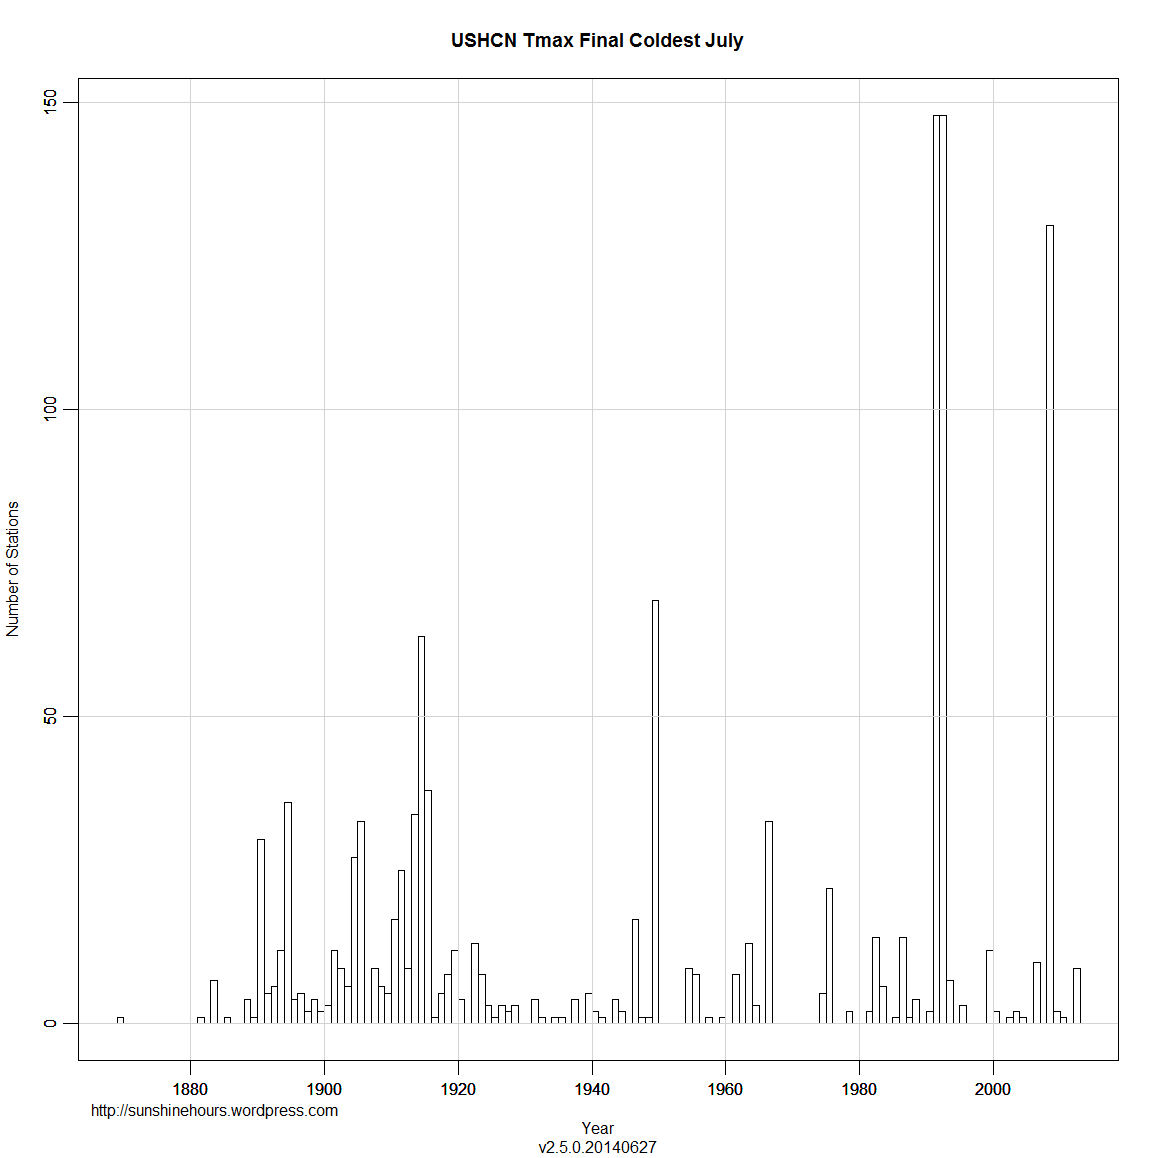
But the coldest July histogram will surprise you. 1992 and 1993 tied with 148 stations each having the coldest July. A small subset of the stations at bottom.
I just picked the top 15 stations with the coldest July in 1992 and the hottest July in 1936. There are 92. The temperatures are in Celsius.
| STATE | Station | NAME | Coldest_Year | Coldest_July | Hottest_Year | Hottest_July |
| IA | USH00130133 | ALGONA 3 W | 1992 | 23.22 | 1936 | 35.98 |
| IA | USH00131402 | CHARLES CITY | 1992 | 24.18 | 1936 | 34.5 |
| IA | USH00132724 | ESTHERVILLE 2 N | 1992 | 23.06 | 1936 | 35.82 |
| IA | USH00132977 | FOREST CITY 2 NNE | 1992 | 23.69 | 1936 | 35.72 |
| IA | USH00132999 | FORT DODGE 5NNW | 1992 | 24.73 | 1936 | 36.1 |
| IA | USH00134063 | INDIANOLA 2W | 1992 | 26.57 | 1936 | 37.13 |
| IA | USH00134894 | LOGAN | 1992 | 26.56 | 1936 | 39.88 |
| IA | USH00135952 | NEW HAMPTON | 1992 | 23.38 | 1936 | 35.31 |
| IA | USH00137147 | ROCK RAPIDS | 1992 | 23.96 | 1936 | 37.48 |
| IA | USH00137161 | ROCKWELL CITY | 1992 | 24.81 | 1936 | 36.69 |
| IA | USH00137979 | STORM LAKE 2 E | 1992 | 23.85 | 1936 | 36.54 |
| IA | USH00138296 | TOLEDO 3N | 1992 | 24.82 | 1936 | 35.34 |
| IL | USH00115326 | MARENGO | 1992 | 24.66 | 1936 | 33.89 |
| IL | USH00118916 | WALNUT | 1992 | 24.94 | 1936 | 36.2 |
| IN | USH00122149 | DELPHI 2 N | 1992 | 26.5 | 1936 | 36.38 |
Here are a sample of 15 that have neither.
| STATE | Station | NAME | Coldest_Year | Coldest_July | Hottest_Year | Hottest_July |
| AL | USH00011084 | BREWTON 3 SSE | 1989 | 30.77 | 1902 | 36.71 |
| AL | USH00012813 | FAIRHOPE 2 NE | 1928 | 30.05 | 2000 | 34.93 |
| AL | USH00013160 | GAINESVILLE LOCK | 1916 | 30.25 | 1952 | 37.26 |
| AL | USH00013511 | GREENSBORO | 1967 | 28.49 | 1901 | 35.09 |
| AL | USH00015749 | MUSCLE SHOALS AP | 1967 | 29.59 | 1930 | 36.57 |
| AL | USH00017157 | SAINT BERNARD | 1967 | 27.33 | 1952 | 35.2 |
| AL | USH00017304 | SCOTTSBORO | 1906 | 29.21 | 1980 | 35.86 |
| AL | USH00017366 | SELMA | 1916 | 28.1 | 2000 | 36.65 |
| AL | USH00018178 | THOMASVILLE | 1916 | 29.87 | 1930 | 36.35 |
| AL | USH00018380 | TUSCALOOSA ACFD | 1889 | 29.5 | 1930 | 37.77 |
| AL | USH00018469 | VALLEY HEAD | 1967 | 28.31 | 1930 | 36.48 |
| AR | USH00031596 | CONWAY | 1989 | 27.83 | 1954 | 38.96 |
| AR | USH00031632 | CORNING | 1905 | 29.14 | 1930 | 38.45 |
| AR | USH00032356 | EUREKA SPRINGS 3 WNW | 1950 | 27.51 | 1980 | 38.65 |
| AR | USH00032444 | FAYETTEVILLE EXP STN | 1950 | 27.86 | 1954 | 38.03 |


