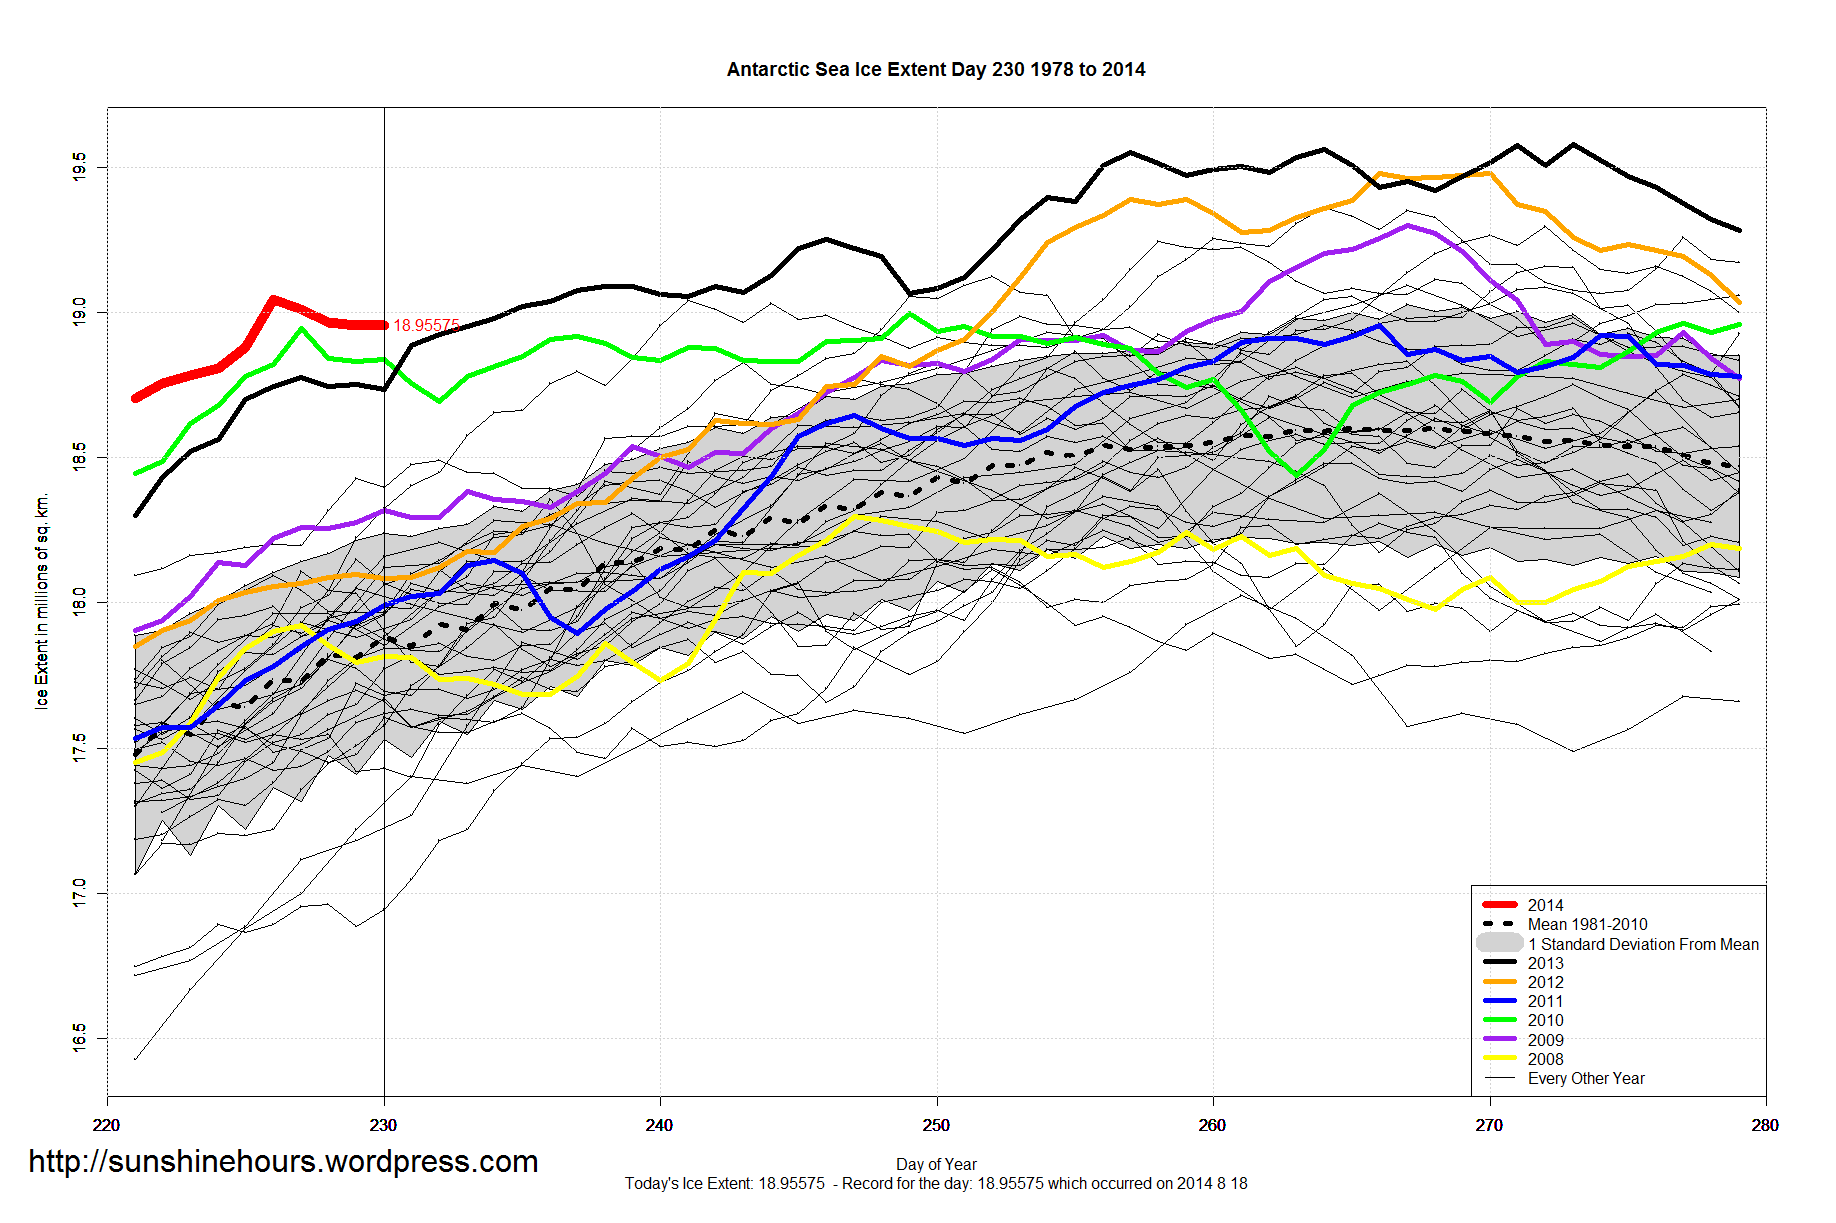
Antarctic Sea Ice Extent Aug 19 2014 – 1,108,000 sq km above the 1981-2010 mean. Data for Day 230. Data here.
Not sure … will 2014 follow the black line or the green line?

Antarctic Sea Ice Extent Aug 19 2014 – 1,108,000 sq km above the 1981-2010 mean. Data for Day 230. Data here.
Not sure … will 2014 follow the black line or the green line?

Will stay above the black line if solar activity stays quiet. Recent small spike in solar matches the slight slowdown in growth. Every slowdown in groth matches Every solar spike from the minimum and that is no joke on area . Solar chart here..
. http://www.solen.info/solar/
You have a chance to make history if you can chart the two on the same chart. Will show it clearly.
Like I asked before and once again, can you chart them together.
Thanks Chris Beal
Reason why you can see it clearly is solar activity is a quiet cycle and static of consistent strong activity is not blocking to view..