Anyone know why NSIDC now is using a standard deviation “gray” area to mark normality? It shows we have been “normal” all year now. Did I miss something?
Hi
Off topic but I do not know how to contact you. I have linked to your site in my blogroll and I wonder if you could return the favor to help us spread the message Down Under
Thx
Neil Gibson
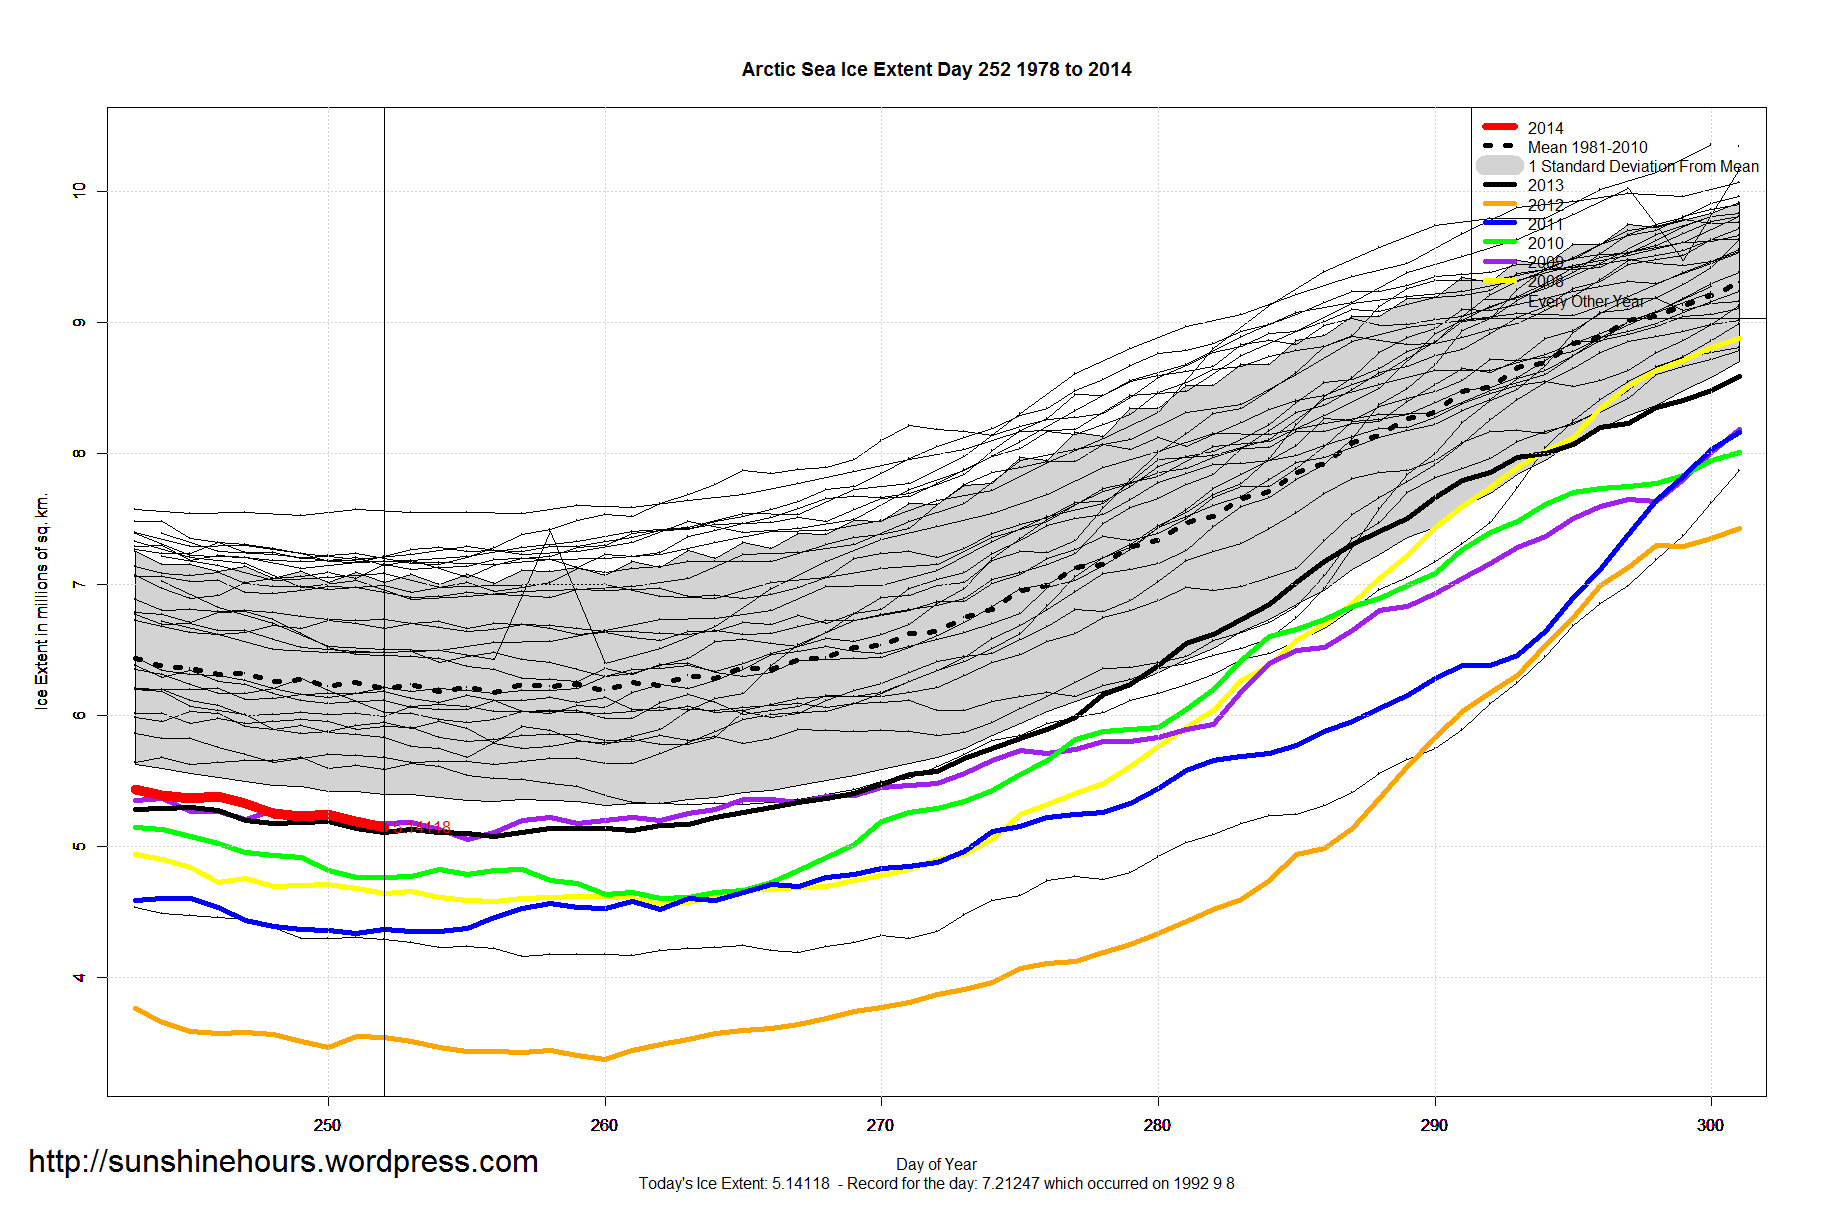


Day 252 (Sept. 9) is now in–just 3 days away from the average date for the minimum (255 or Sept. 12).
A new minimum is reached, but very close to the previous day. The table below shows the regions with remaining ice extent.
Note that the four regions with most of the ice have all stopped melting and are recovering.
Note also that the average NH minimum of 30 to 33 % has not been reached.
Region Date Reported Ann Min %of Max
(0) Northern_Hemisphere 2014252 5445009 35.1%
(1) Beaufort_Sea 2014246 704681 65.8%
(2) Chukchi_Sea 2014251 277576 28.7%
(3) East_Siberian_Sea 2014249 525410 48.3%
(4) Laptev_Sea 2014252 2411 0.3%
(5) Kara_Sea 2014251 93050 10.0%
(6) Barents_Sea 2014248 121208 16.5%
(7) Greenland_Sea 2014252 162018 21.3%
(8) Baffin_Bay_Gulf_St L 2014230 9776 0.5%
(9) Canadian_Archipelago 2014248 487137 57.1%
(10) Hudson_Bay 2014251 11503 0.9%
(11) Central_Arctic 2014250 2968800 91.4%
Anyone know why NSIDC now is using a standard deviation “gray” area to mark normality? It shows we have been “normal” all year now. Did I miss something?
Hi
Off topic but I do not know how to contact you. I have linked to your site in my blogroll and I wonder if you could return the favor to help us spread the message Down Under
Thx
Neil Gibson