Sept 10 2014 MASIE Update – Tiny Changes
Data here. Click for bigger.
| Region | 165 days ago | End | Last 164 | Last 28 | Last 14 | Last 7 | Last 3 | Last 1 |
| Greenland Sea | 603,416 | 162,018 | -441,397 | -120,946 | -81,417 | -54,501 | -39,440 | -14,866 |
| Beaufort Sea | 1,070,445 | 726,746 | -343,699 | -62,719 | 9,384 | 19,833 | 11,948 | -5,306 |
| Laptev Sea | 897,845 | 2,411 | -895,434 | -87,910 | -12,750 | -15,057 | -4,000 | -3,145 |
| Canadian Archipelago | 853,214 | 495,091 | -358,123 | -70,948 | -9,063 | -19,862 | 1,066 | -2,867 |
| Hudson Bay | 1,260,903 | 11,503 | -1,249,401 | -95,643 | -33,774 | -16,122 | -9,270 | 0 |
| Bering Sea | 697,324 | 0 | -697,324 | 0 | 0 | 0 | 0 | 0 |
| Baltic Sea | 15,337 | 0 | -15,337 | 0 | 0 | 0 | 0 | 0 |
| Sea of Okhotsk | 853,240 | 0 | -853,240 | 0 | 0 | 0 | 0 | 0 |
| Yellow Sea | 0 | 0 | 0 | 0 | 0 | 0 | 0 | 0 |
| Baffin Bay Gulf of St. Lawrence | 1,688,530 | 14,436 | -1,674,094 | -6,488 | -2,478 | -311 | -1,820 | 21 |
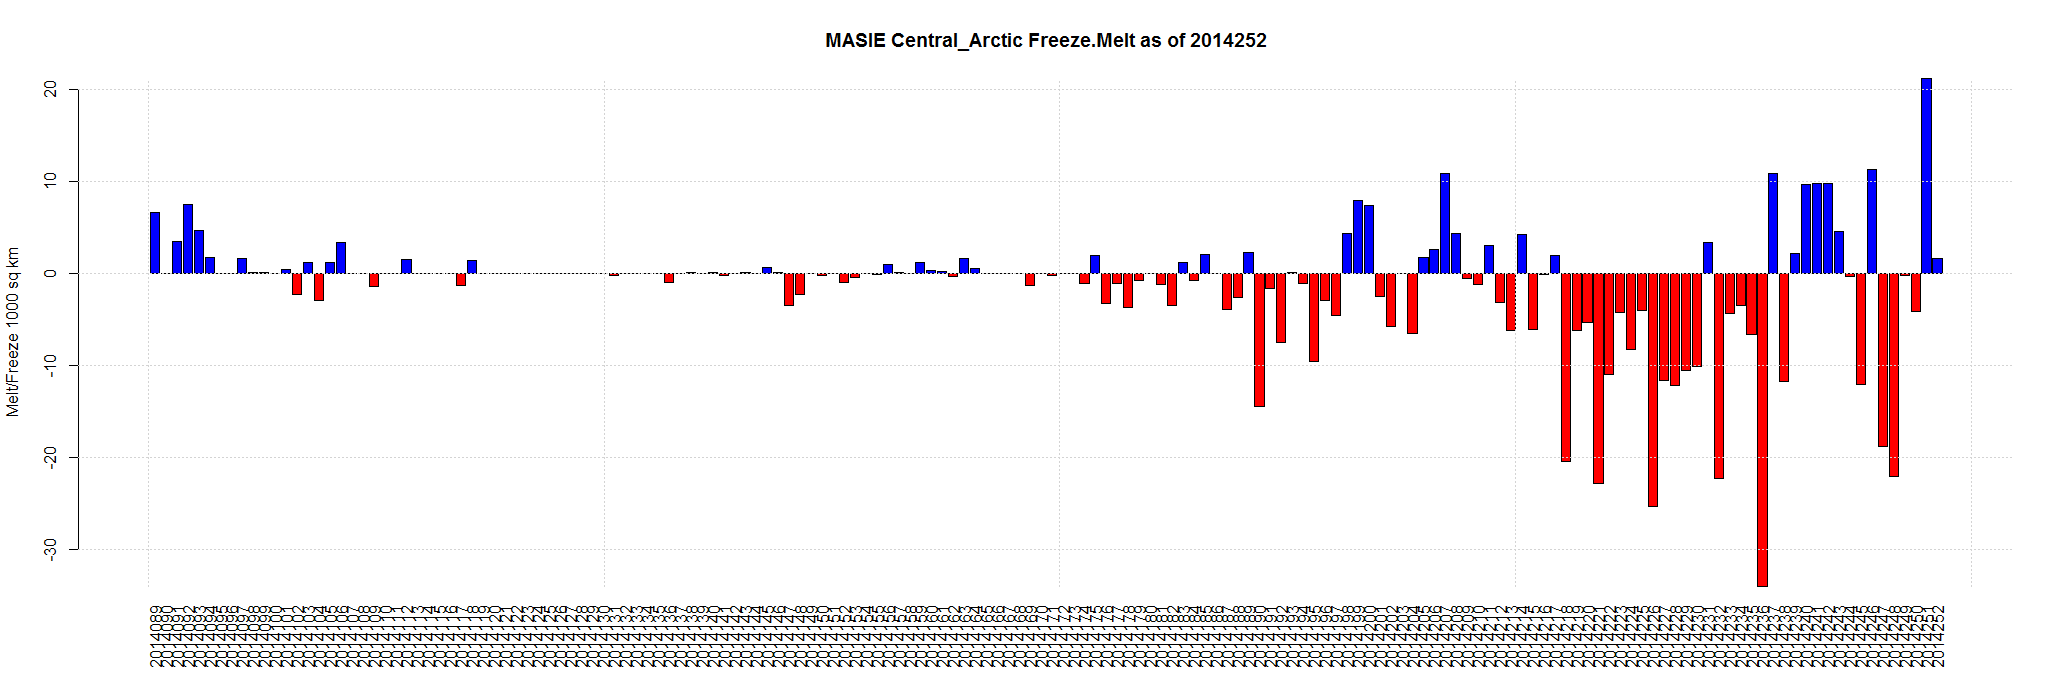
| Central Arctic | 3,221,921 | 2,991,516 | -230,406 | -130,612 | 11,927 | -11,337 | 18,578 | 1,593 |
| Chukchi Sea | 966,006 | 279,621 | -686,385 | -225,800 | -94,086 | -25,880 | -1,513 | 2,045 |
| Barents Sea | 645,917 | 130,065 | -515,852 | 16,633 | -13,591 | -4,555 | 3,968 | 2,932 |
| Kara Sea | 933,859 | 98,293 | -835,566 | -113,221 | -60,184 | -30,611 | 1,083 | 5,243 |
| East Siberian Sea | 1,087,137 | 532,439 | -554,698 | -171,482 | -8,728 | -11,118 | 7,029 | 6,288 |
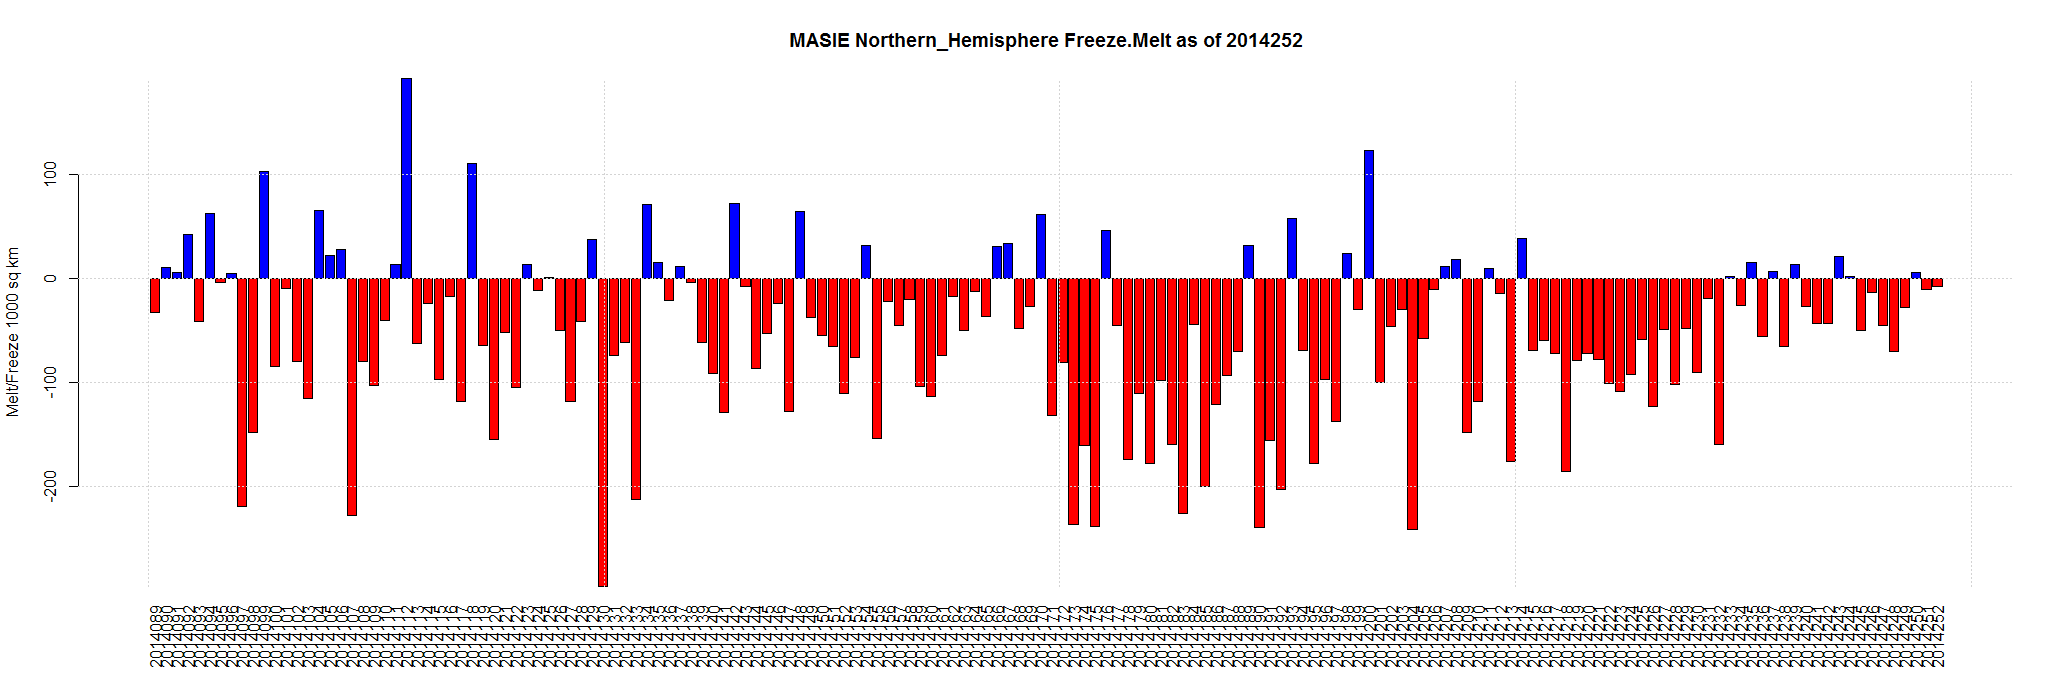
| Northern Hemisphere (Total) | 14,805,115 | 5,445,009 | -9,360,105 | -1,069,407 | -295,031 | -169,795 | -12,644 | -7,864 |
| NH (Average Loss per Day) | -56,728 | -38,193 | -21,074 | -24,256 | -4,215 | -7,864 |

Canadian Arctic Island’s are showing some minus temps…thinking that we should see this level off and possibly rise in ice…IMHO…
Day 253 is in, showing an increase of almost 40,000 Km2, an extent matching day 248, and the first increase since day 237.
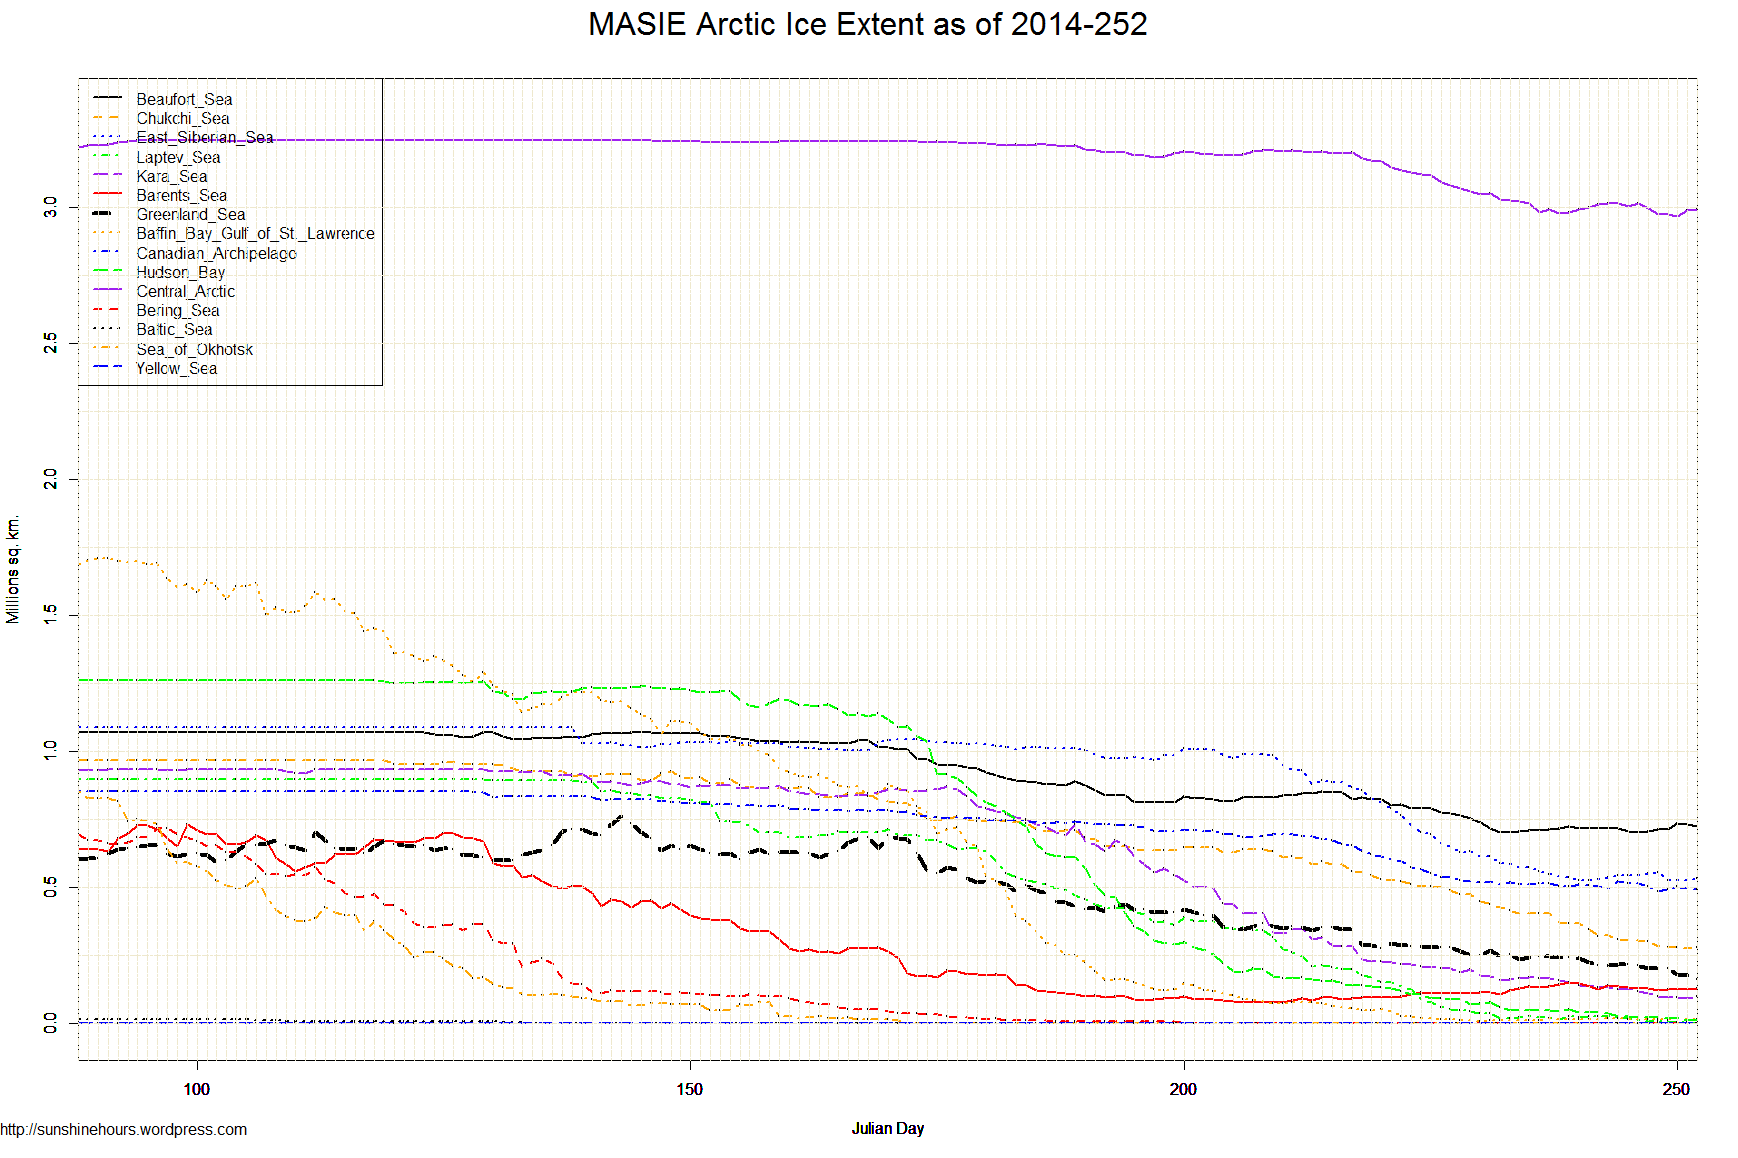
Here are the results for regions with ice remaining:
Region Date Reported Ann Min %of Max
(0) Northern_Hemisphere 2014252 5445009 35.1%
(1) Beaufort_Sea 2014246 704681 65.8%
(2) Chukchi_Sea 2014251 277576 28.7%
(3) East_Siberian_Sea 2014249 525410 48.3%
(4) Laptev_Sea 2014253 1795 0.2%
(5) Kara_Sea 2014253 88846 9.5%
(6) Barents_Sea 2014248 121208 16.5%
(7) Greenland_Sea 2014252 162018 21.3%
(8) Baffin_Bay_Gulf_of_St._Lawrence 2014230 9776 0.5%
(9) Canadian_Archipelago 2014248 487137 57.1%
(10) Hudson_Bay 2014251 11503 0.9%
(11) Central_Arctic 2014250 2968800 91.4%
Note that losses in Laptev and Kara Seas were offset by gains elsewhere, especially in Beaufort, Chukchi and Greenland Seas.
Could this be the minimum? If it holds, the minimum of 65% of max will be unusual.
Stay tuned as Nature does her thing.
Correction: Minimum is now at 35% of max; the melt has been 65% of max, compared to averages 67 to 70%.