Normally (as you can see from the graph below) at this time of year Antarctic Sea Ice is high one or two years and then drops as much as 1.3 million sq km to a low (even a new) low and then repeats.
From 2012 the big drop in the sawtooth pattern stopped. From 2012 every value is above every value before 2012 (with a little license for the tiny dip from 2012 to 2013).
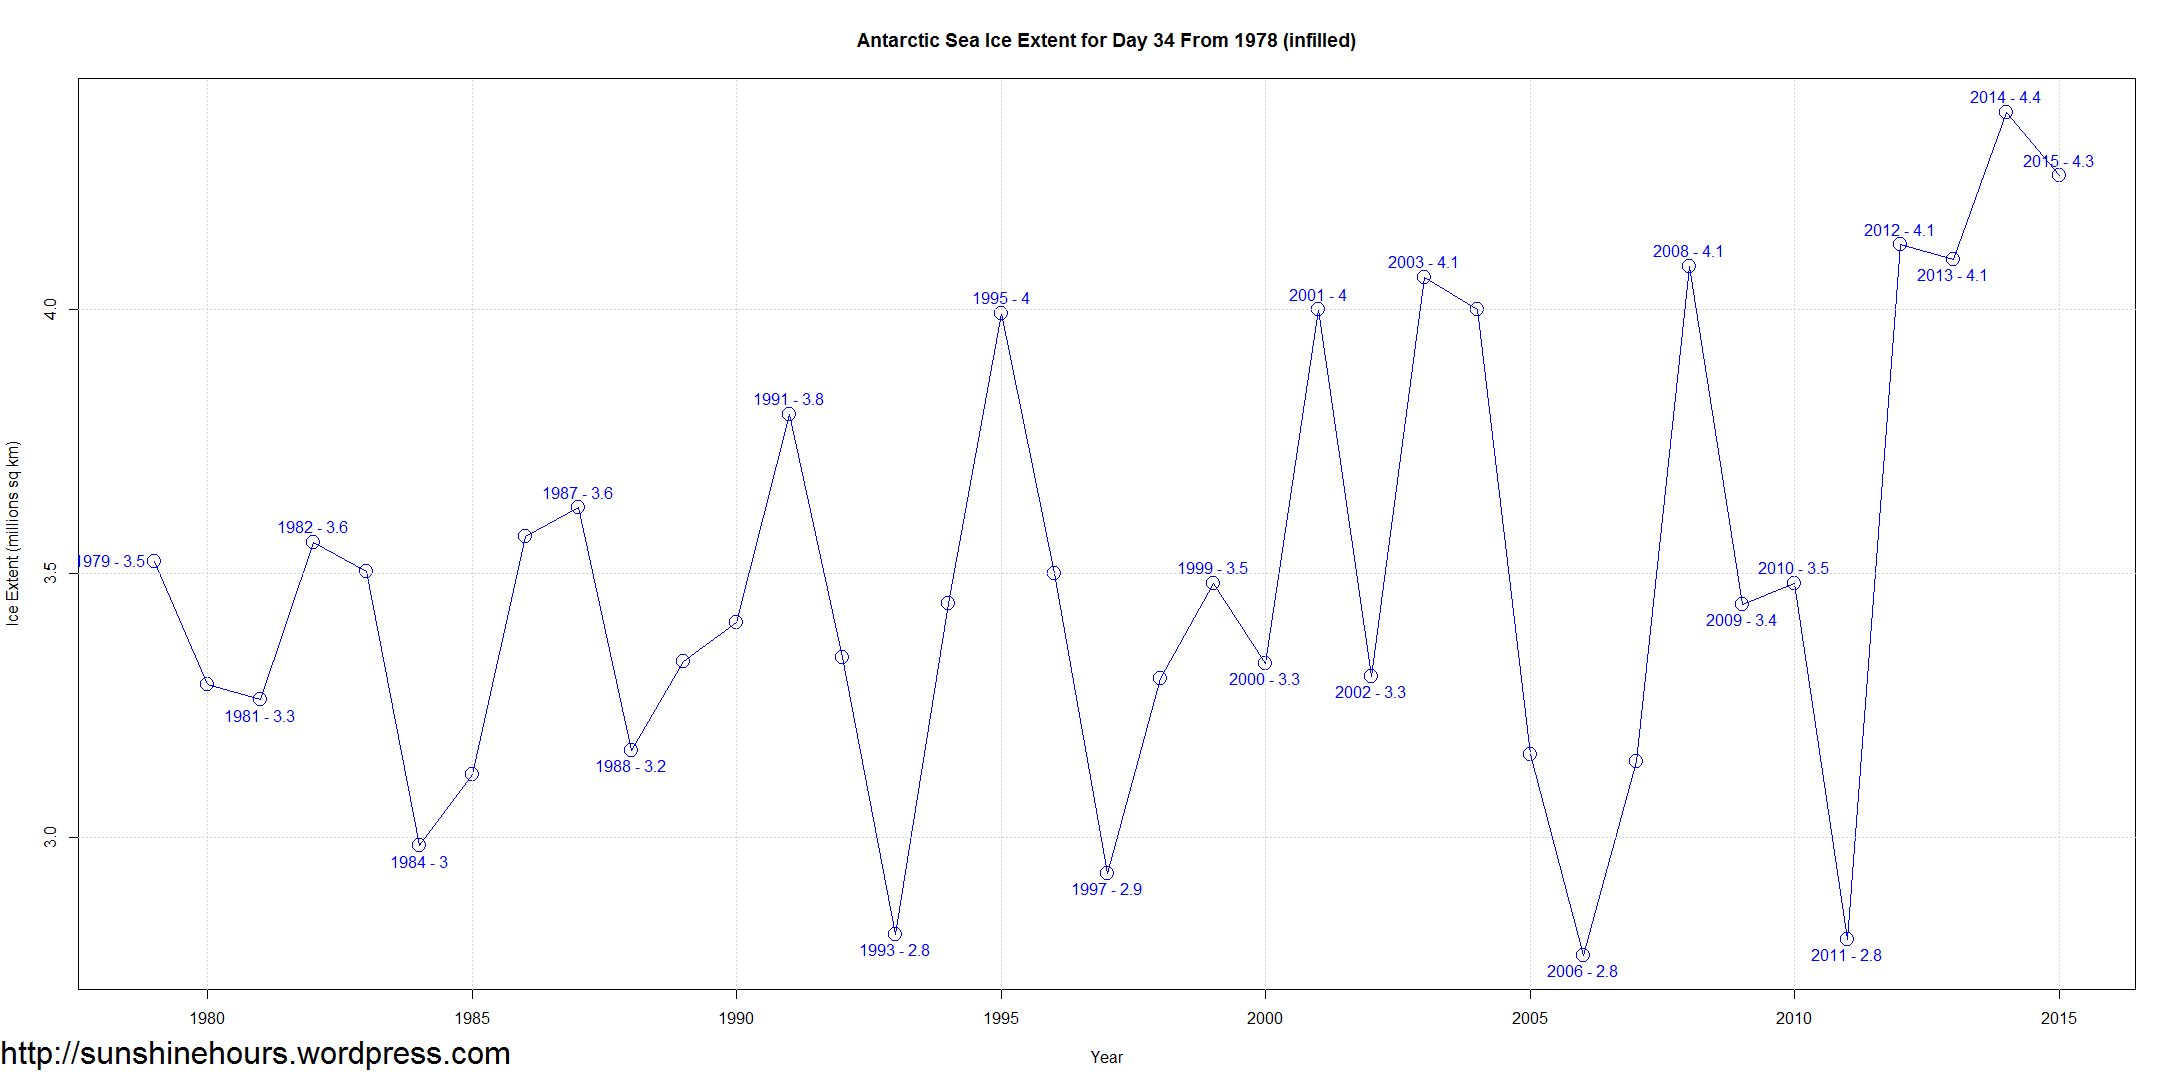

If it drops to levels similar to 2011….just watch the wailing and knashing of teeth by the alarmists as they say ‘told you so…..’
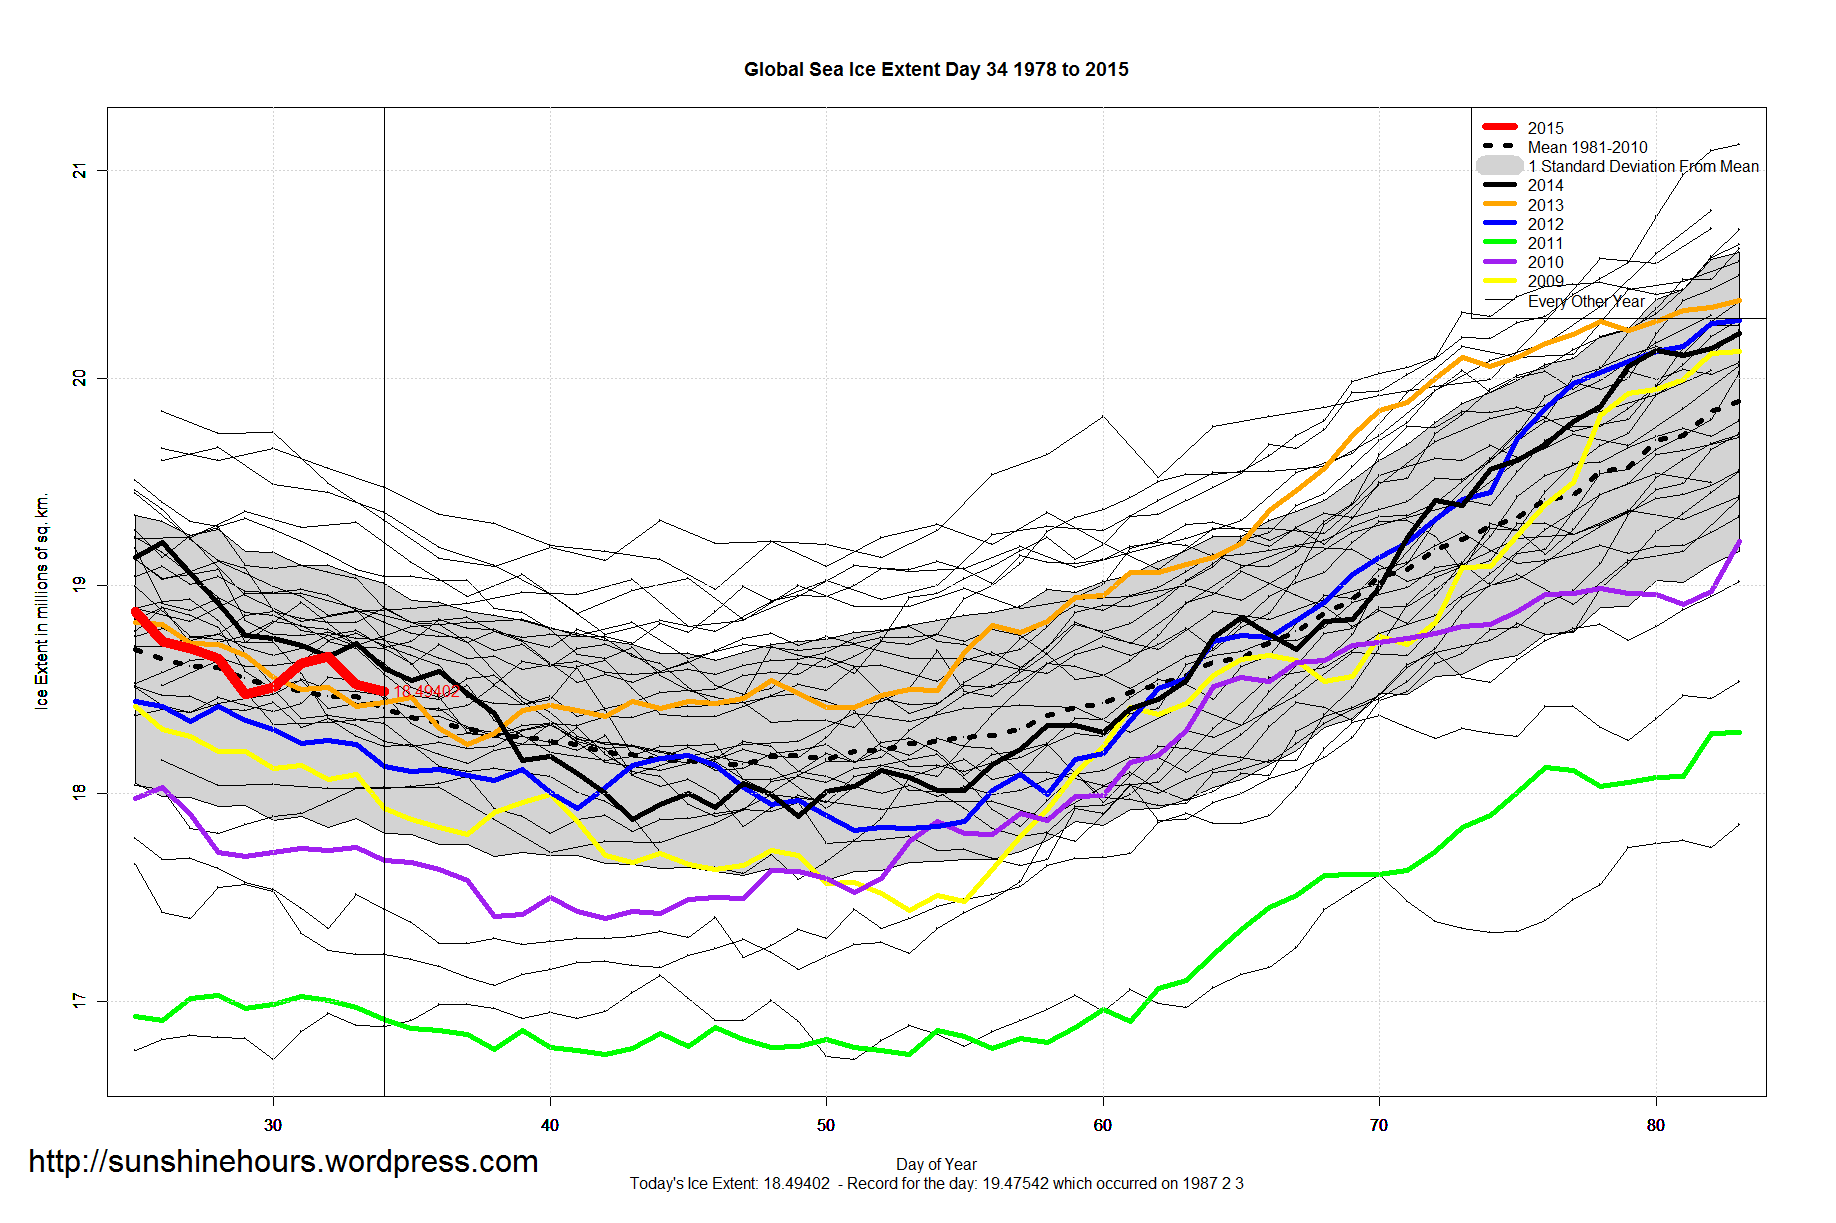
Months ago, the global total sea ice was so far out of the “bands” it looked scary. It looked like the ice age was already starting. So, it is comforting to see the global almost perfectly “average”!
Whew, missed the melt down and missed the freeze up. We sure must like living “on the edge”….
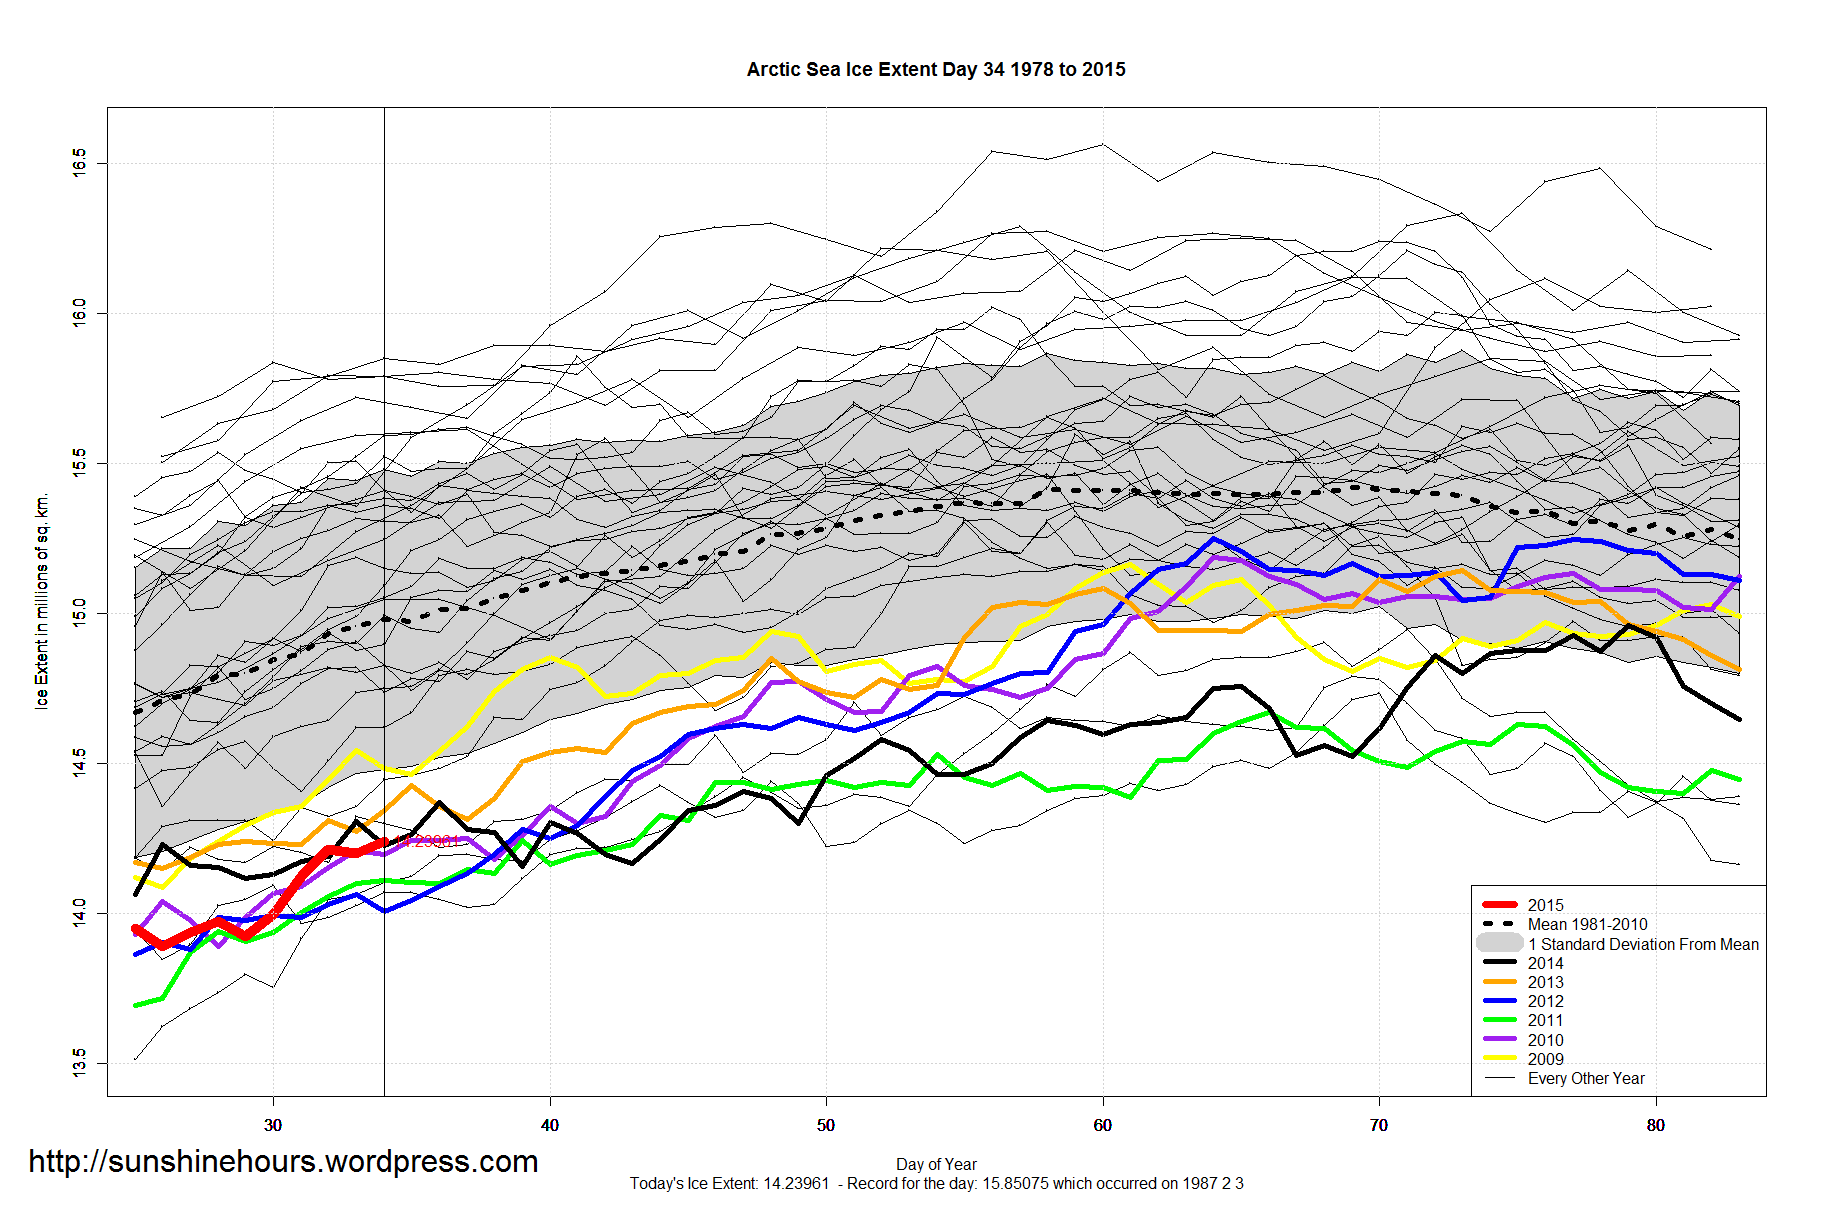
This is the peak of the solar cycle. I expected the total Sea Ice to dip well below average! It did not. The freezing is now coming, like a high speed freight train. Like most others, you live in the now, and don”t remember the low Solar cycle in the 1970s.
The Antarctica Ozone is thinning, Solar output is down. Watch the minimum Antarctica sea ice gain ice starting in two weeks.