Every once in a while I visit the data for the weather station closest to my hometown on the west coast of Canada.
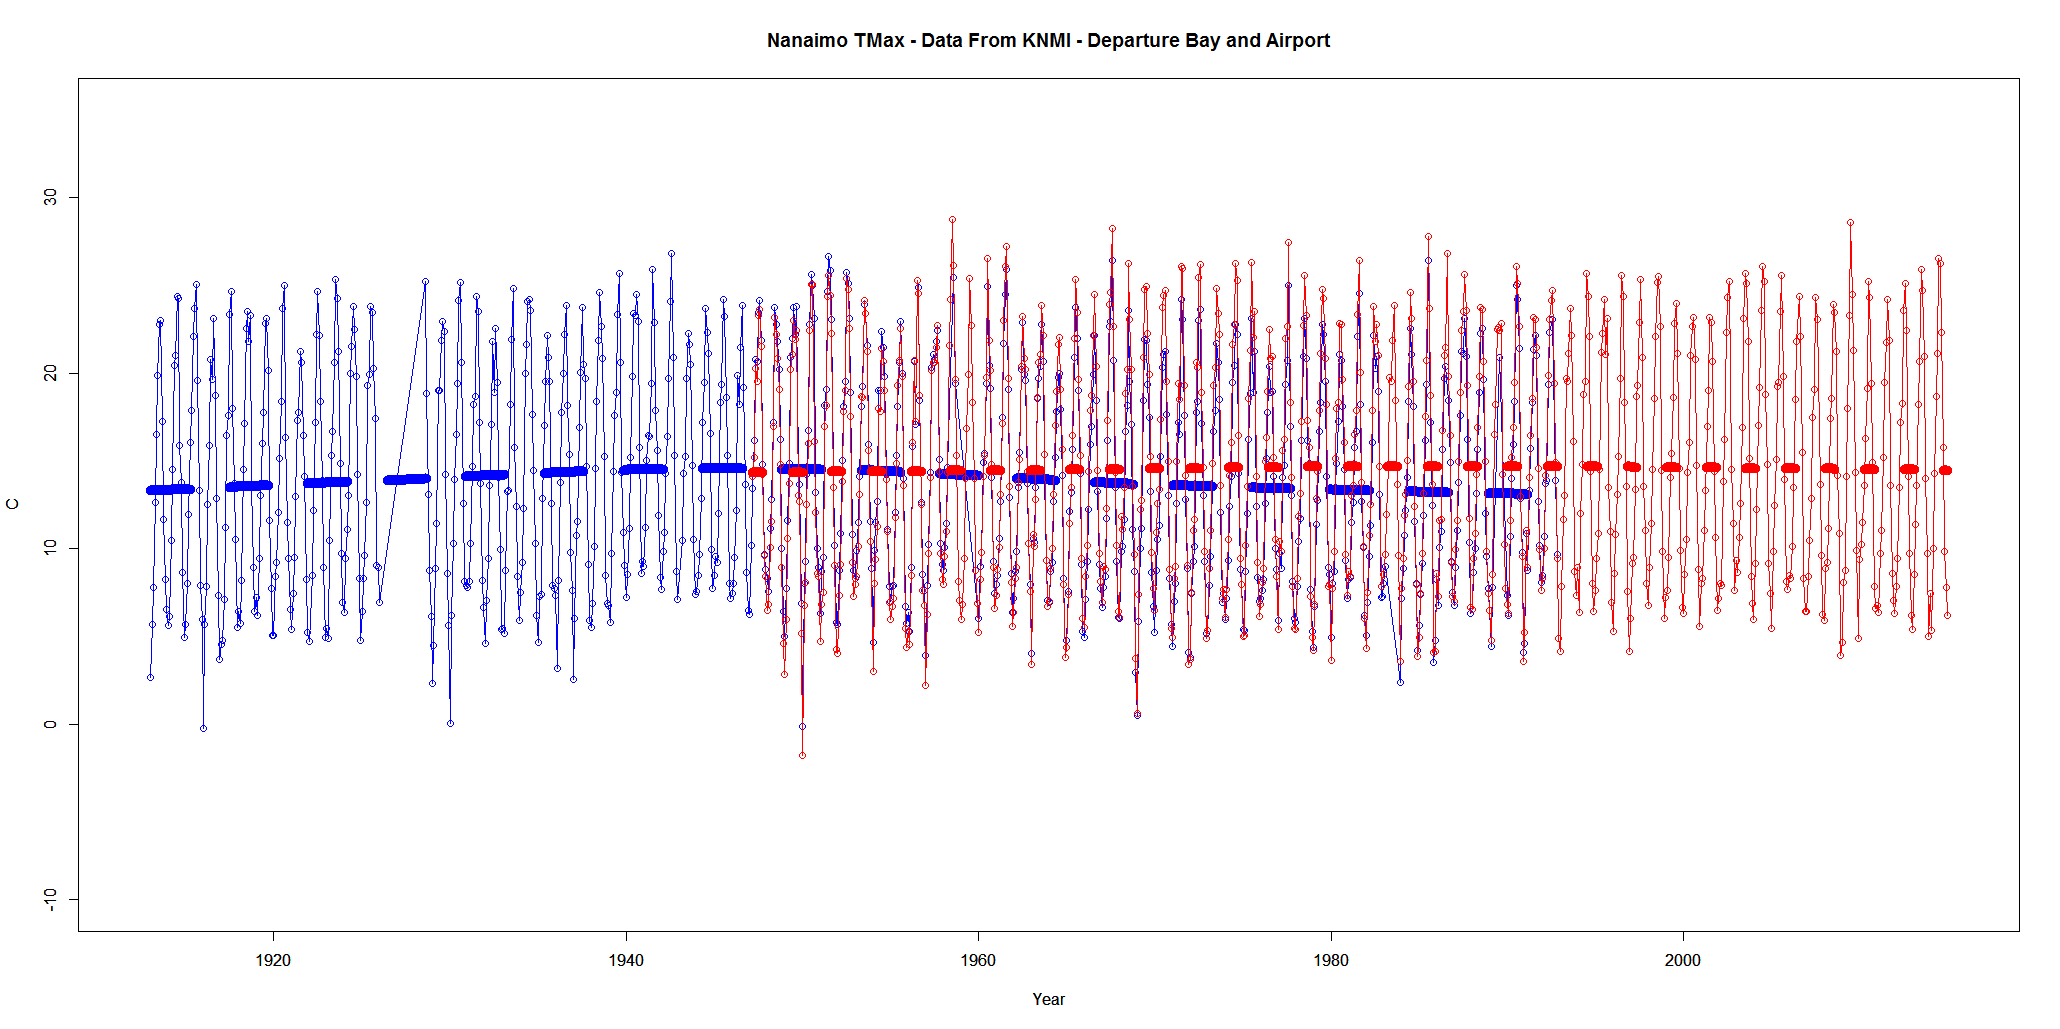
Today I am looking at daily data (using KNMI) from Departure Bay (1913 – 1992) and Nanaimo Airport (1947 – 2014).
I’ve summarized the data by monthly mean.
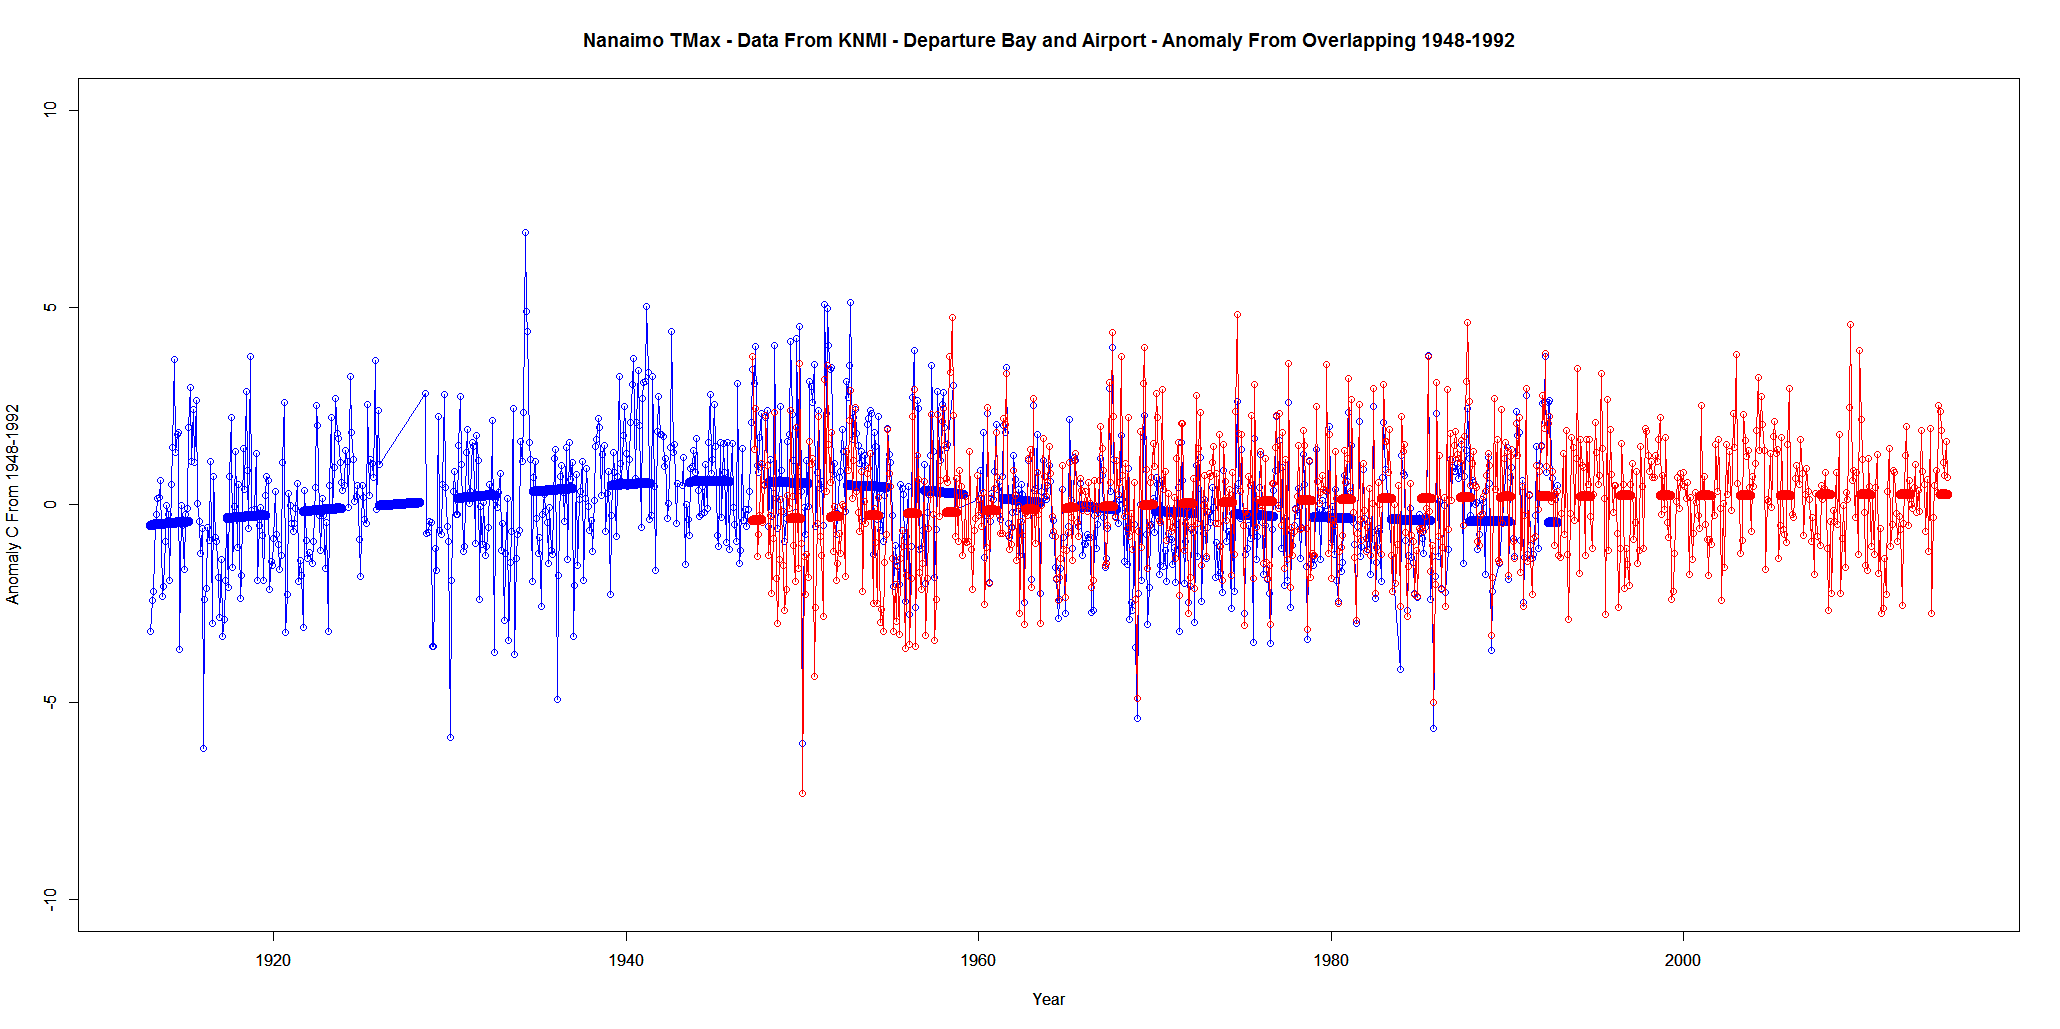
The data does overlap. The first graph is just Tmax. The second graph is Tmax anomaly from the overlap period of 1948 to 1992

How does it compare to a GISS homogenised version?
Strange. No data after 1990.
http://data.giss.nasa.gov/cgi-bin/gistemp/show_station.cgi?id=403718920030&dt=1&ds=14
http://data.giss.nasa.gov/cgi-bin/gistemp/show_station.cgi?id=403718920010&dt=1&ds=14