
Month: February 2015
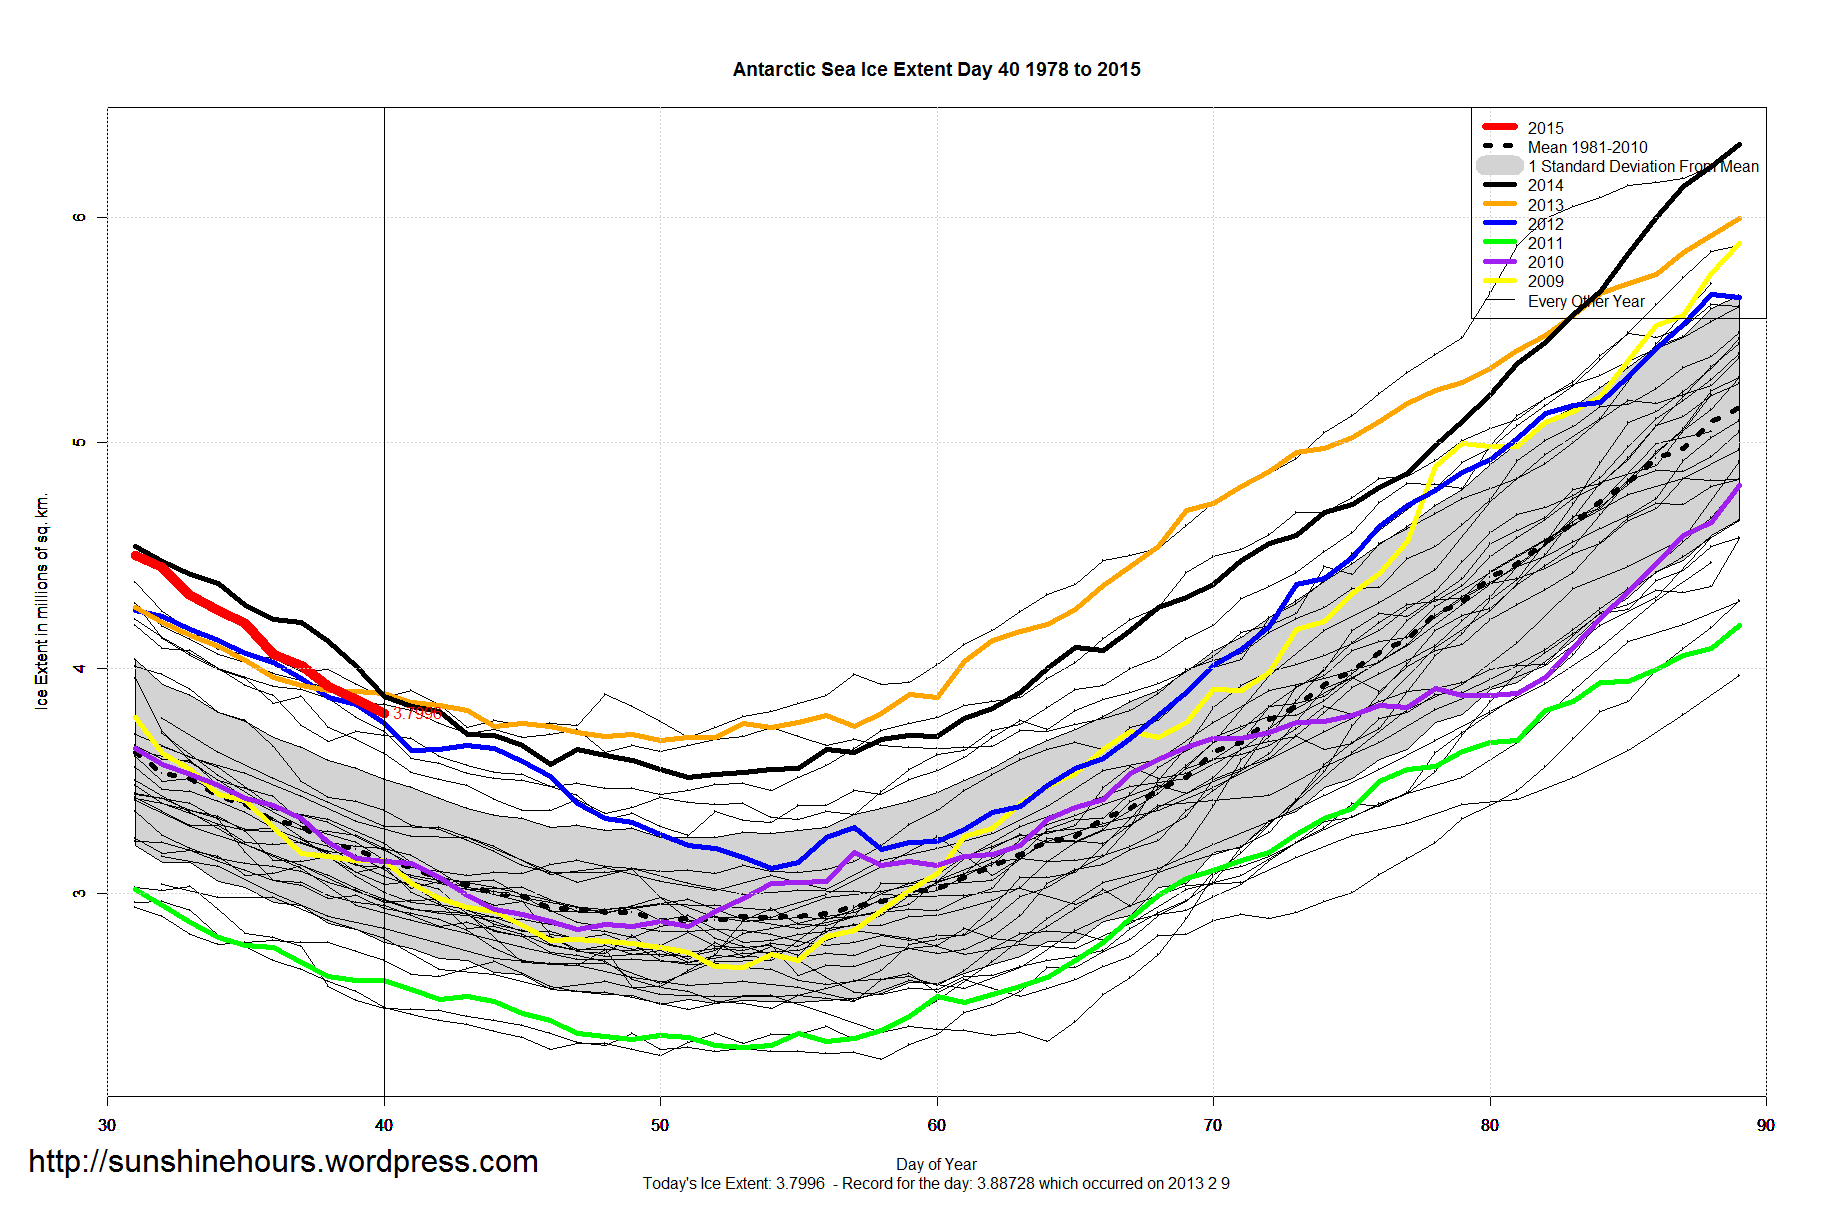
Sea Ice Extent – Day 41


USA NOAA January 2015 Tmax – States
Oooops: I initially used C/Decade. It is F/Decade.And I have to check the Trend.
Update: The trend is correct once I corrected the units.
Update: Here is a link to NOAA for California. Ohio is doing the opposite since 1998.
January 2015 Tmax Ordered By State Rank
Only 6 States in the top 10. Only 9 in the top 20. 27 out of 48 have a rank of less than 61 (the middle of 121).
And note that 15 states January’s are cooling since 1895 .
And 38 states January’s are cooling since 1998.
| State | Rank (1 = Hottest) | Trend Since 1895 in F/Decade | Trend Since 1998 in F/Decade |
| Oregon | 1 | 0.45 | 1.86 |
| California | 3 | 0.36 | 2.66 |
| Nevada | 4 | 0.29 | 0.79 |
| Utah | 8 | 0.31 | -1.6 |
| Wyoming | 8 | 0.38 | -0.15 |
| Idaho | 9 | 0.26 | 0.33 |
| Washington | 11 | 0.38 | 0.28 |
| Arizona | 19 | 0.34 | -0.63 |
| Colorado | 19 | 0.23 | -0.96 |
| Montana | 22 | 0.44 | 0.83 |
| North Dakota | 23 | 0.45 | 0.85 |
| South Dakota | 25 | 0.3 | -0.61 |
| Minnesota | 27 | 0.24 | -1.38 |
| Kansas | 28 | 0.2 | 0.06 |
| Nebraska | 29 | 0.2 | -1.02 |
| Iowa | 31 | 0.01 | -1.3 |
| Missouri | 44 | -0.03 | -0.62 |
| Oklahoma | 49 | 0.11 | 0.05 |
| Florida | 51 | 0.05 | -0.54 |
| New Mexico | 56 | 0.23 | -1.67 |
| Wisconsin | 60 | 0.12 | -2.32 |
| Arkansas | 68 | -0.11 | -1.43 |
| Illinois | 68 | -0.06 | -1.8 |
| North Carolina | 68 | -0.06 | -1.75 |
| Georgia | 71 | -0.01 | -1.63 |
| South Carolina | 71 | -0.04 | -1.48 |
| Virginia | 71 | -0.02 | -2.29 |
| Alabama | 73 | -0.17 | -1.65 |
| Mississippi | 73 | -0.19 | -1.64 |
| Delaware | 75 | 0.07 | -2.16 |
| Indiana | 78 | -0.13 | -2.57 |
| Kentucky | 78 | -0.15 | -2.67 |
| Maine | 78 | 0.13 | 0.3 |
| Maryland | 79 | 0.06 | -2.46 |
| New Jersey | 79 | 0.17 | -2.12 |
| Tennessee | 79 | -0.18 | -2.24 |
| Louisiana | 80 | -0.12 | -2.02 |
| Michigan | 81 | 0.13 | -1.92 |
| West Virginia | 82 | -0.16 | -2.84 |
| New Hampshire | 85 | 0.08 | -0.63 |
| New York | 85 | 0.06 | -1.18 |
| Vermont | 86 | 0.04 | -0.66 |
| Connecticut | 87 | 0.1 | -1.24 |
| Ohio | 88 | -0.09 | -2.85 |
| Massachusetts | 89 | 0.11 | -1 |
| Pennsylvania | 89 | 0.04 | -2.6 |
| Texas | 90 | 0.05 | -2.3 |
| Rhode Island | 92 | 0.13 | -1.14 |
USA NOAA January 2015 Tmax – West Warm / East Cold
A rank of 121 in Oregon indicates the warmest (since NOAA records started in 1895). This data is Maximum temperature average for the month..
On the other hand, a rank of 30 indicates 91 January’s were warmer.
es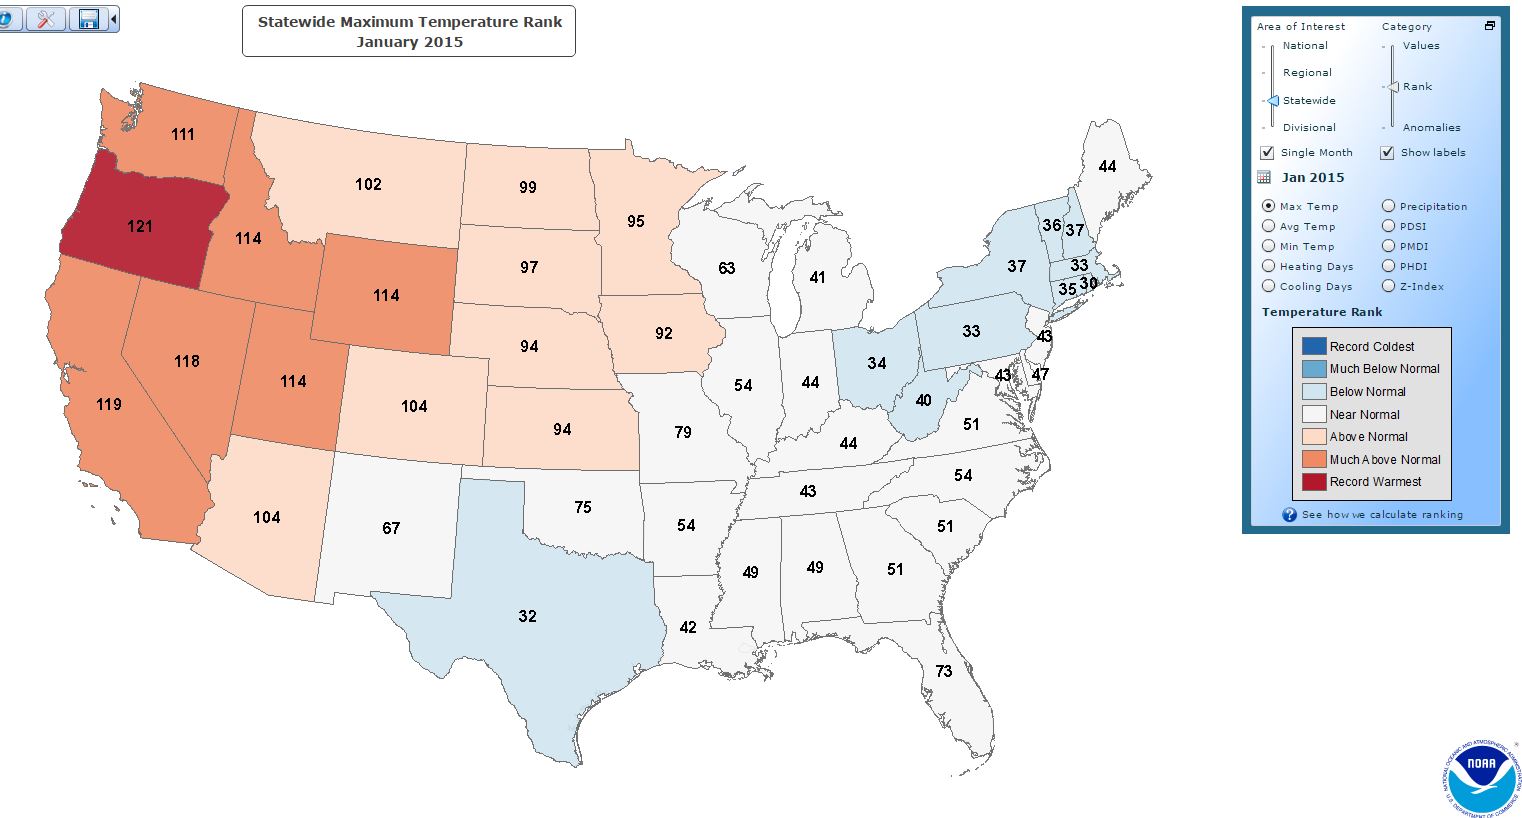
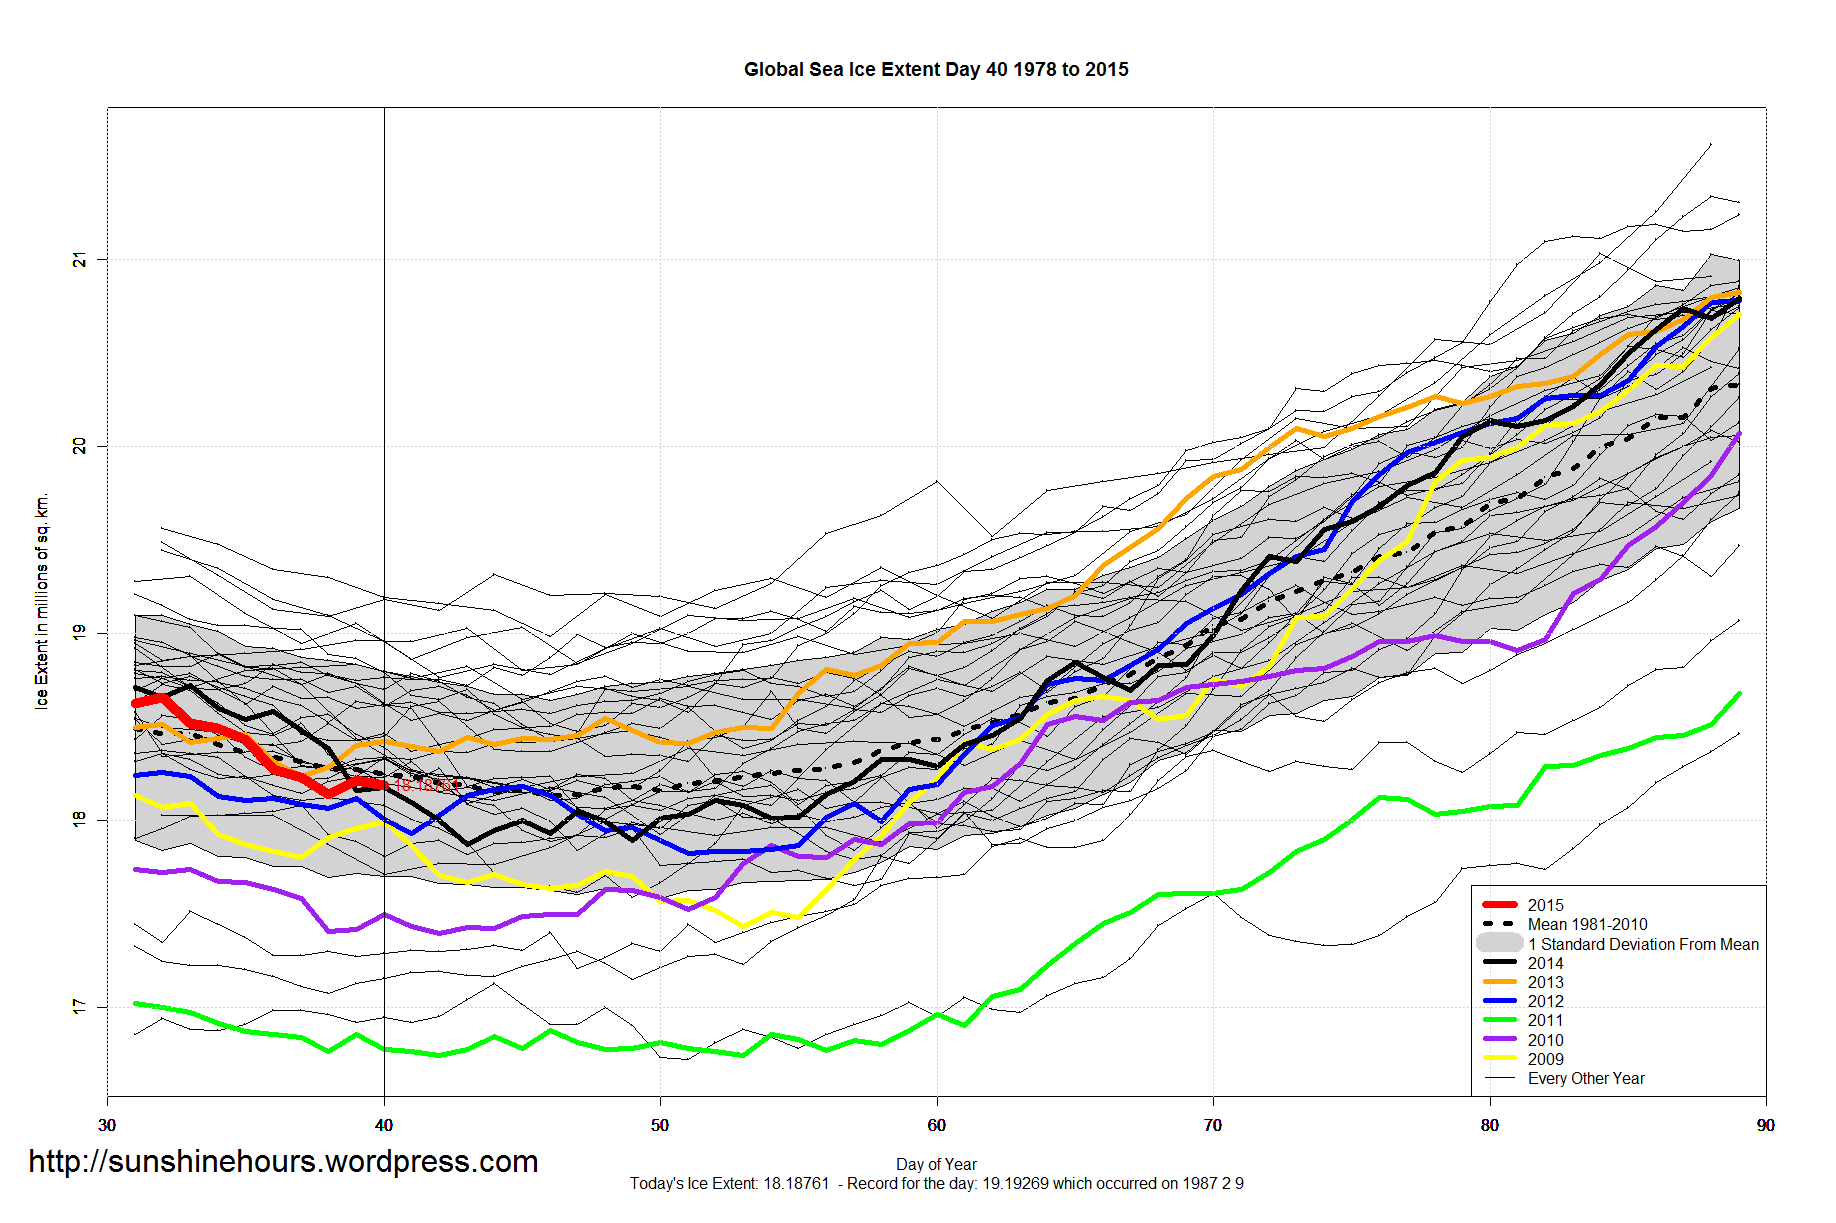
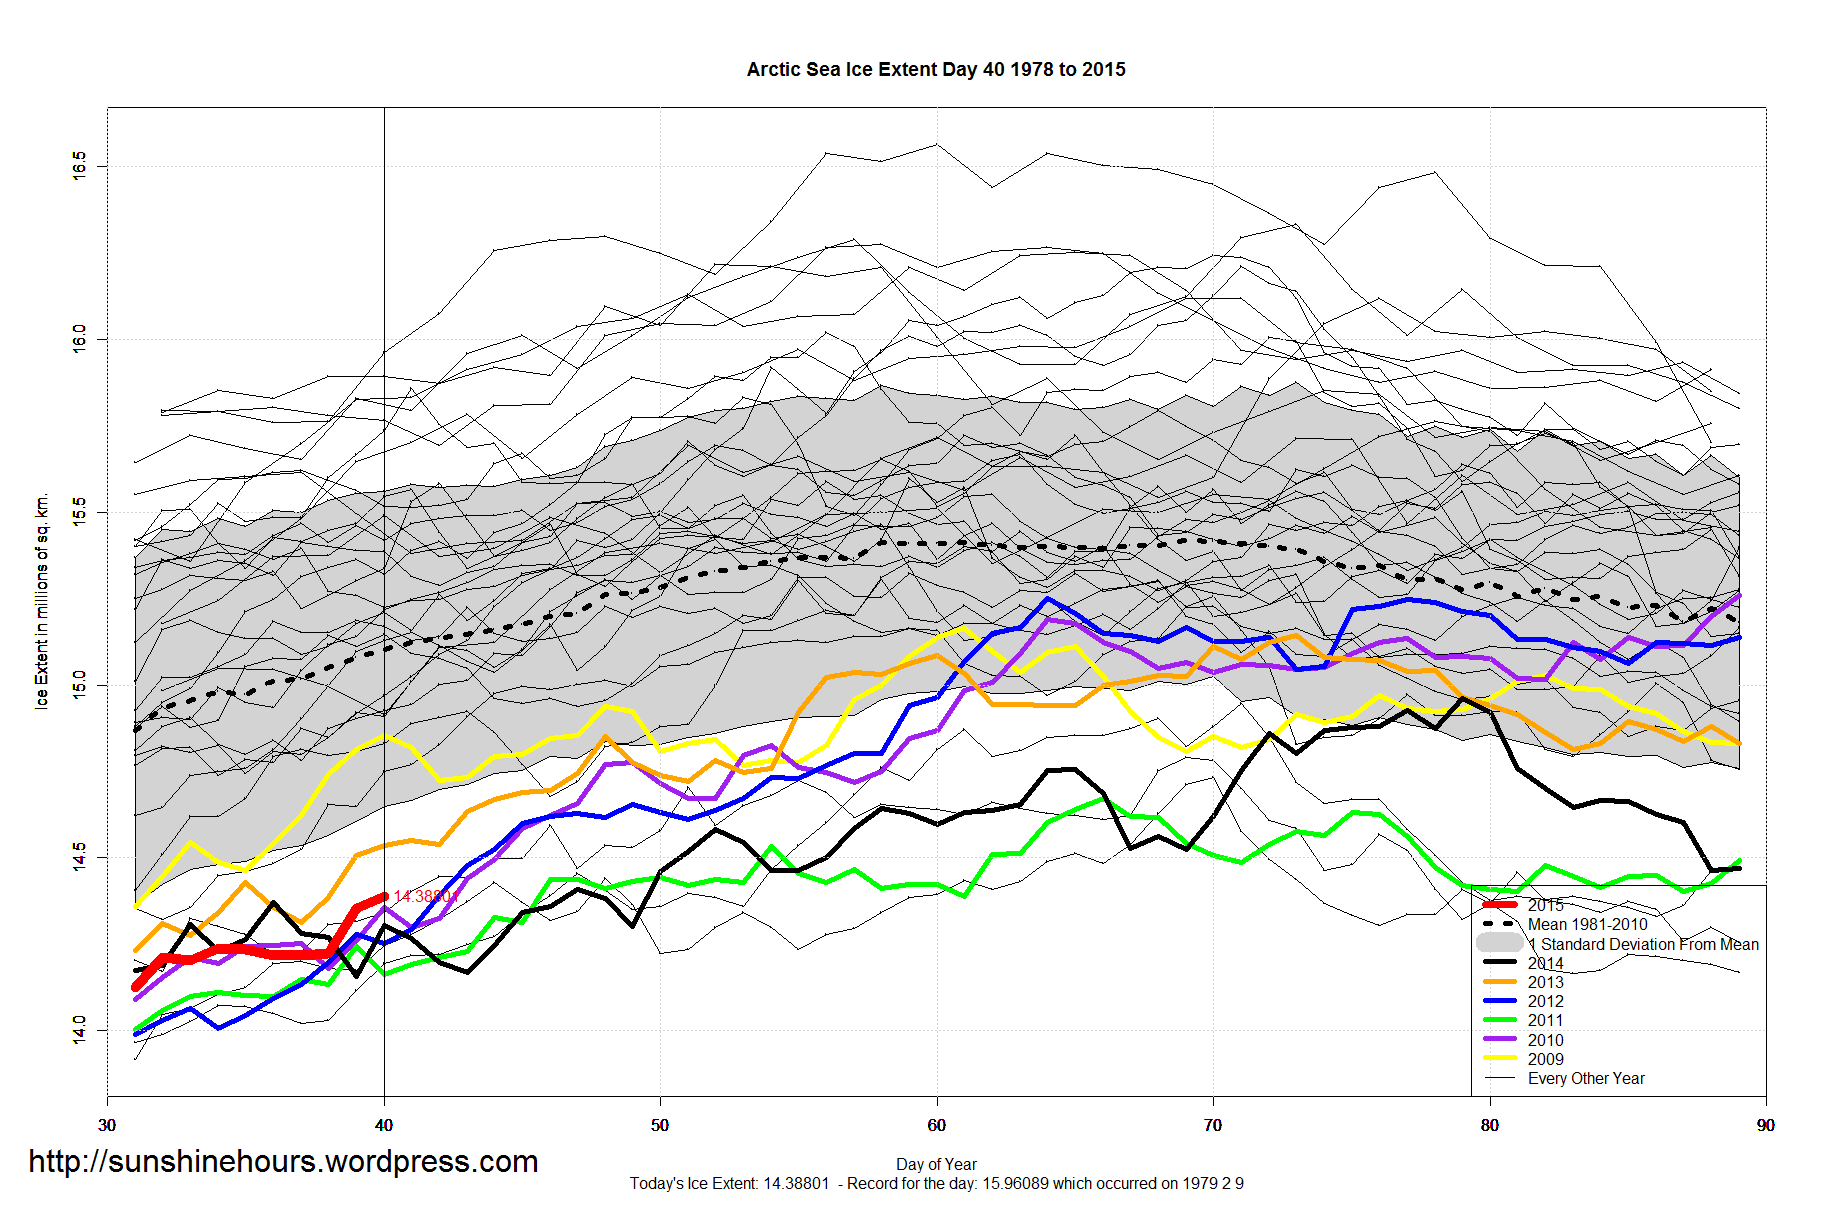
Sea Ice Extent – Day 40
Biggest Science Scandal Ever
“When future generations look back on the global-warming scare of the past 30 years, nothing will shock them more than the extent to which the official temperature records – on which the entire panic ultimately rested – were systematically “adjusted” to show the Earth as having warmed much more than the actual data justified.”
“Two weeks ago, under the headline “How we are being tricked by flawed data on global warming”, I wrote about Paul Homewood, who, on his Notalotofpeopleknowthat blog, had checked the published temperature graphs for three weather stations in Paraguay against the temperatures that had originally been recorded. In each instance, the actual trend of 60 years of data had been dramatically reversed, so that a cooling trend was changed to one that showed a marked warming.”
Read it all here:
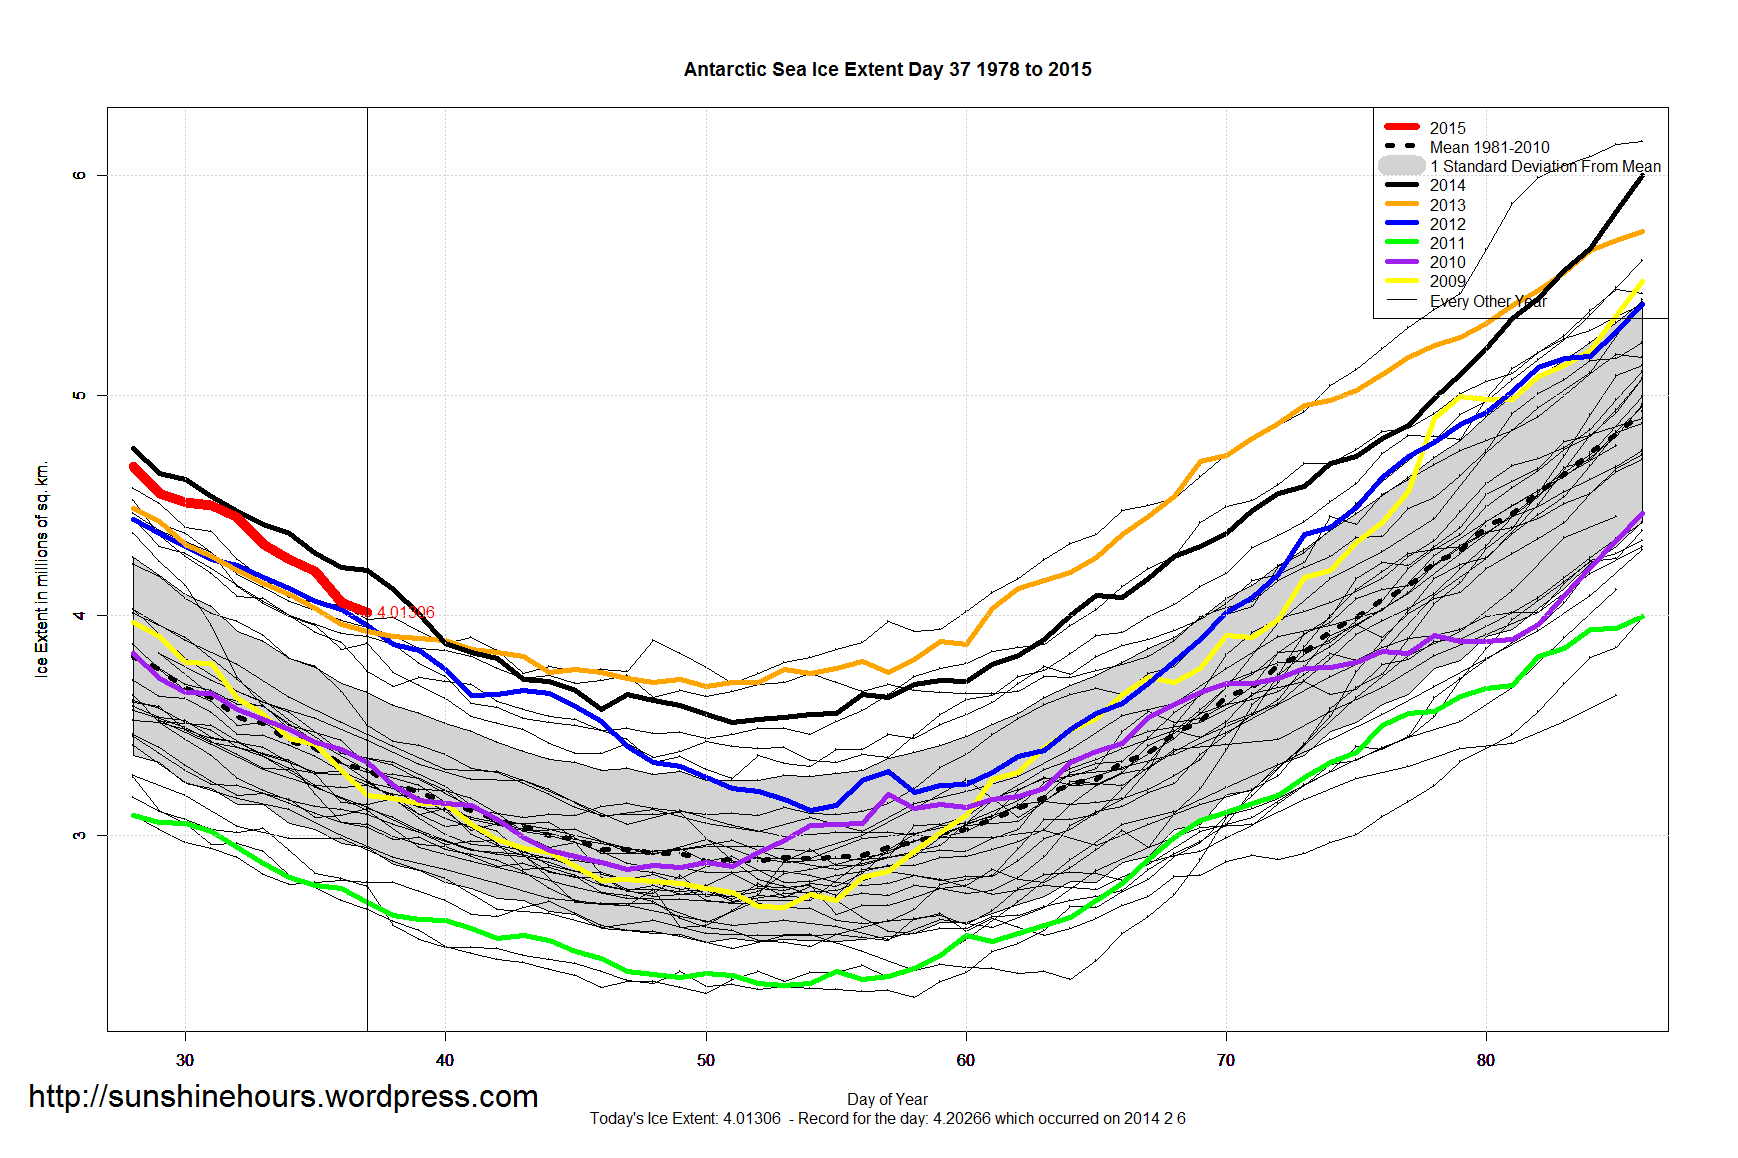
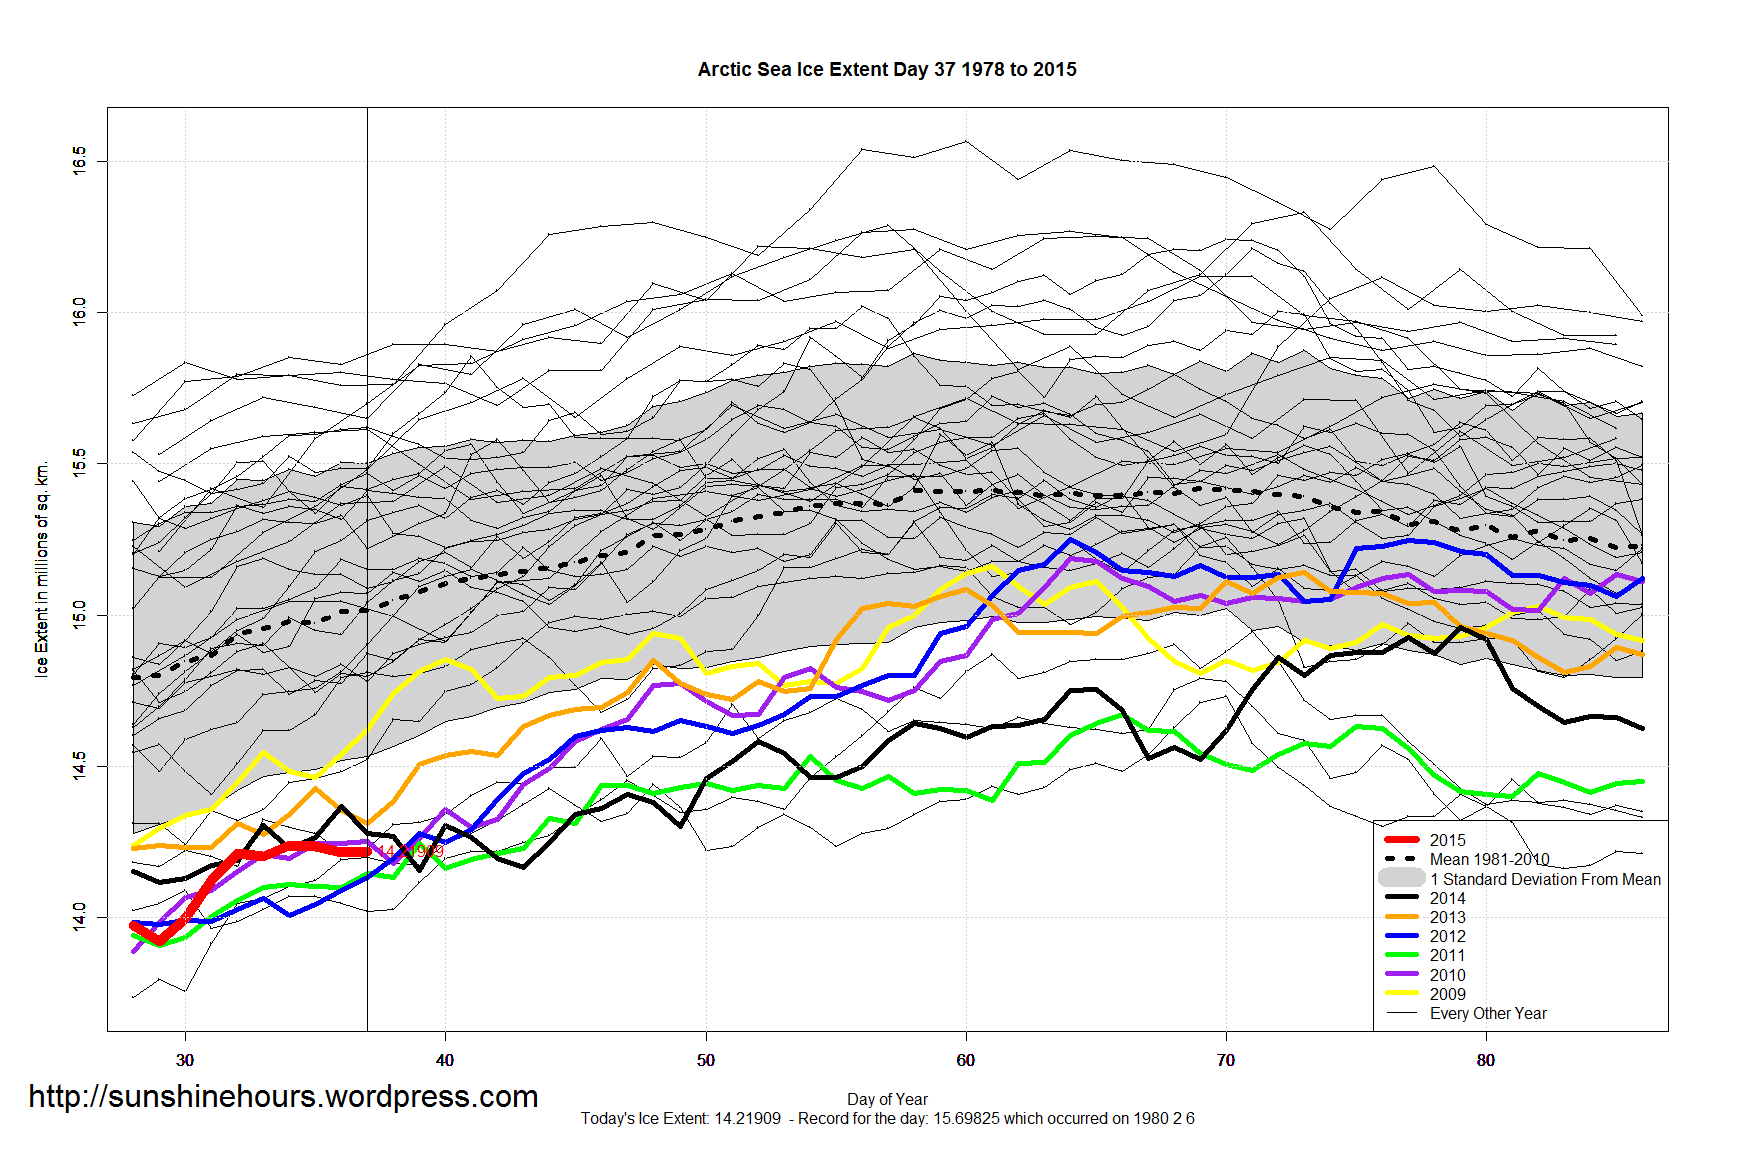
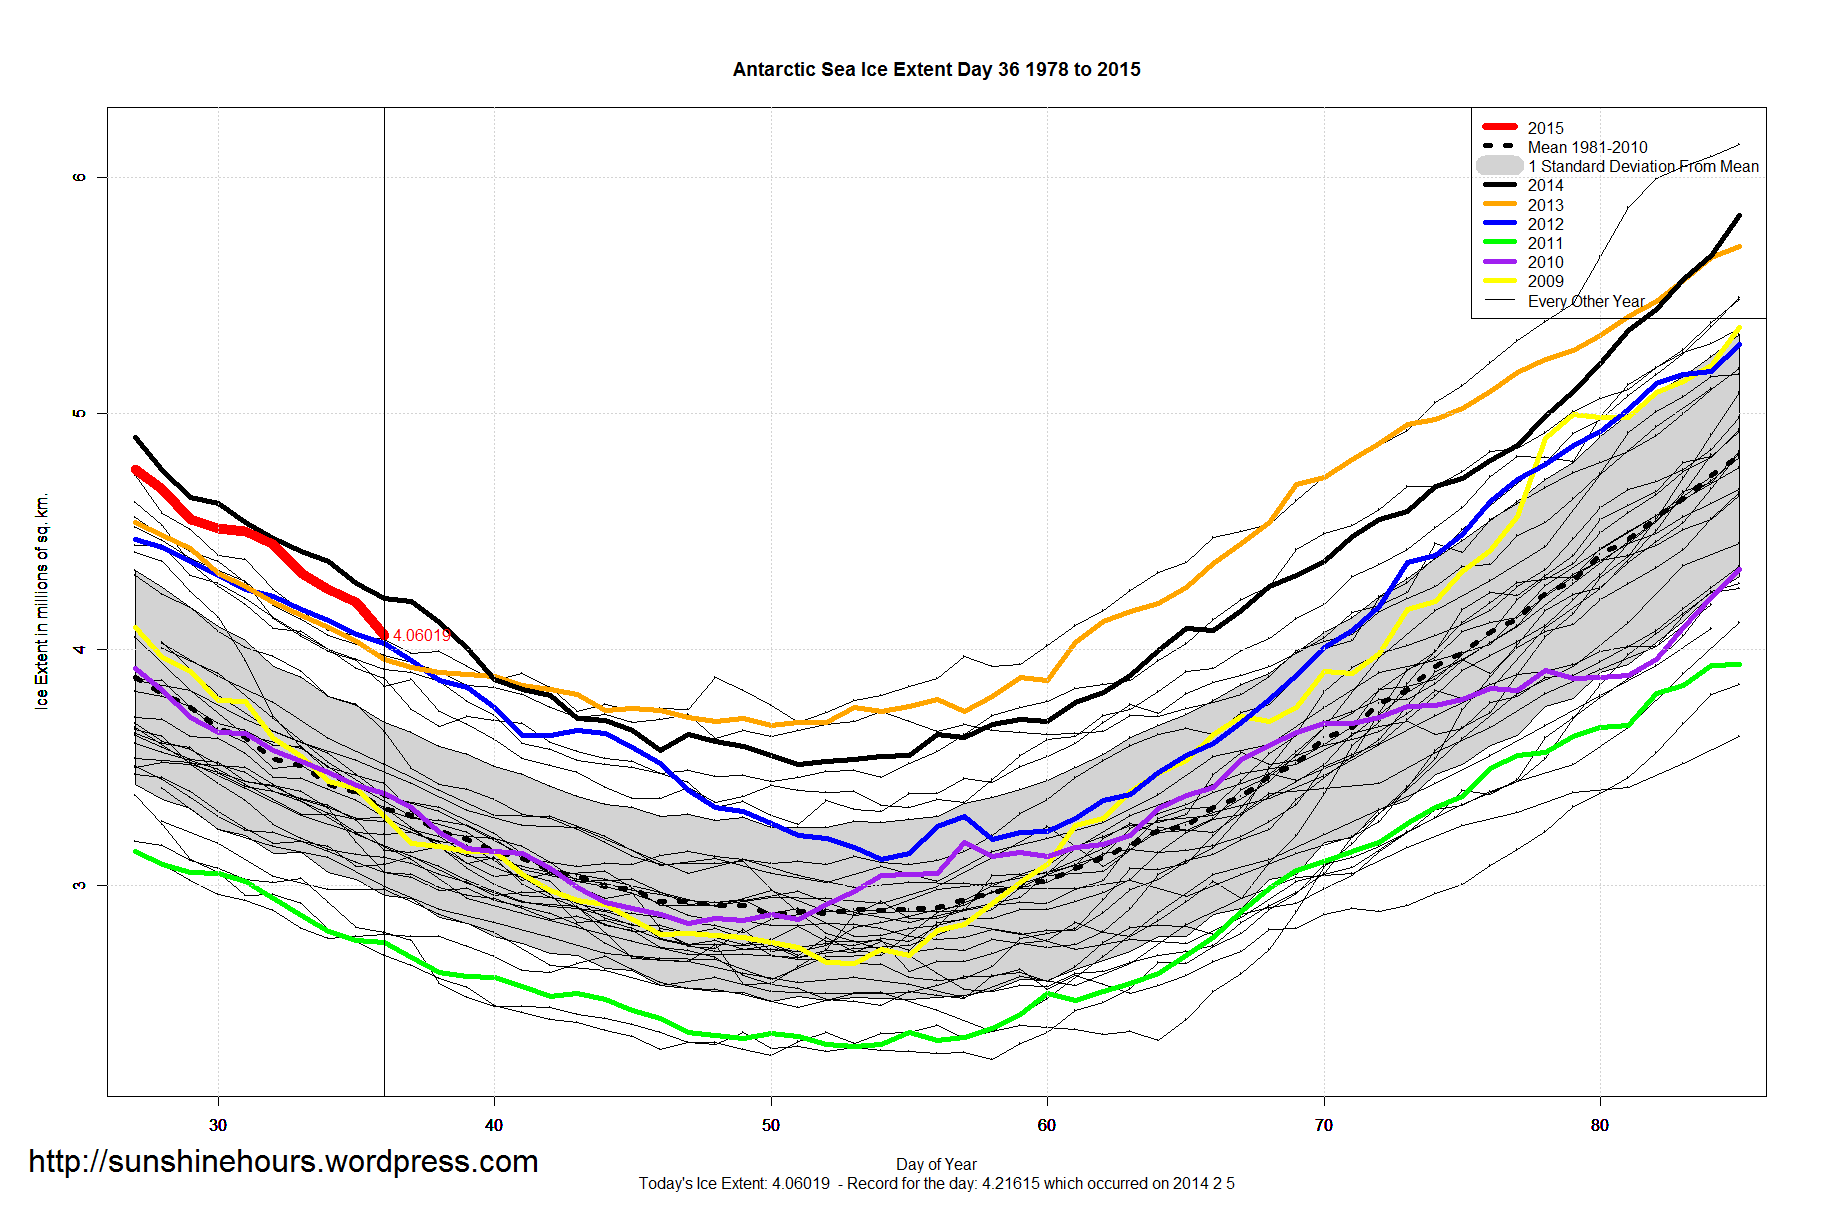
Sea Ice Extent – Day 37 – Antarctica 700,000 sq km Above Mean
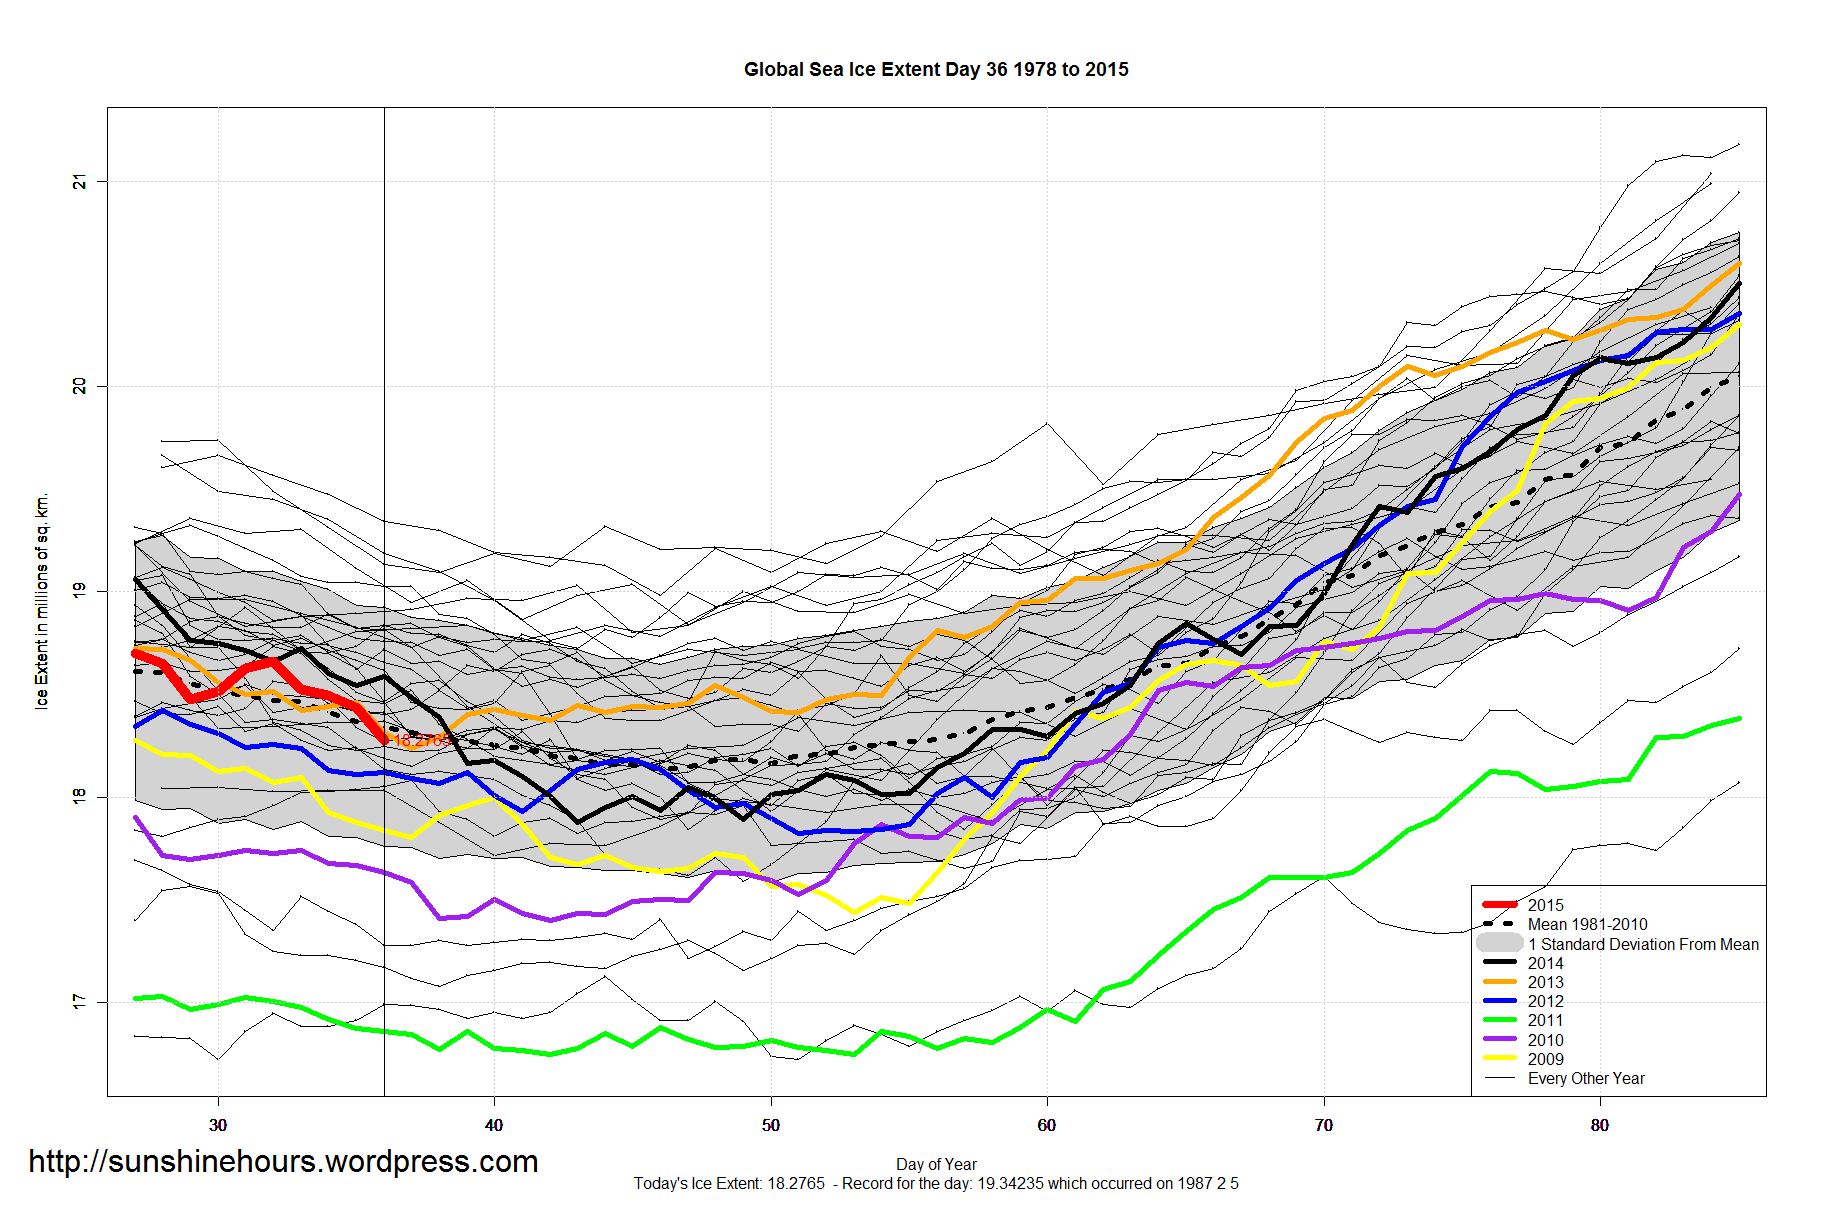
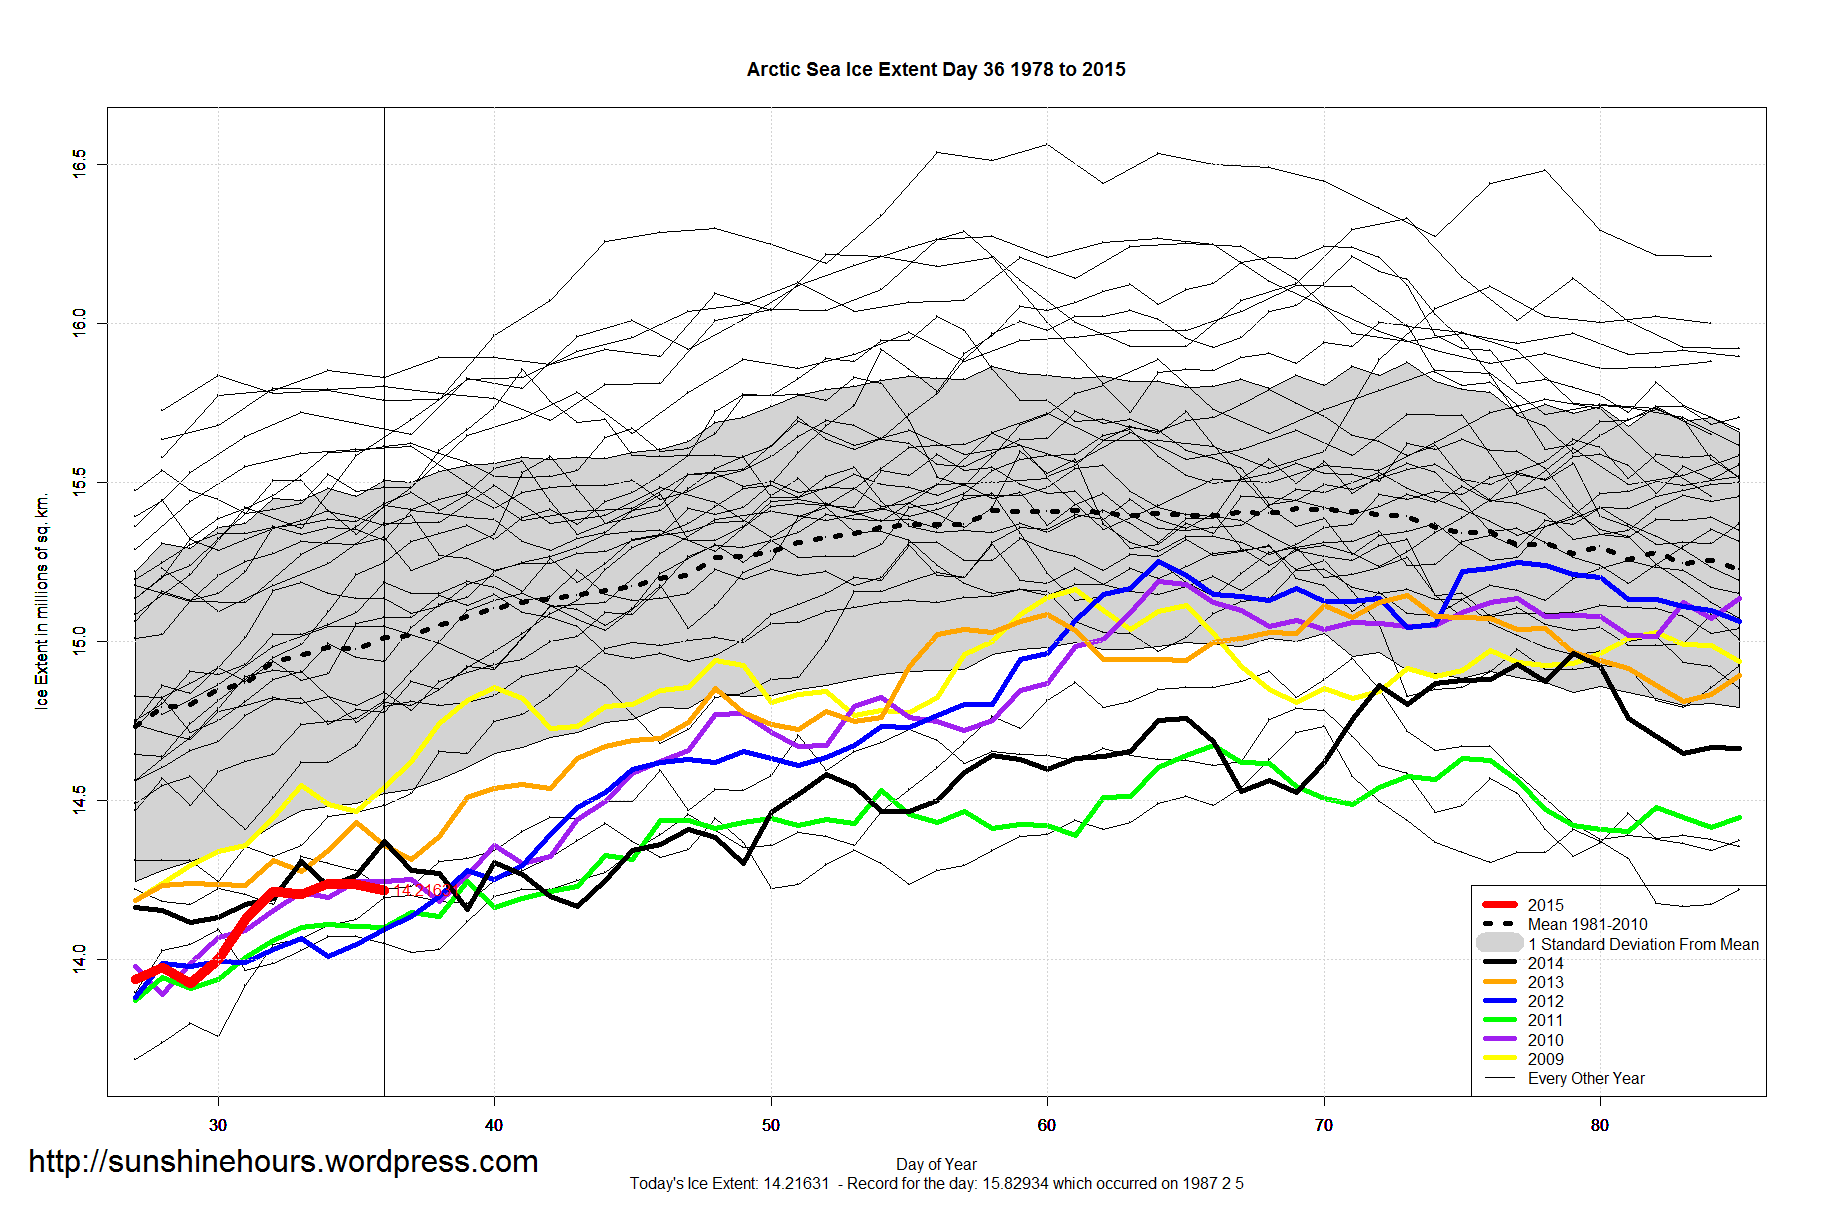
Sea Ice Extent – Day 36
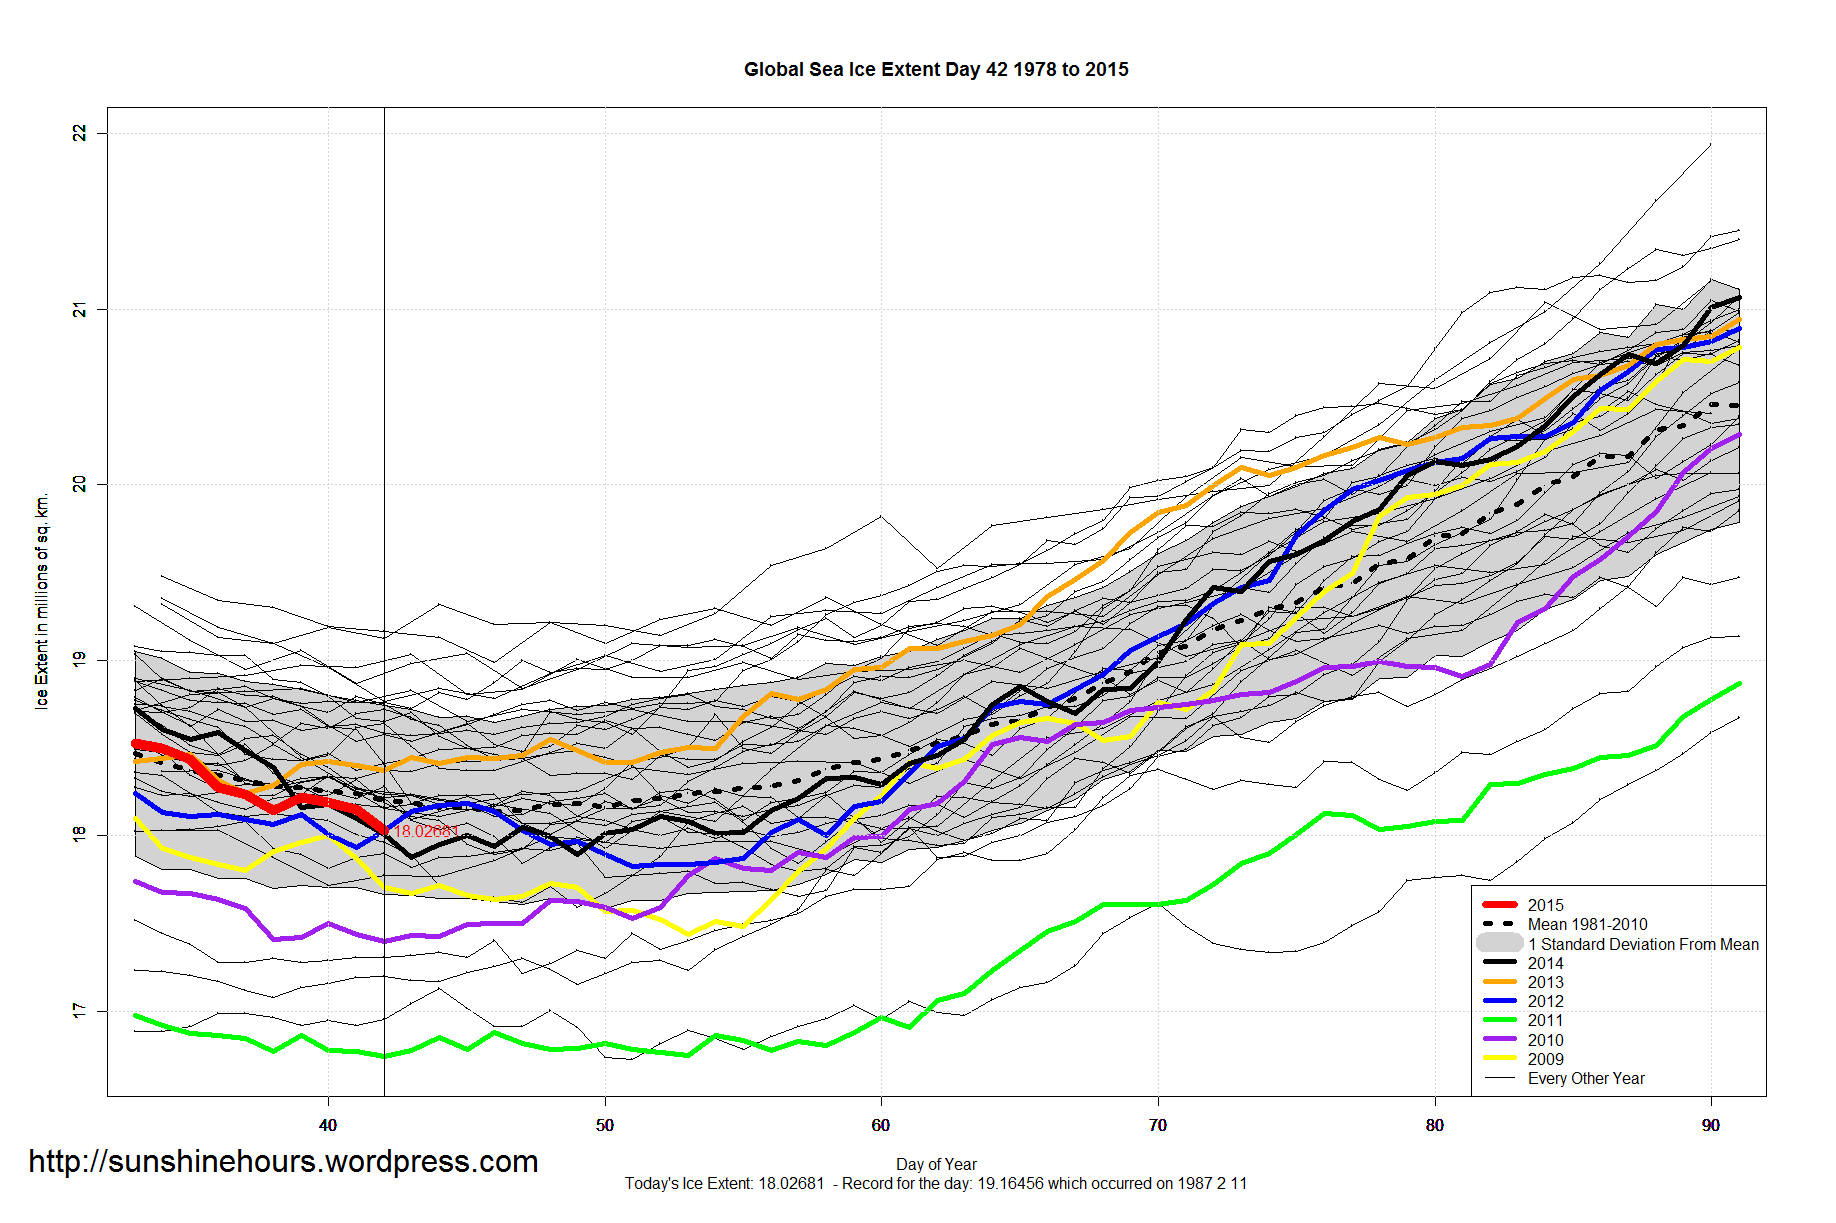
Sea Ice Extent – Day 34 – Global Sea Ice Above Mean (And 1984 1985 1993 1996 1997 1999 2000 2002 2004 2005 2006 2007 2009 2010 2011 2012)


Climate “Scientists” Telling Big Fat Lies
Big Fat Lie: “Sceptics who still doubt anthropogenic climate change have now been stripped of one of their last-ditch arguments: It is true that there has been a warming hiatus and that the surface of the earth has warmed up much less rapidly since the turn of the millennium than all the relevant climate models had predicted. However, the gap between the calculated and measured warming is not due to systematic errors of the models, as the sceptics had suspected, but because there are always random fluctuations in the Earth’s climate.“
Briggs: “No. No. No. It is as simple and no more difficult than this. A climate model consistently says the temperatures will be way up here, and reality just as consistently fails to cooperate and puts temperatures way down there. That model is therefore a failure. It is busted. It is broken. It is not right. It should not be trusted. It should not be used as a basis for any decision. It is wrong.”
Read It All
