Sea Ice Extent (Global Antarctic and Arctic) – Day 7 Published on January 8, 2016January 8, 2016 by sunshinehours1 South / North Share this: Share on X (Opens in new window) X Share on Facebook (Opens in new window) Facebook Like Loading... Related
The graph above from NOAA shows extent just above 13 M km2 compared to MASIE at 13.7M. For January NOAA is averaging 600k km2 less than MASIE. https://rclutz.wordpress.com/2016/01/07/hot-air-about-arctic-ice/ Reply
That means that difference of 0.7million km2 is hidden in low ice concentration 0-15% that NOAA doesn’t show but MASIE does…. Reply
The difference of 0.7million km2 means that MASIE shows ice concentration from 0-100% but NOAA just from 15-100%. Can someone chech this? Reply
Difference of 0.7million km2 means an amount of ice concentration from 0 to 15%. NOAA shows ice concentration from 15 to 100% but MASIE from 0 to 100%. Could someone check this? Reply
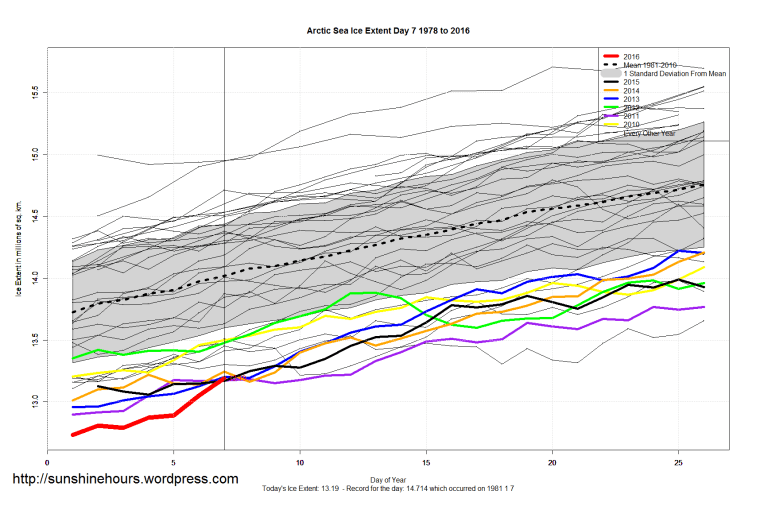

The graph above from NOAA shows extent just above 13 M km2 compared to MASIE at 13.7M. For January NOAA is averaging 600k km2 less than MASIE.
https://rclutz.wordpress.com/2016/01/07/hot-air-about-arctic-ice/
That means that difference of 0.7million km2 is hidden in low ice concentration 0-15% that NOAA doesn’t show but MASIE does….
The difference of 0.7million km2 means that MASIE shows ice concentration from 0-100% but NOAA just from 15-100%. Can someone chech this?
Difference of 0.7million km2 means an amount of ice concentration from 0 to 15%. NOAA shows ice concentration from 15 to 100% but MASIE from 0 to 100%. Could someone check this?