Not bad for the year after the strongest El Nino ever recoded & I’m also expecting even greater extent in 2018, probably back to 2013-14 levels.
The full recovery will happen when the AMO goes back to cool phase.
Lulú354 I don’t trust NASA on global temperatures estimates.
Both the Pacific and the Atlantic are presently cooling and solar radiations are very low, almost at cycle minimum levels. These two factors indicate that 2018 will be colder than 2017.
Our present situation is similar to 2007-08, when the world cooled strongly due to a La Nina and very low solar activity, http://www.woodfortrees.org/plot/rss/from:1998
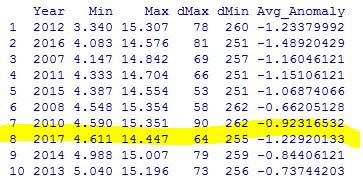
The fact that the Arctic minimum ice extent this year is larger than the 2008 and 2010 – 1st table in this post of Sunshinehours – shows that the oceans were, in general, colder in 2016 than in 2007 – despite similar ice extents in both years. This in fact indicates the powerful cooling effect of the Sun during the present cycle, despite the relatively large 2nd peak (2014-15) that worked as a trigger for the 2015-16 El Nino – the Pacific ocean was very warm up to the beginning of this year, enough to bring the ENSO region back to a short warm phase, after the La NIna of the last months of 2016.
In my opinion, solar activity and oceanic oscillations explain the entire evolution of Earth’s temperatures in the last decade.
Most temperature records are a joke. But if CO2 were causing warming, it has failed to do so in the USA in the summer. The 1936 and 1934 are still hottest JJA.
Those two are far, far more indicative of changes in Global energy balance than sea ice cover, which is affected by many different factors including the Jetstream.


Kara and Barents seas SSTs still much colder than last year, especially along where the existing ice is:
Sept 18, 2016

sept 18, 2017

Refreeze should Rock!
Not bad for the year after the strongest El Nino ever recoded & I’m also expecting even greater extent in 2018, probably back to 2013-14 levels.
The full recovery will happen when the AMO goes back to cool phase.
Reblogged this on ecoliberty.
Dmh, El Niño ended 1 year ago and we still having the 2° global hotest august by. NASA
A statistical tie between 2011, 1936 and 1937 for Max Temp in USA.
Too bad global doesn’t show max or min.
Lulú354 I don’t trust NASA on global temperatures estimates.
Both the Pacific and the Atlantic are presently cooling and solar radiations are very low, almost at cycle minimum levels. These two factors indicate that 2018 will be colder than 2017.
Our present situation is similar to 2007-08, when the world cooled strongly due to a La Nina and very low solar activity,
http://www.woodfortrees.org/plot/rss/from:1998
The fact that the Arctic minimum ice extent this year is larger than the 2008 and 2010 – 1st table in this post of Sunshinehours – shows that the oceans were, in general, colder in 2016 than in 2007 – despite similar ice extents in both years. This in fact indicates the powerful cooling effect of the Sun during the present cycle, despite the relatively large 2nd peak (2014-15) that worked as a trigger for the 2015-16 El Nino – the Pacific ocean was very warm up to the beginning of this year, enough to bring the ENSO region back to a short warm phase, after the La NIna of the last months of 2016.
In my opinion, solar activity and oceanic oscillations explain the entire evolution of Earth’s temperatures in the last decade.
But the important issue is not temp in one country. The important stuff are globlal temps
Most temperature records are a joke. But if CO2 were causing warming, it has failed to do so in the USA in the summer. The 1936 and 1934 are still hottest JJA.
And Antartic? Is it lowest maximum for 2017?
Antarctic ice cap – as opposed to sea ice cover – is in fact increasing in mass.


NASA Study: Mass Gains of Antarctic Ice Sheet Greater than Losses
https://www.nasa.gov/feature/goddard/nasa-study-mass-gains-of-antarctic-ice-sheet-greater-than-losses
As is the Greenland ice cap.
http://beta.dmi.dk/en/groenland/maalinger/greenland-ice-sheet-surface-mass-budget
Those two are far, far more indicative of changes in Global energy balance than sea ice cover, which is affected by many different factors including the Jetstream.
Antarctic ice cap – as opposed to sea ice cover – is in fact increasing in mass.
NASA Study: Mass Gains of Antarctic Ice Sheet Greater than Losses

https://www.nasa.gov/feature/goddard/nasa-study-mass-gains-of-antarctic-ice-sheet-greater-than-losses
As is the Greenland ice cap.

http://beta.dmi.dk/en/groenland/maalinger/greenland-ice-sheet-surface-mass-budget
Those two are far, far more indicative of changes in Global energy balance than sea ice cover, which is affected by many different factors including the Jetstream.