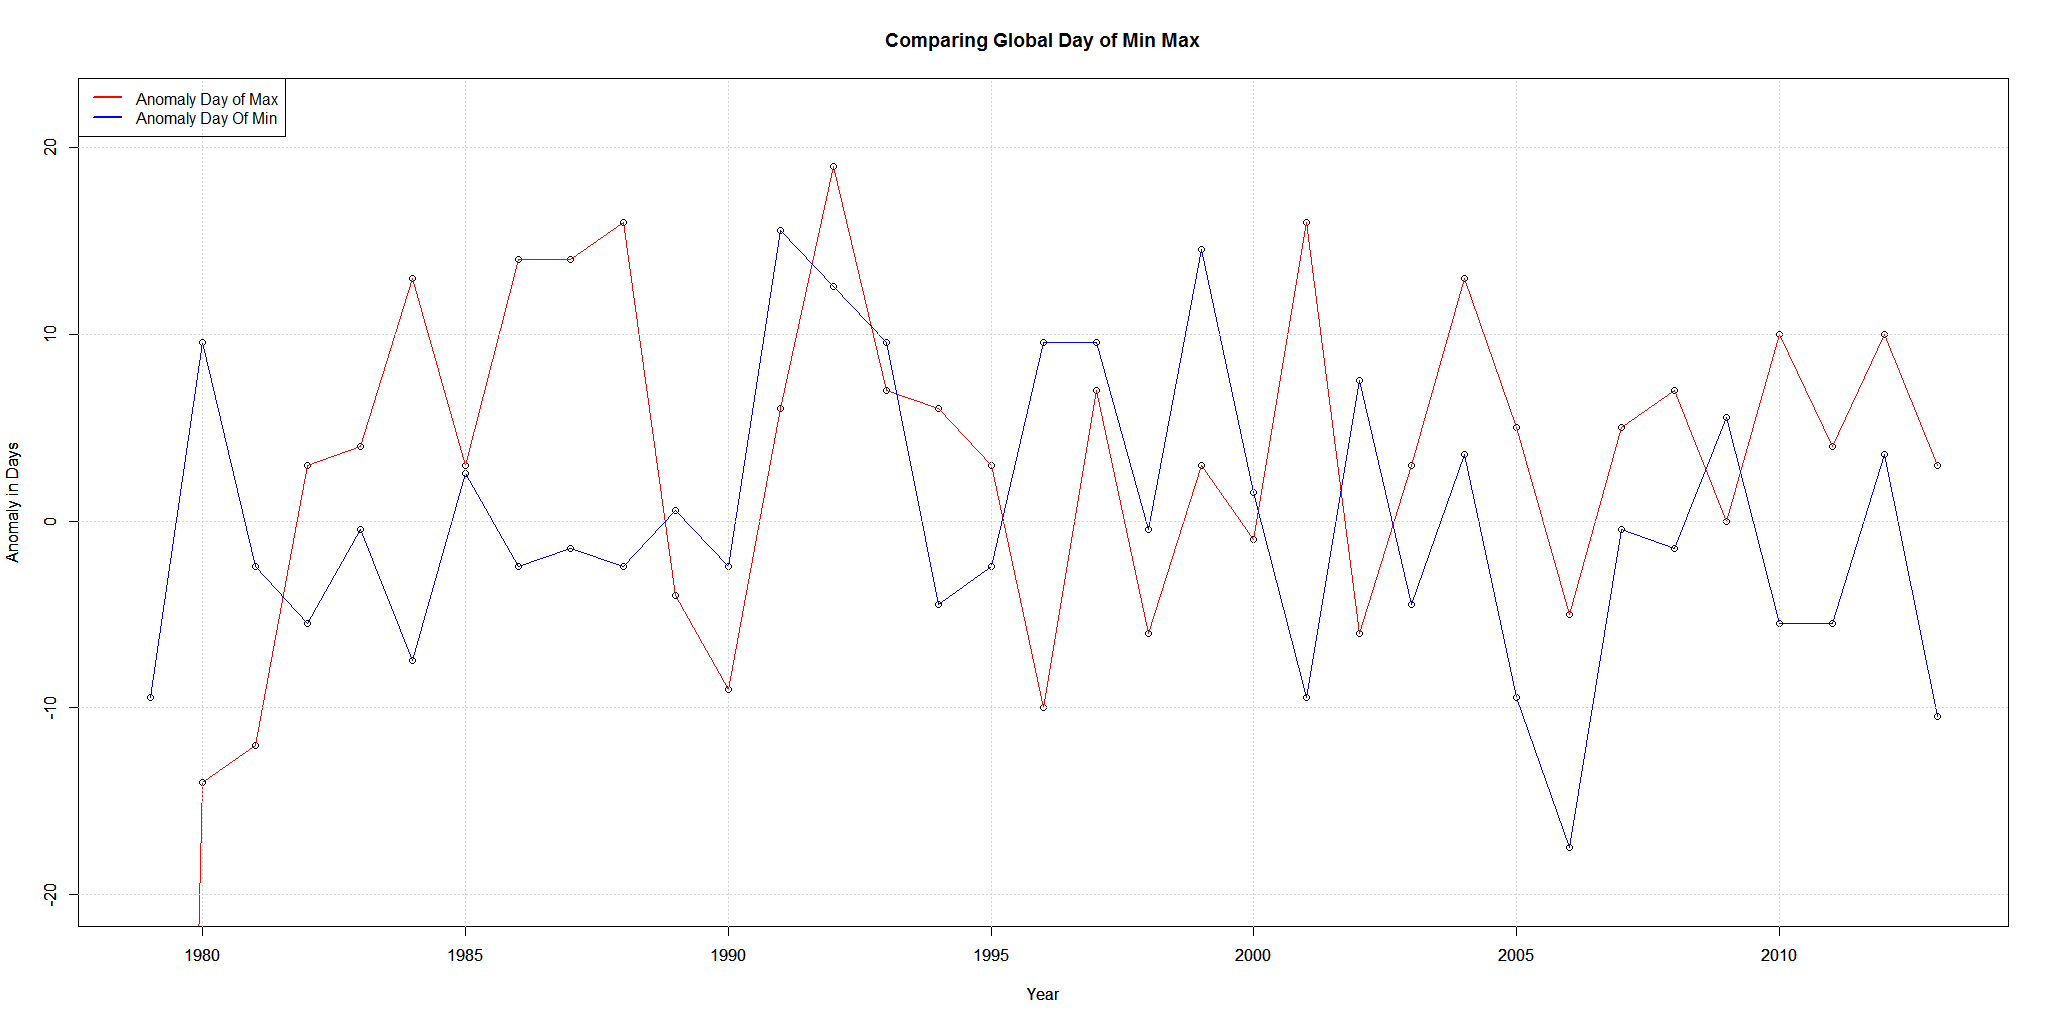
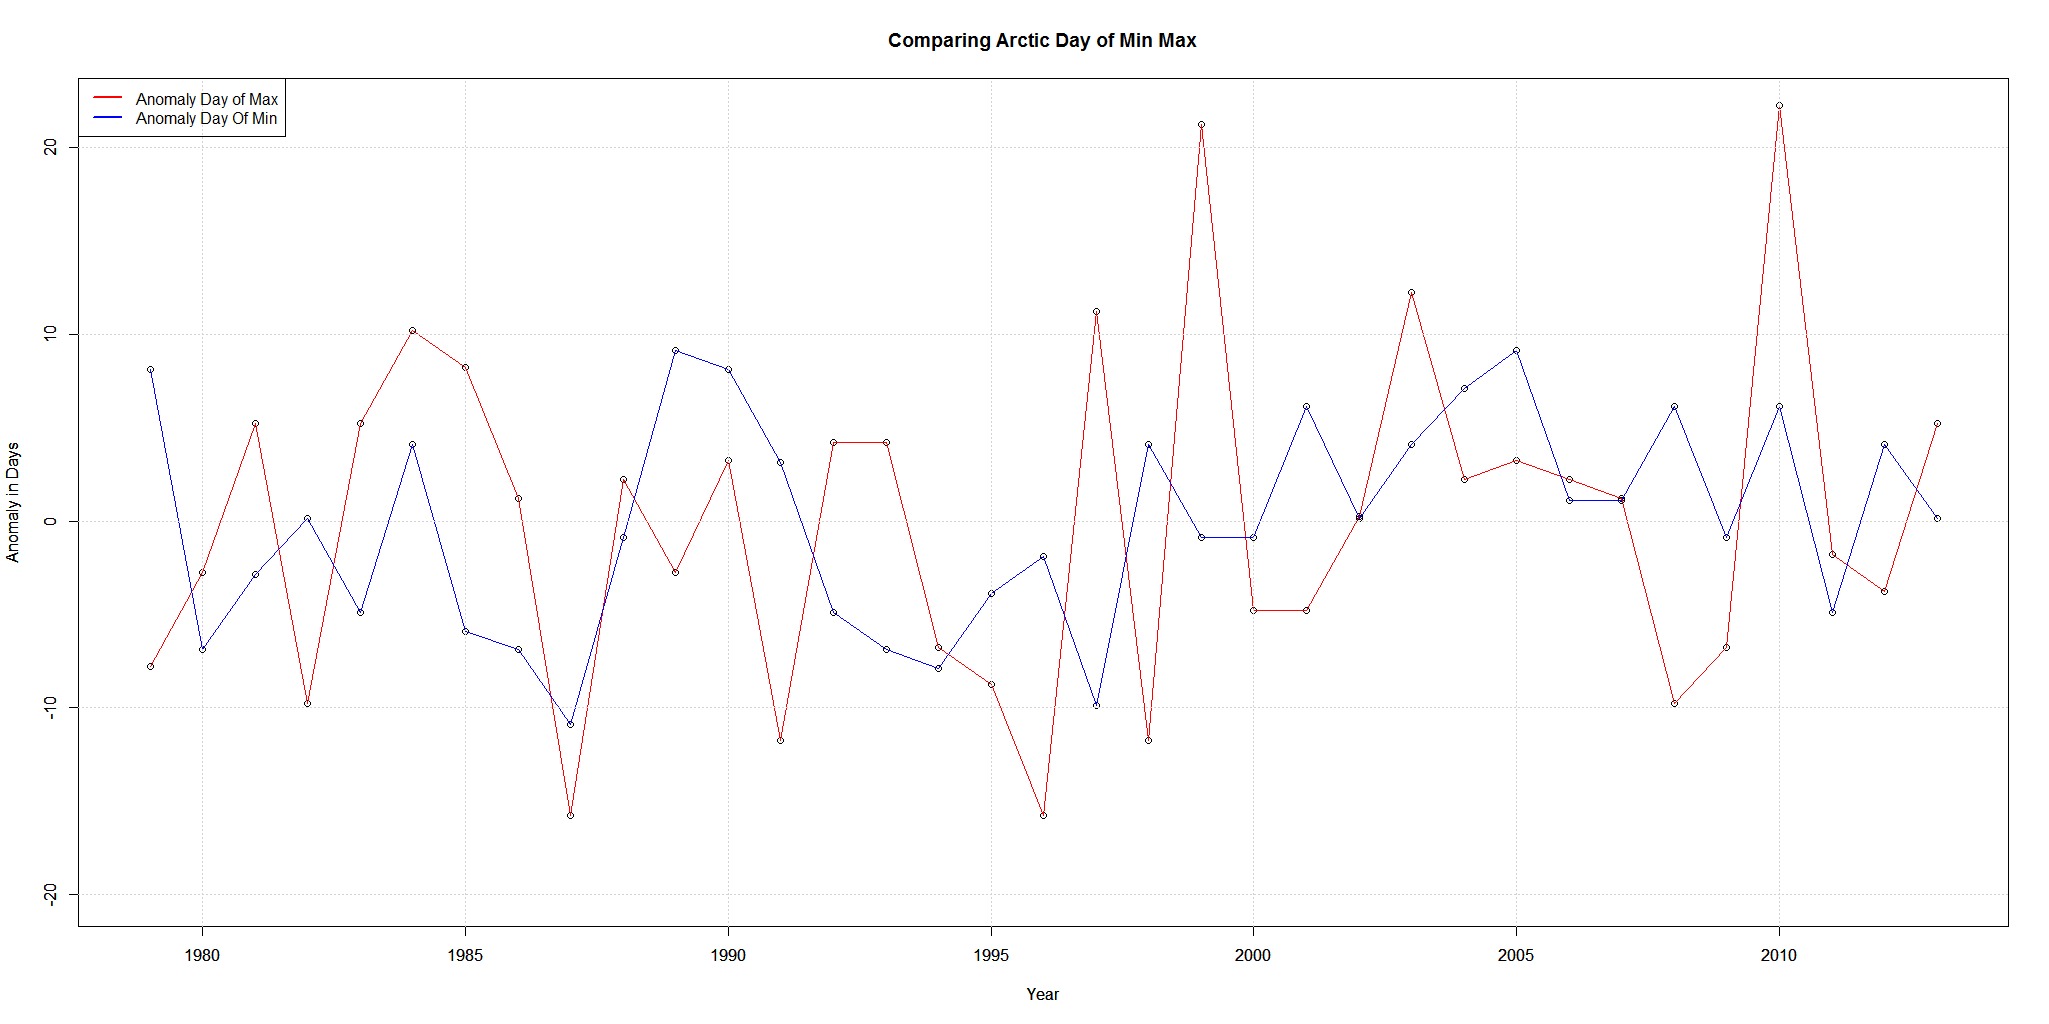
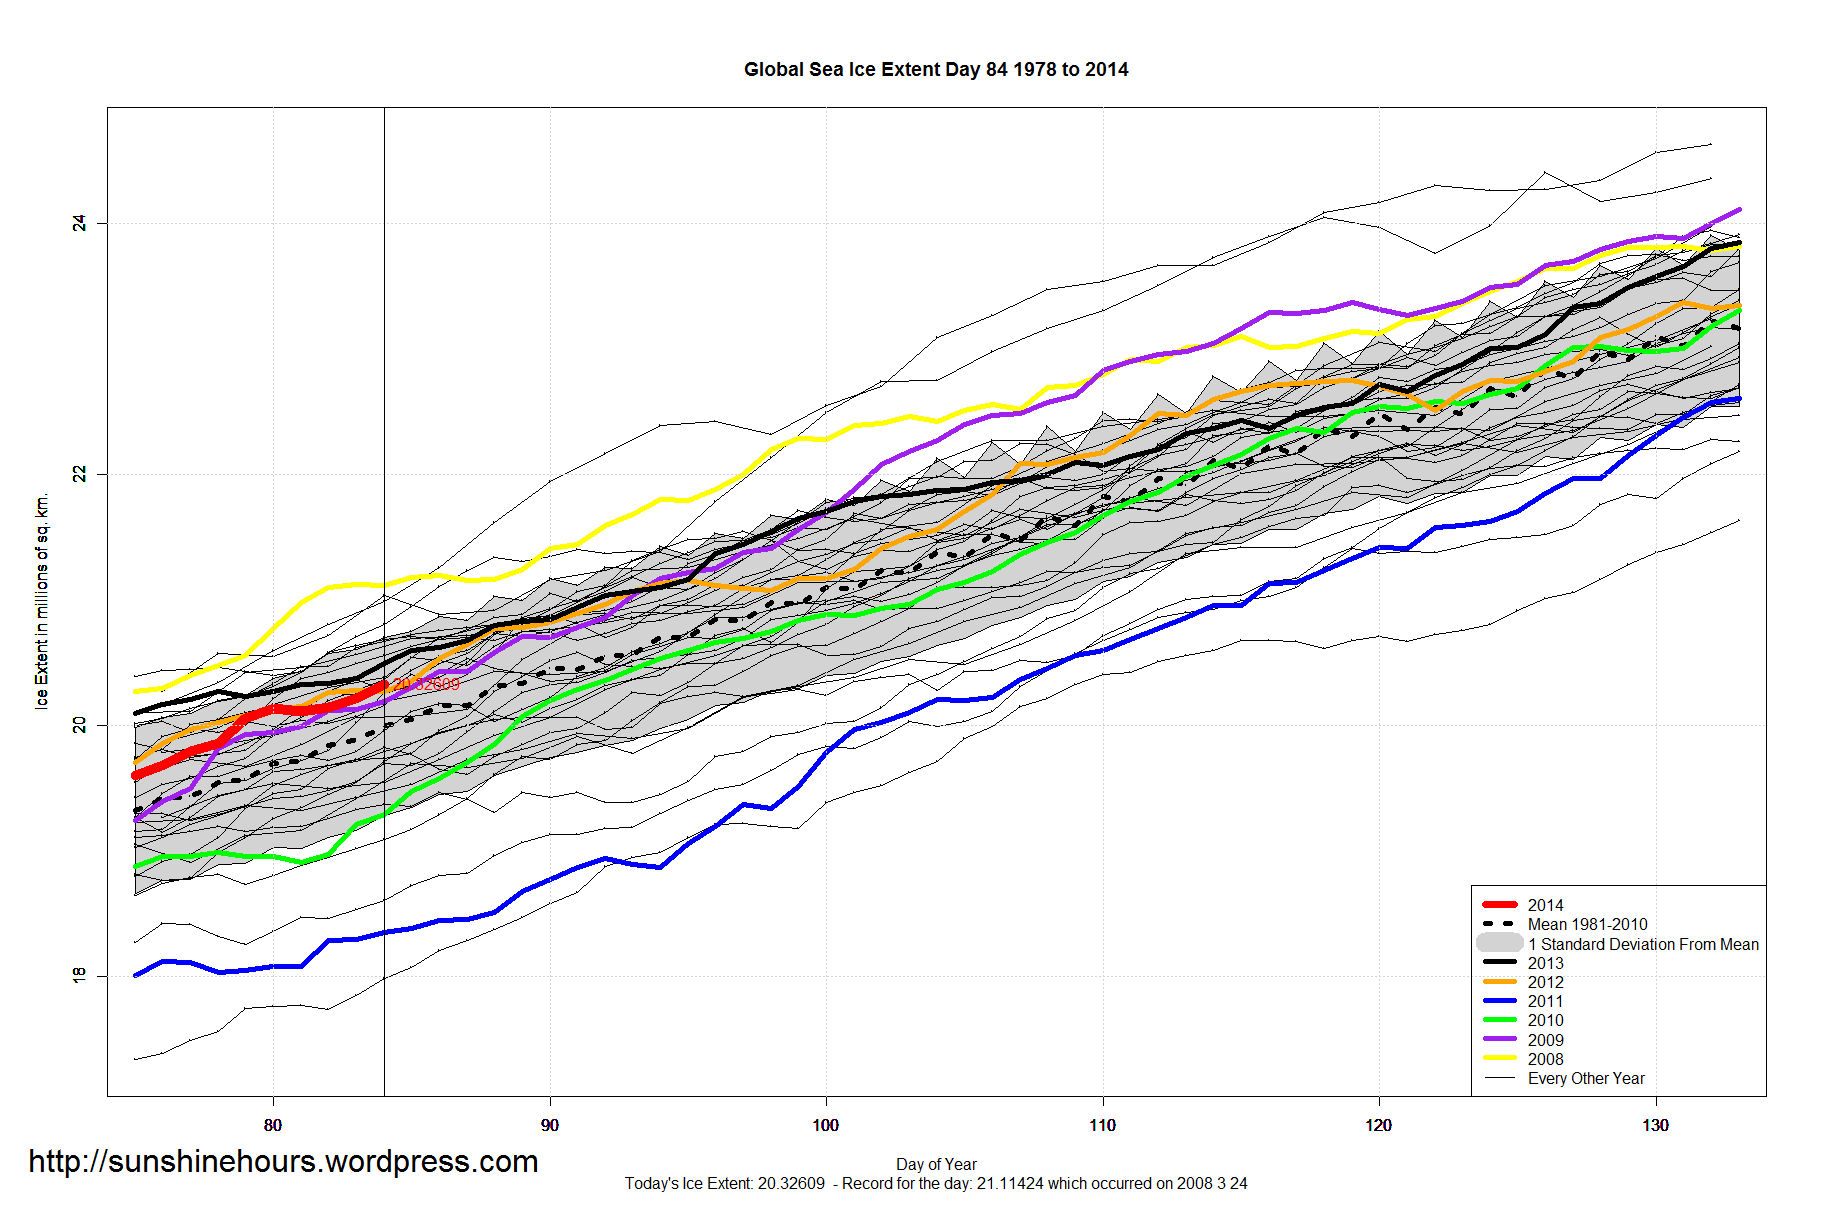
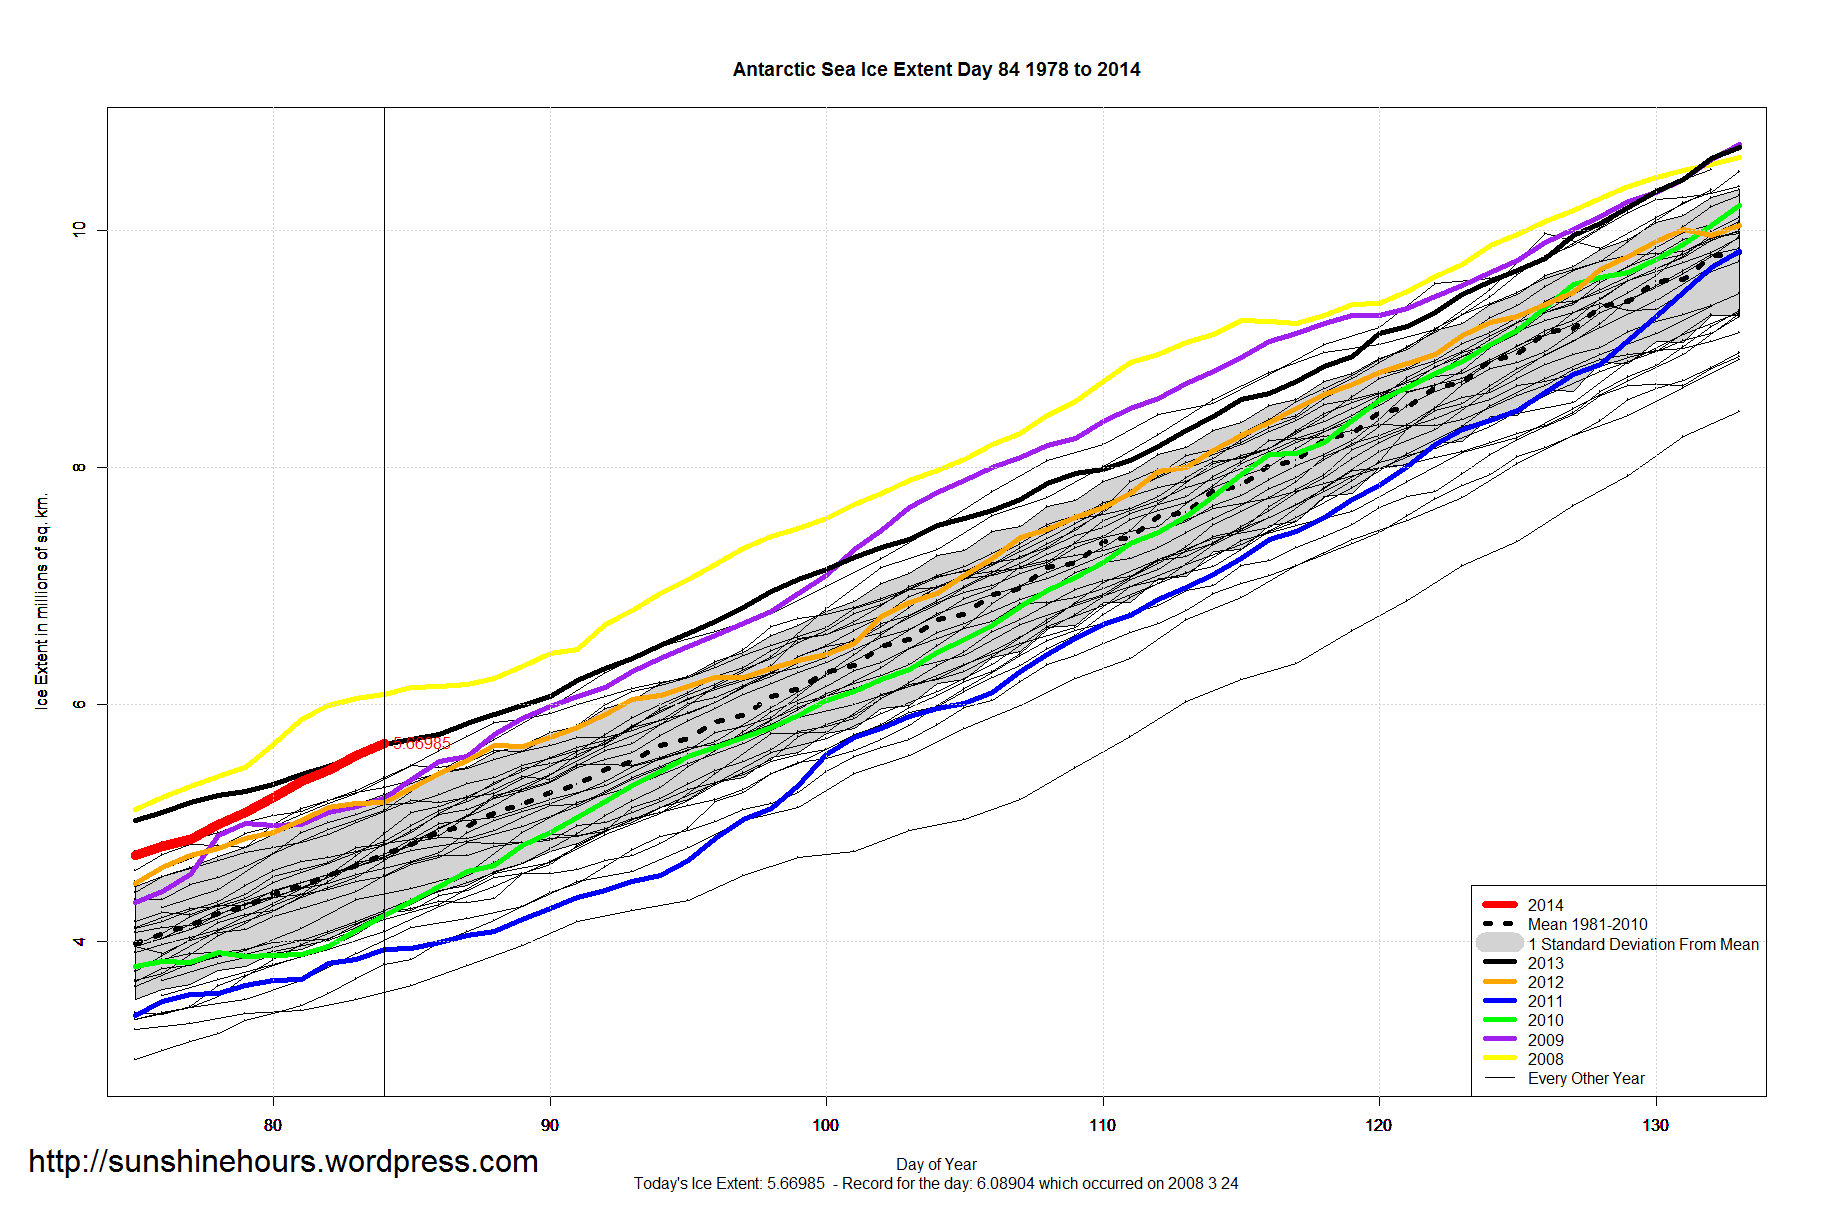
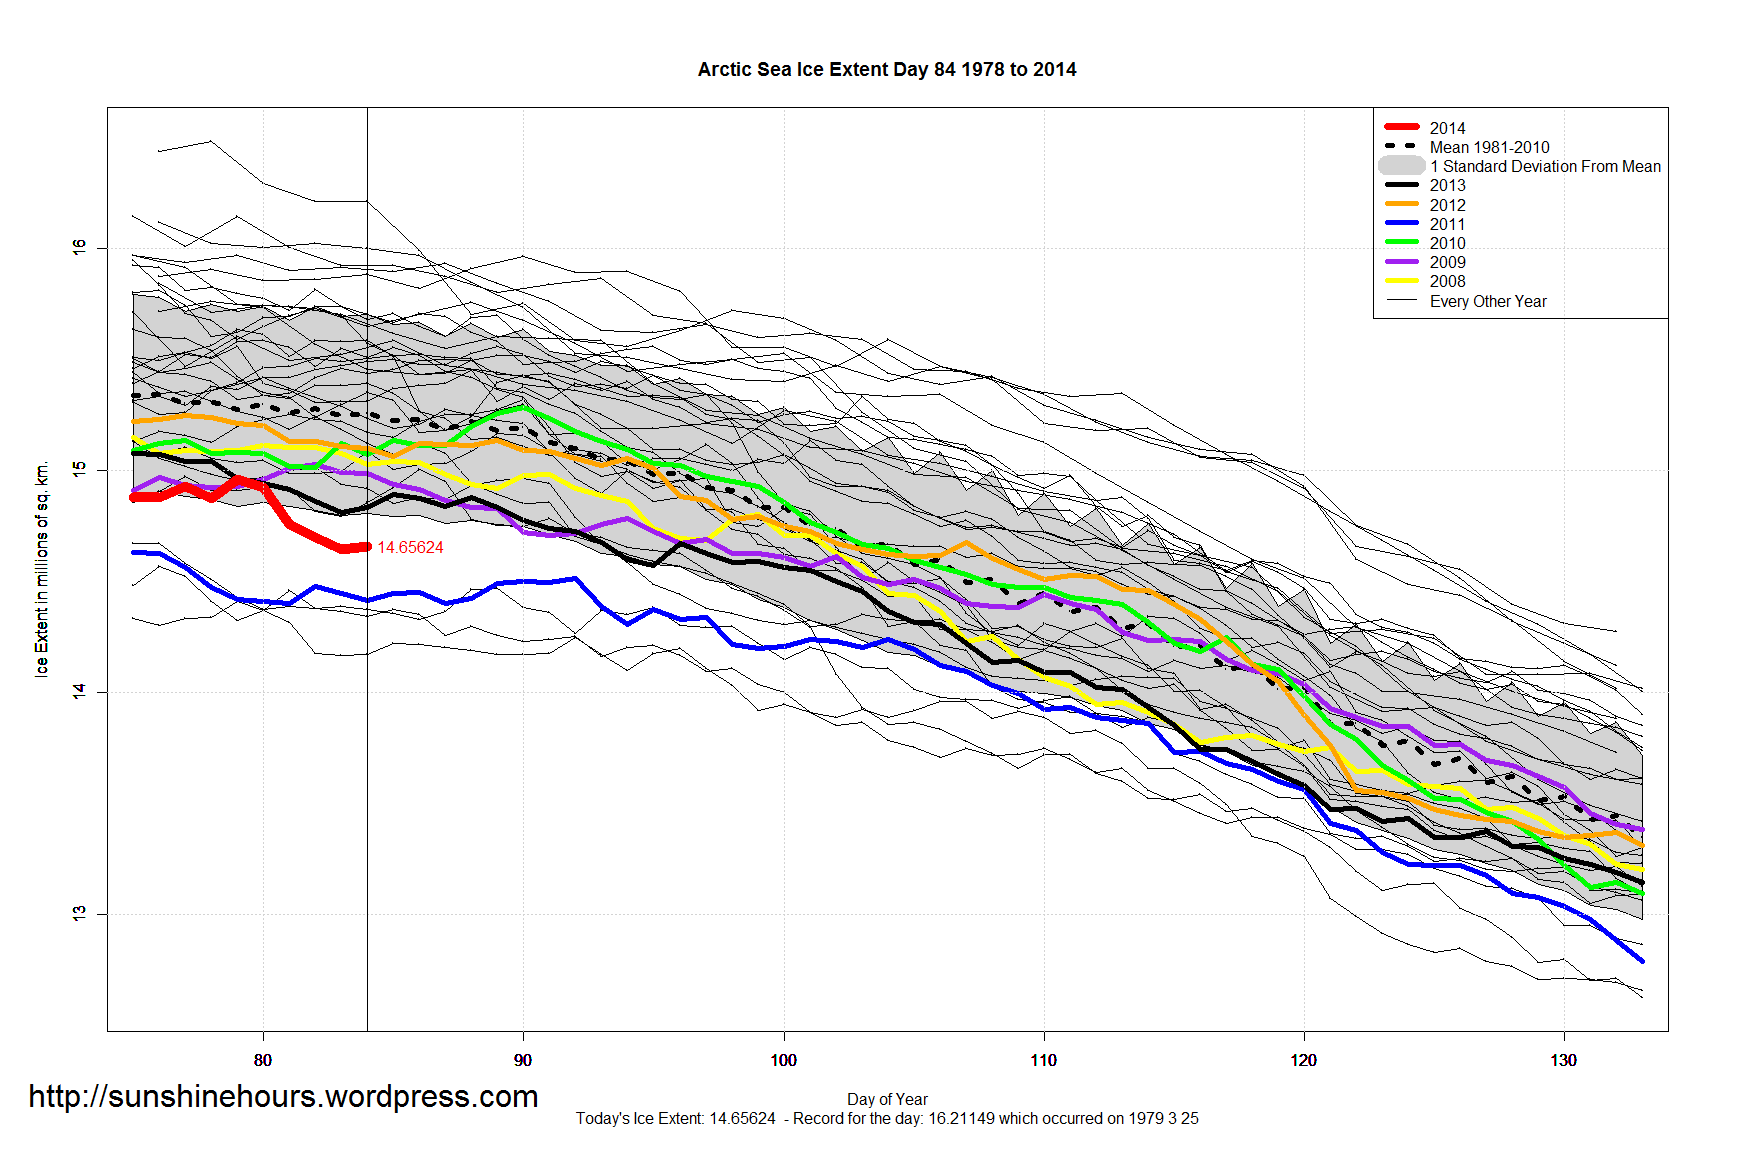
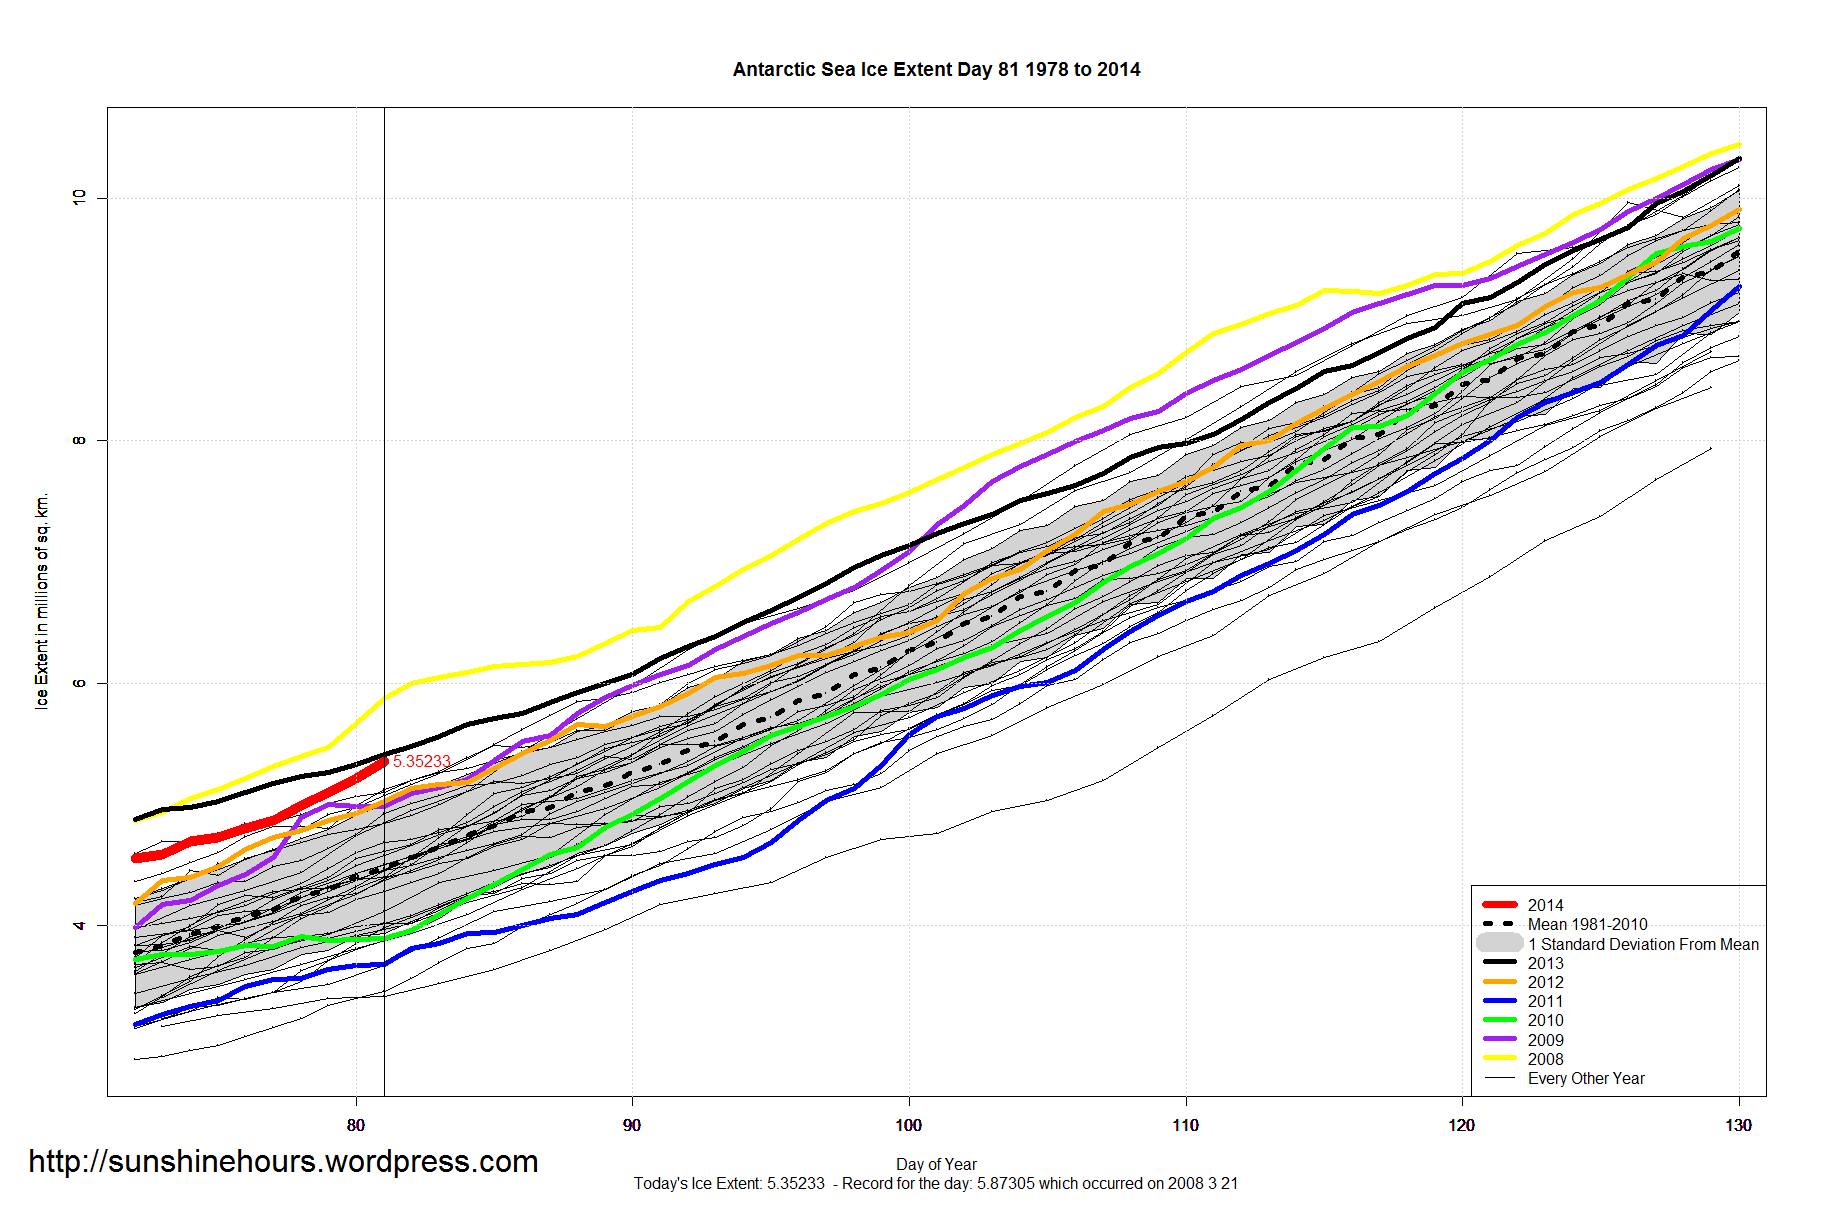
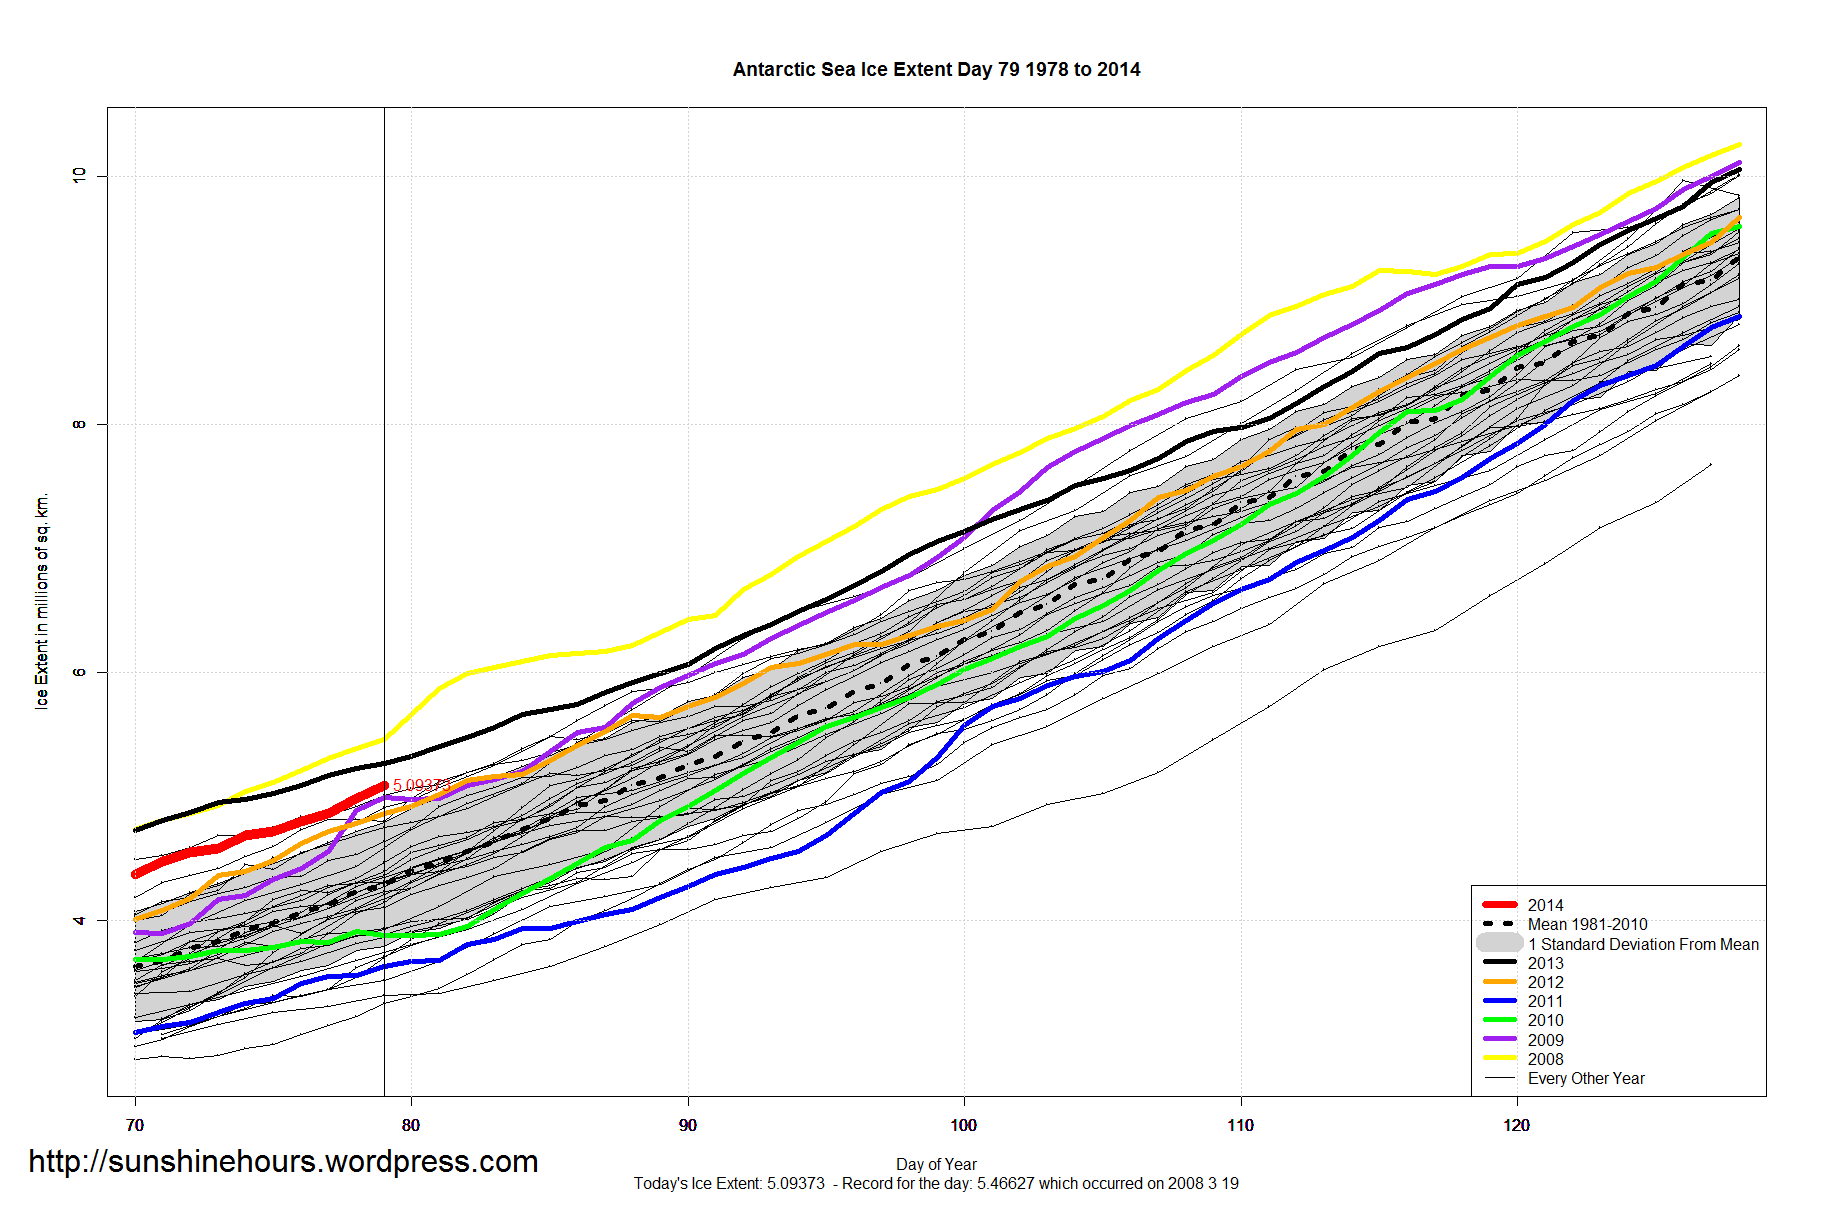
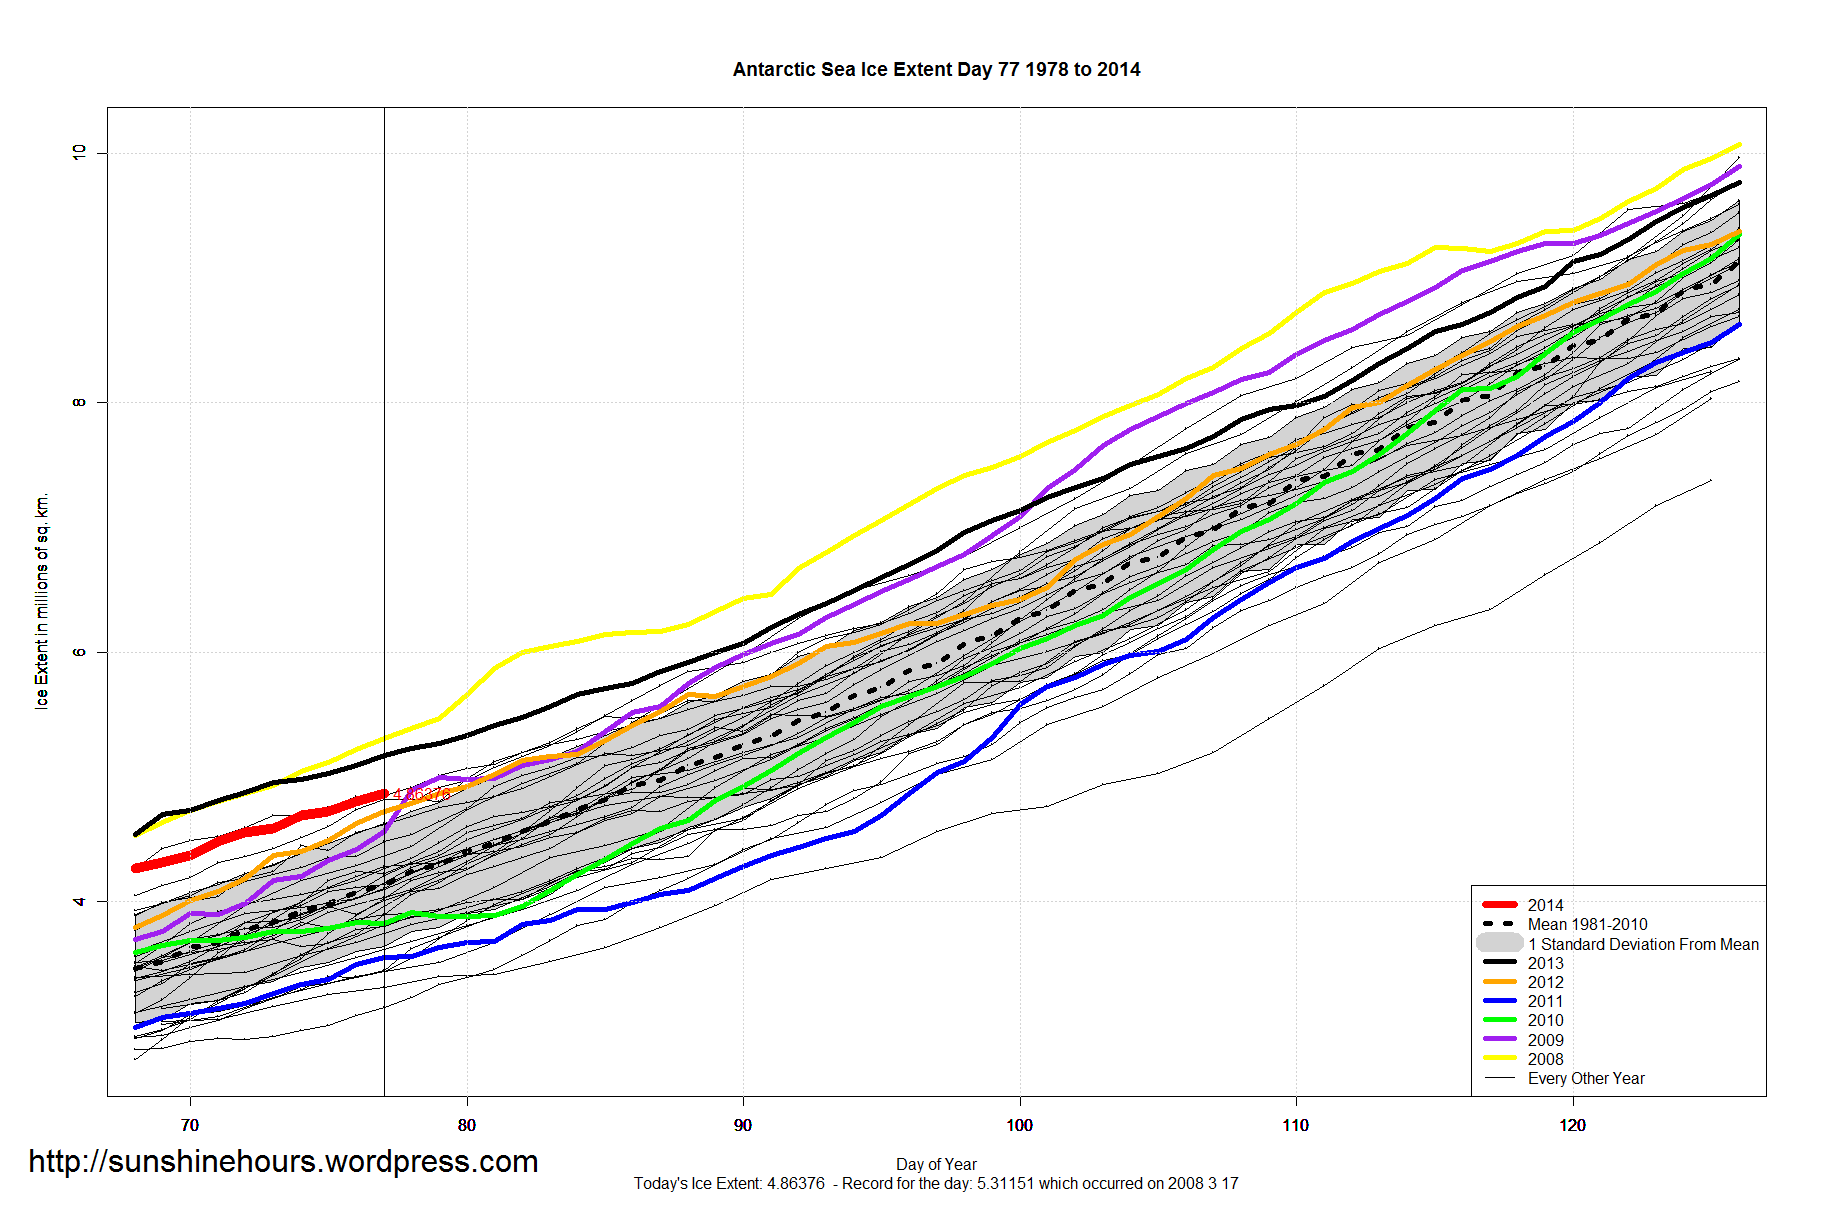
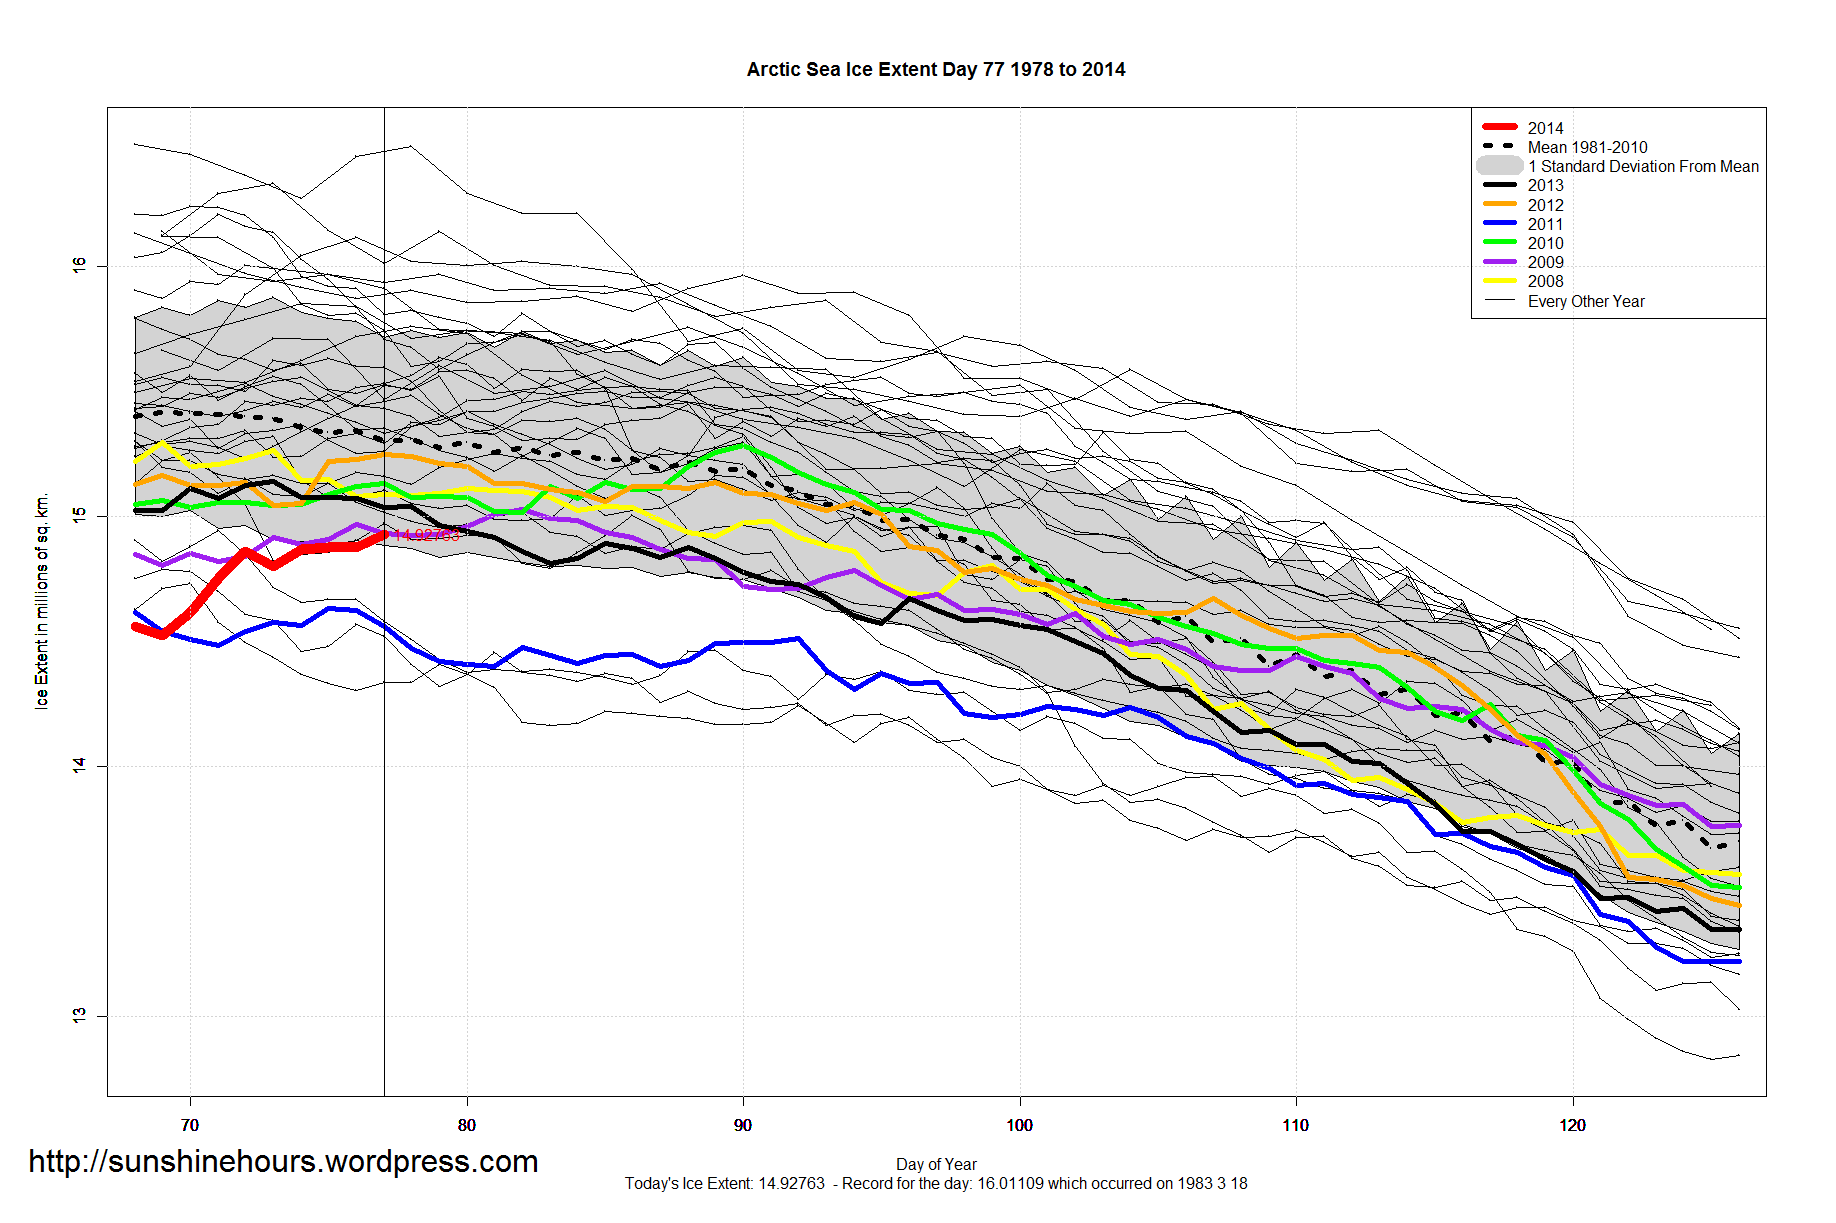
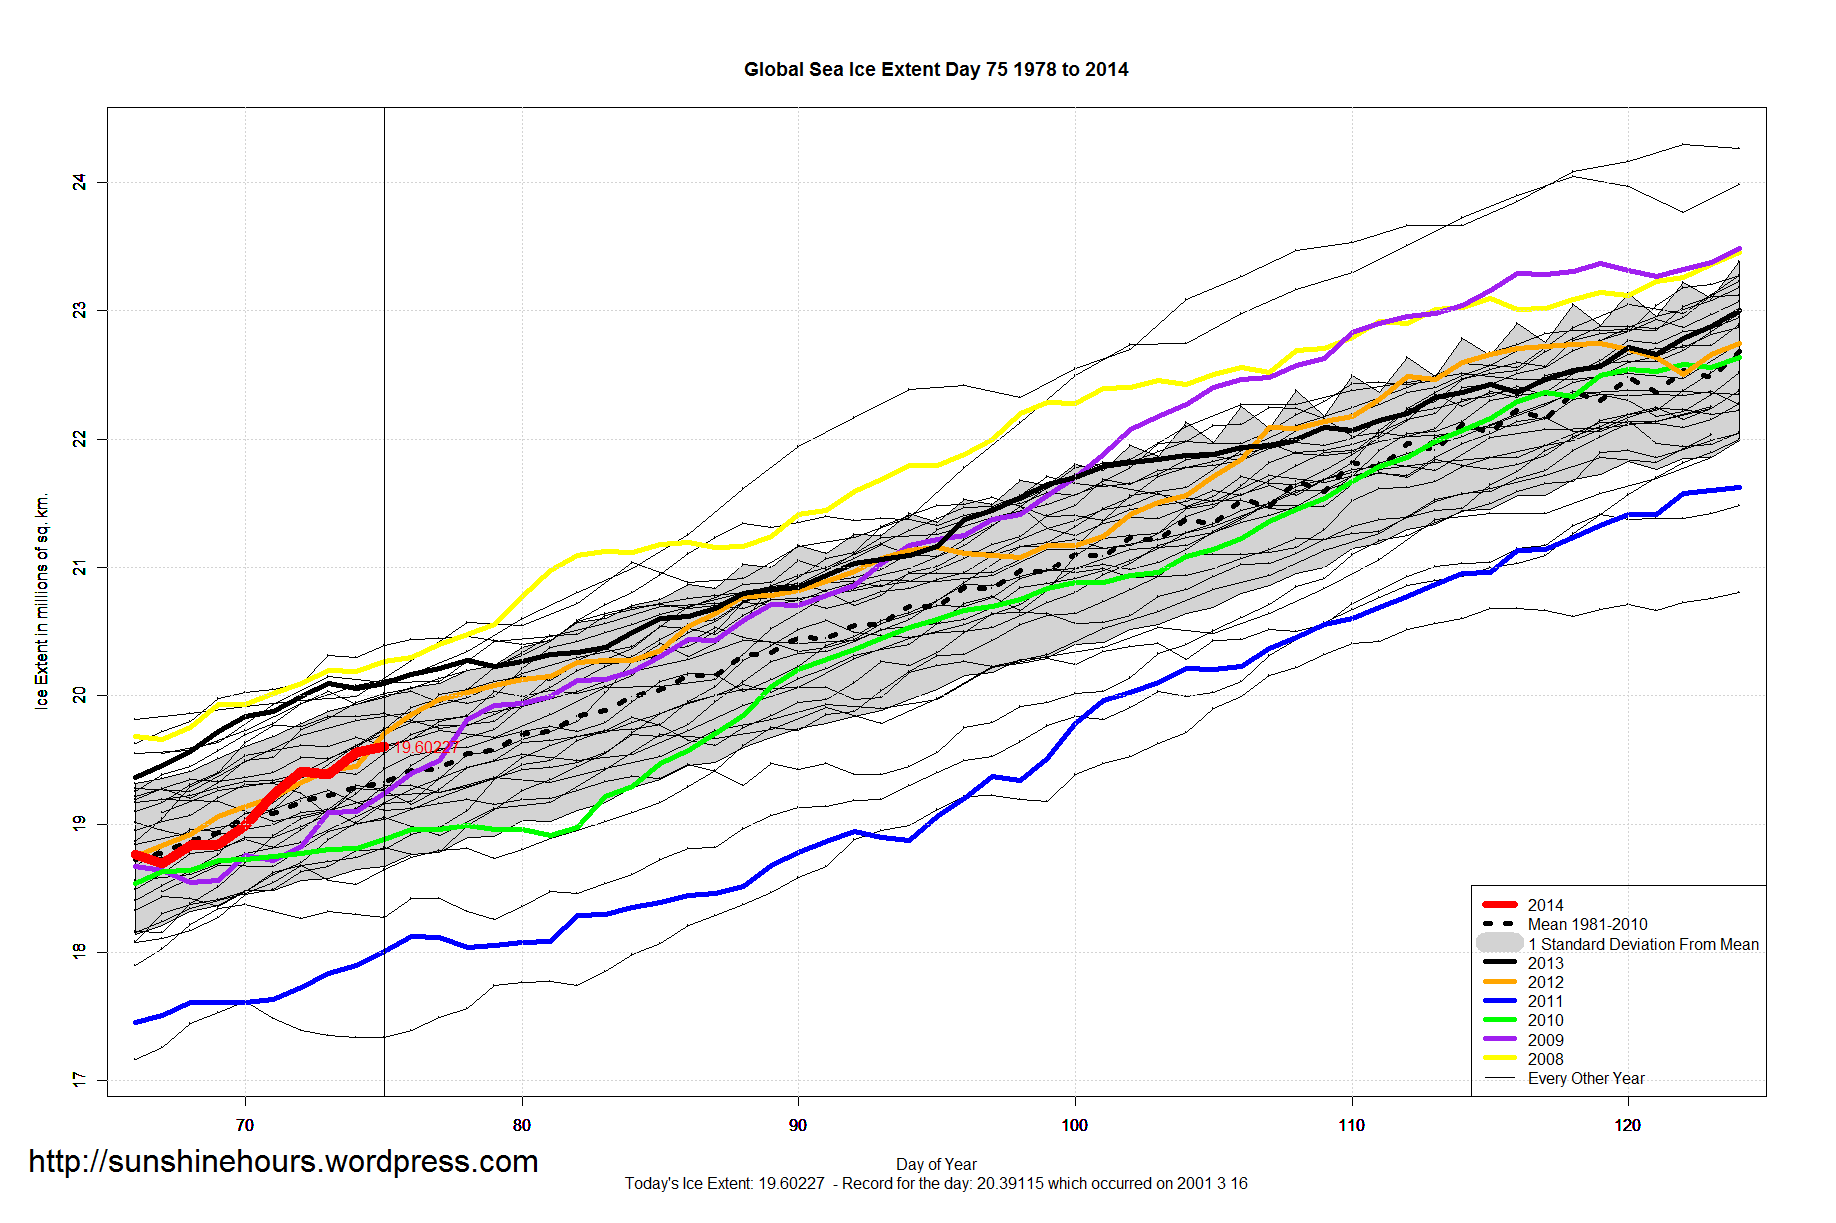
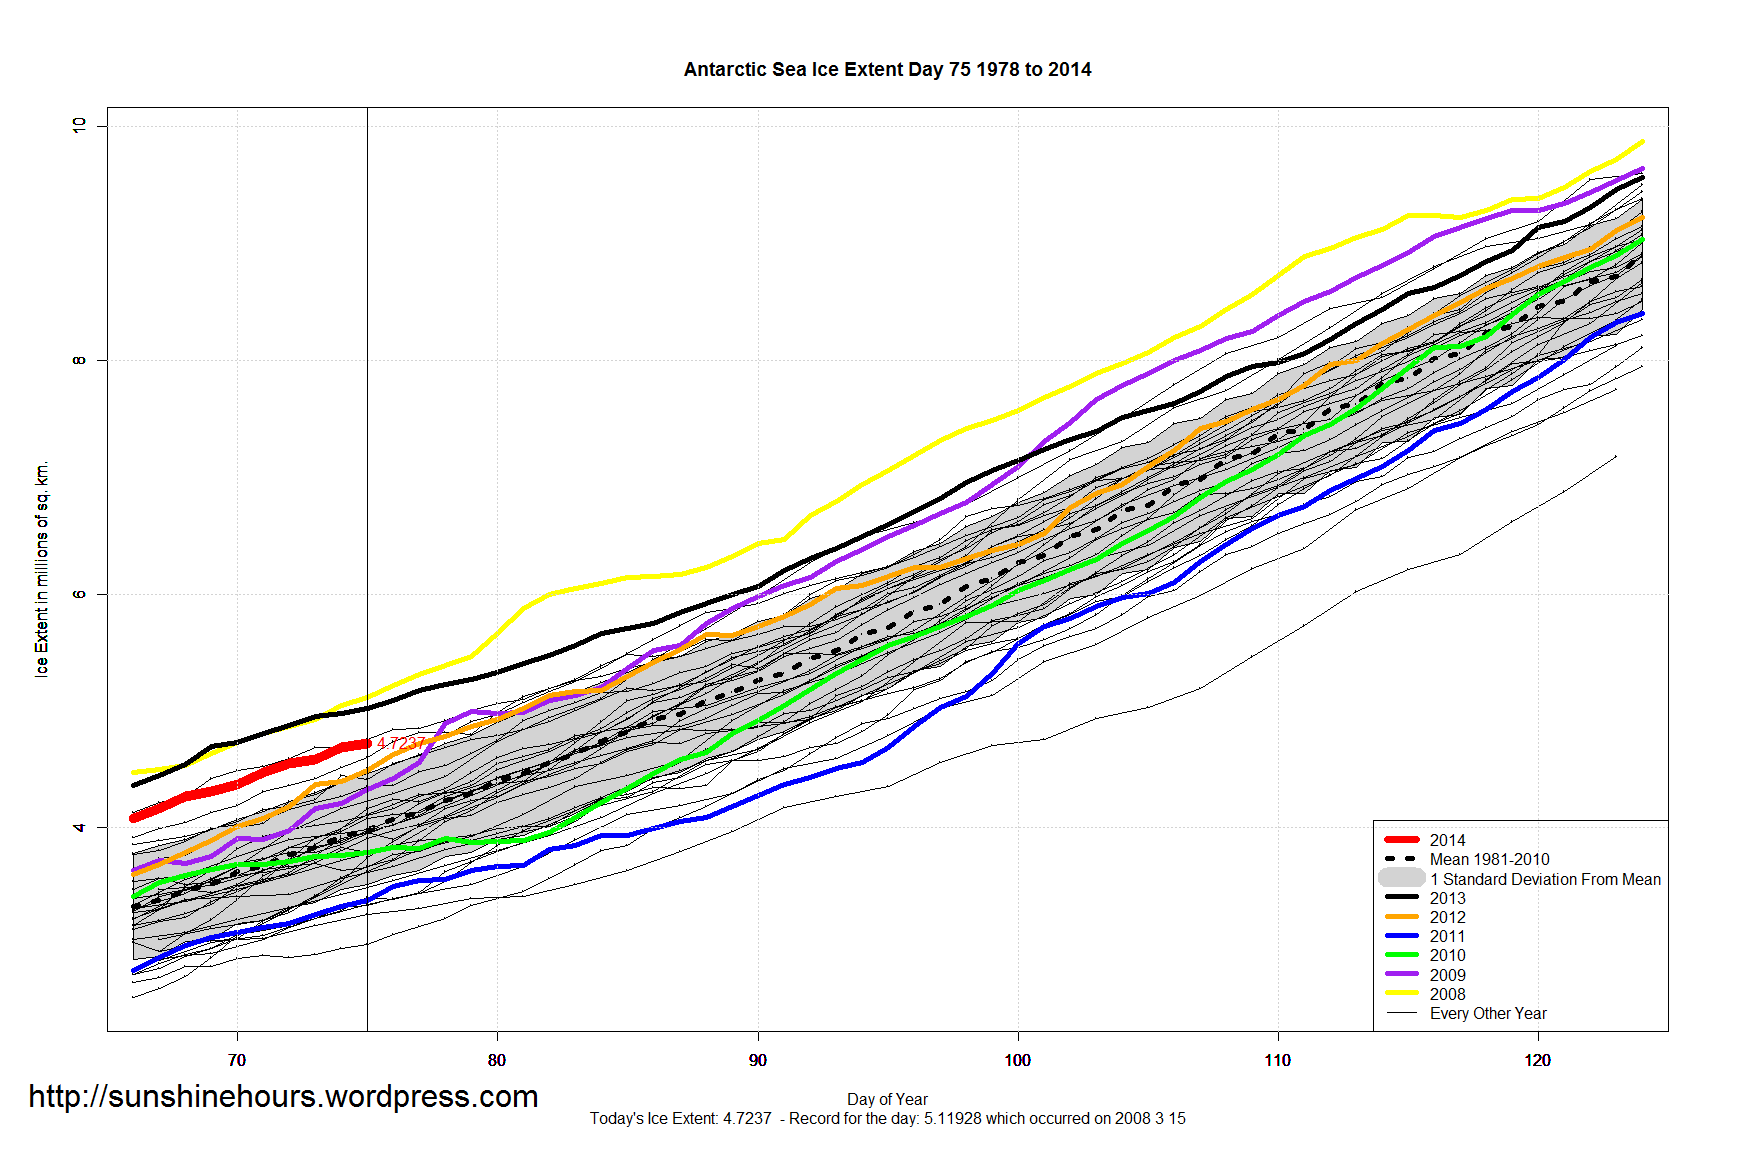
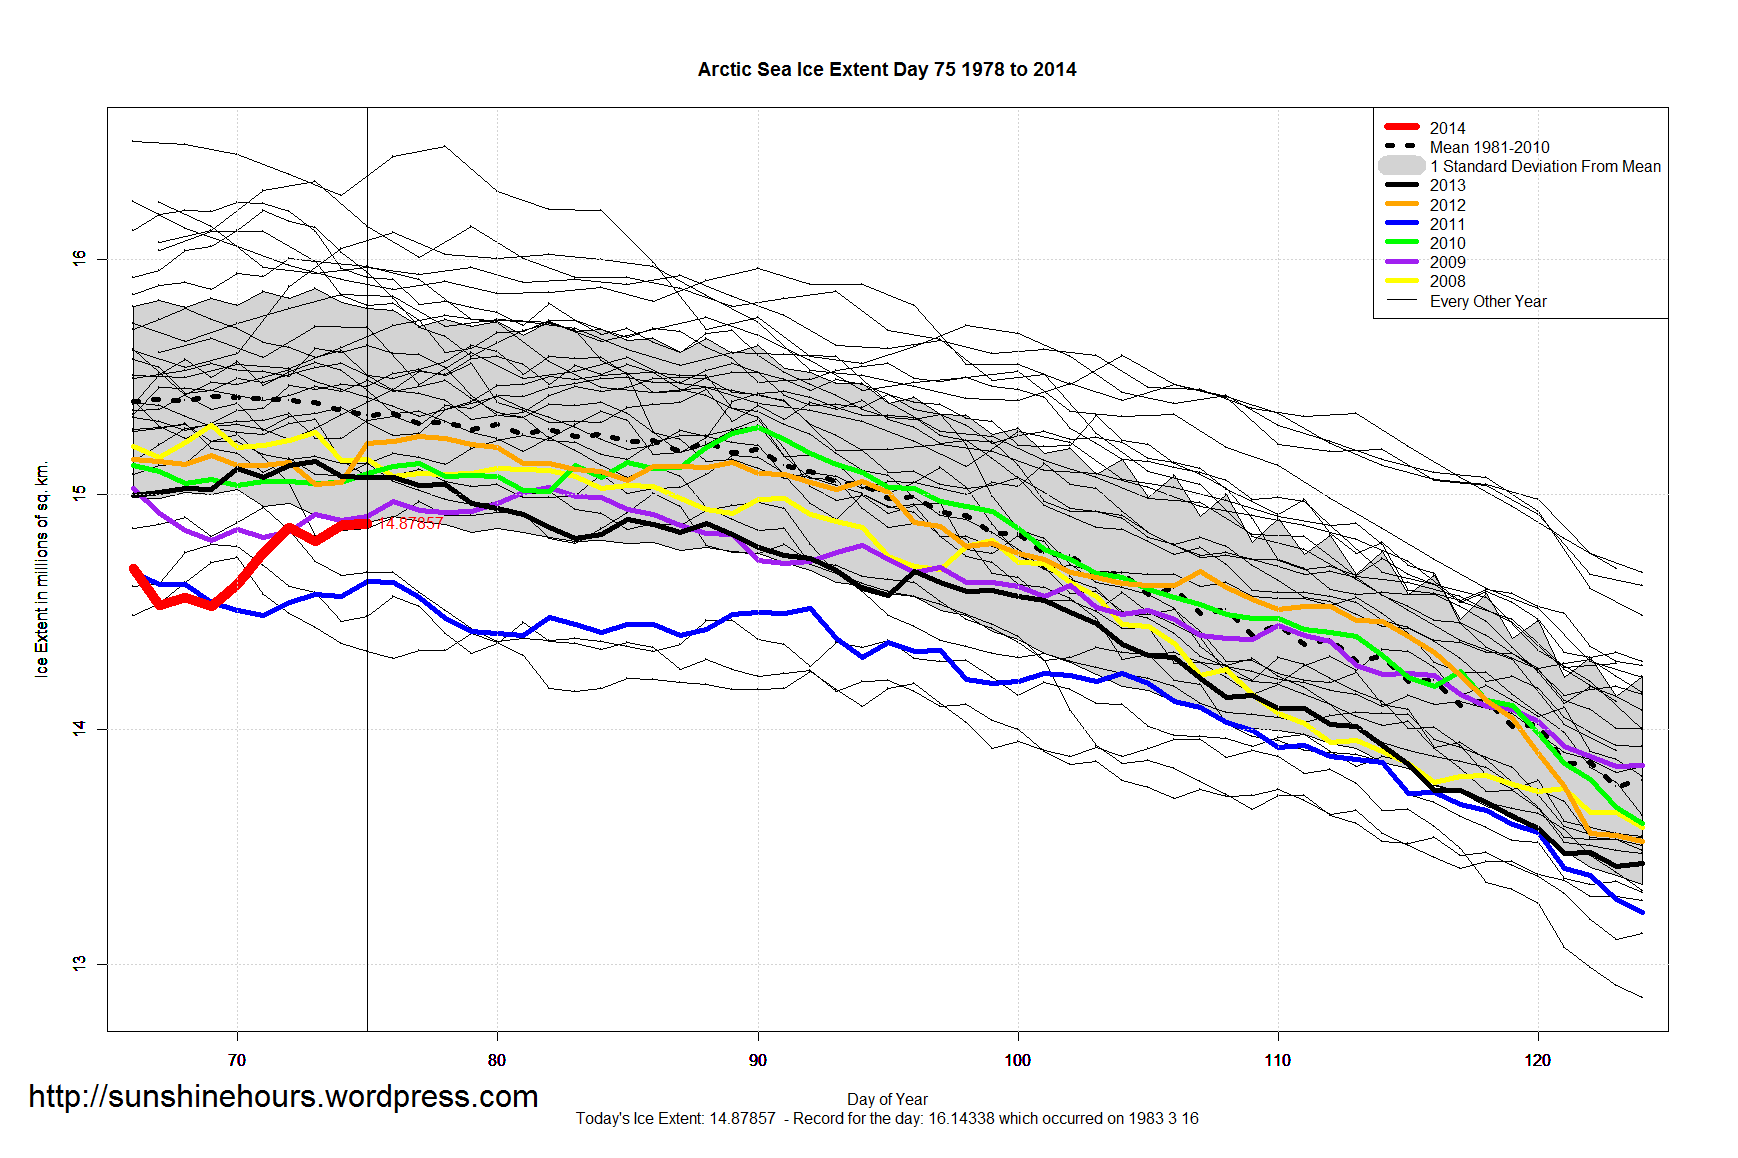
A quick update for sea ice extent:
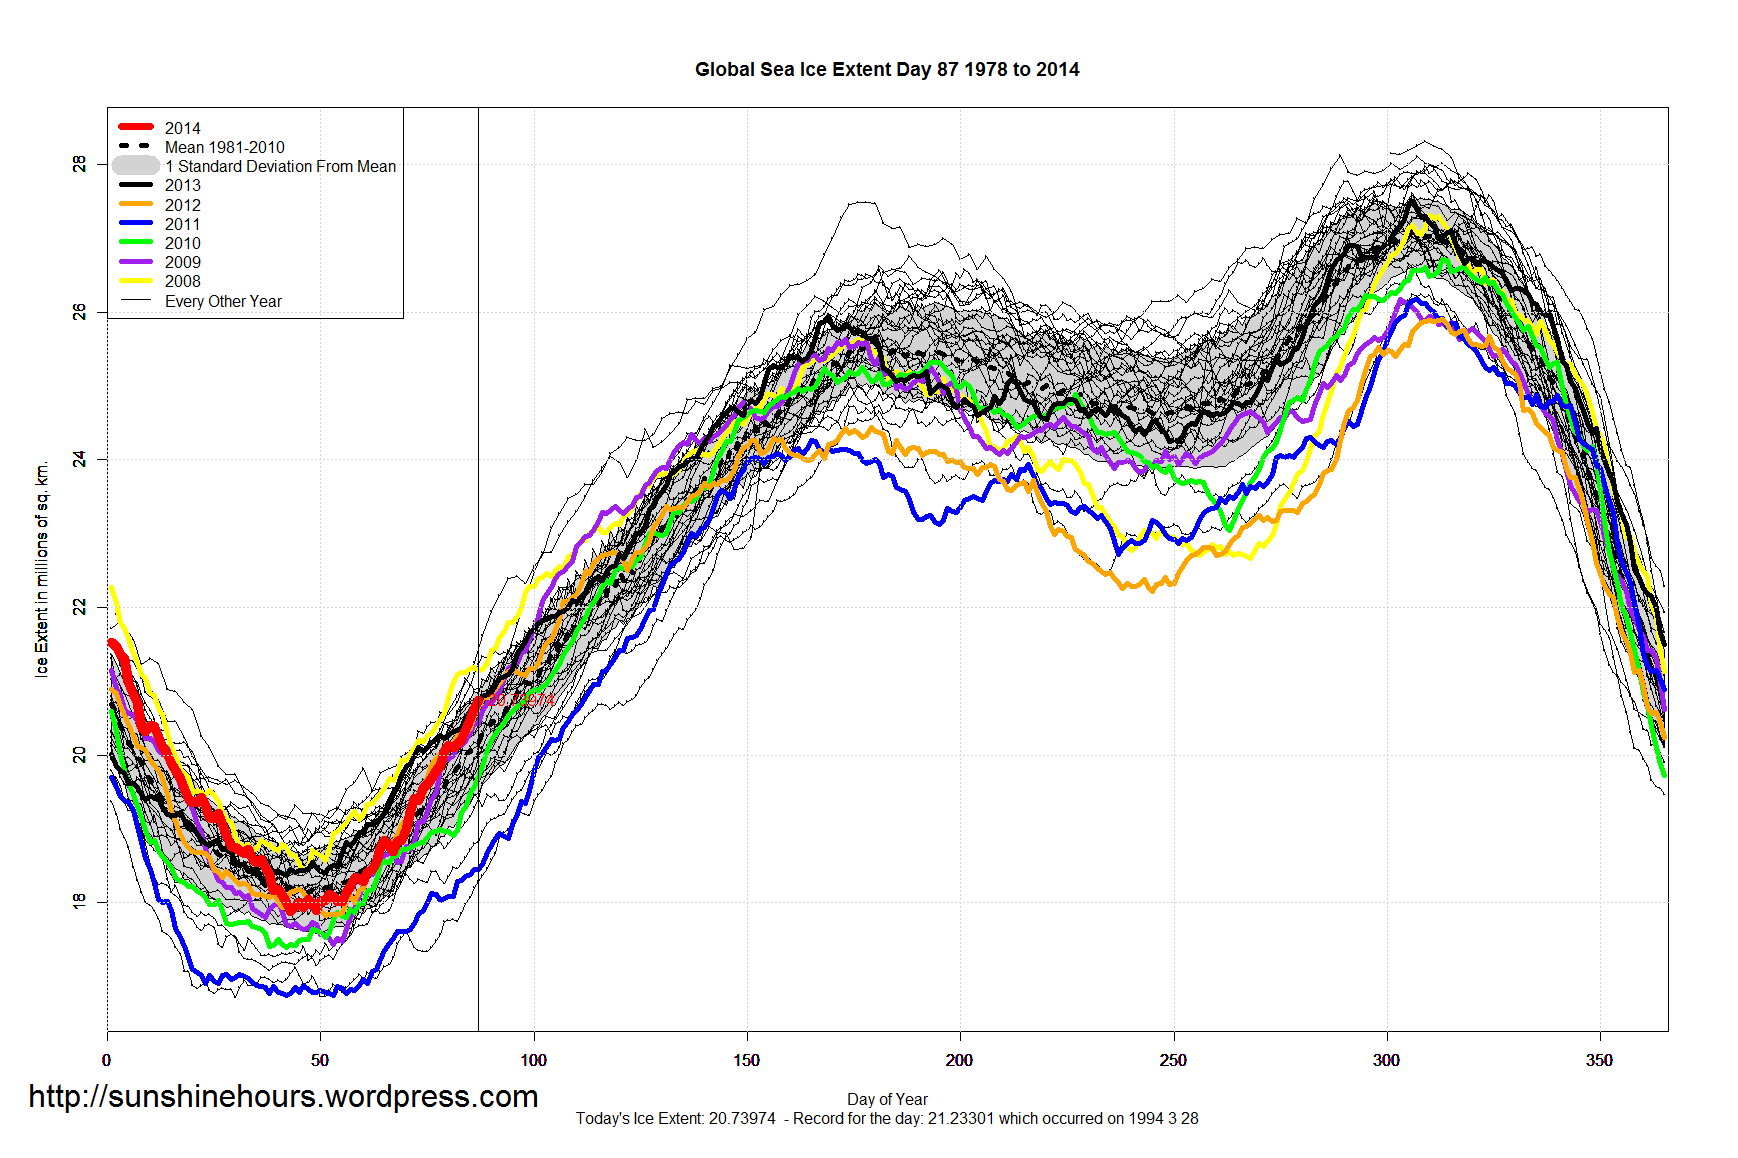
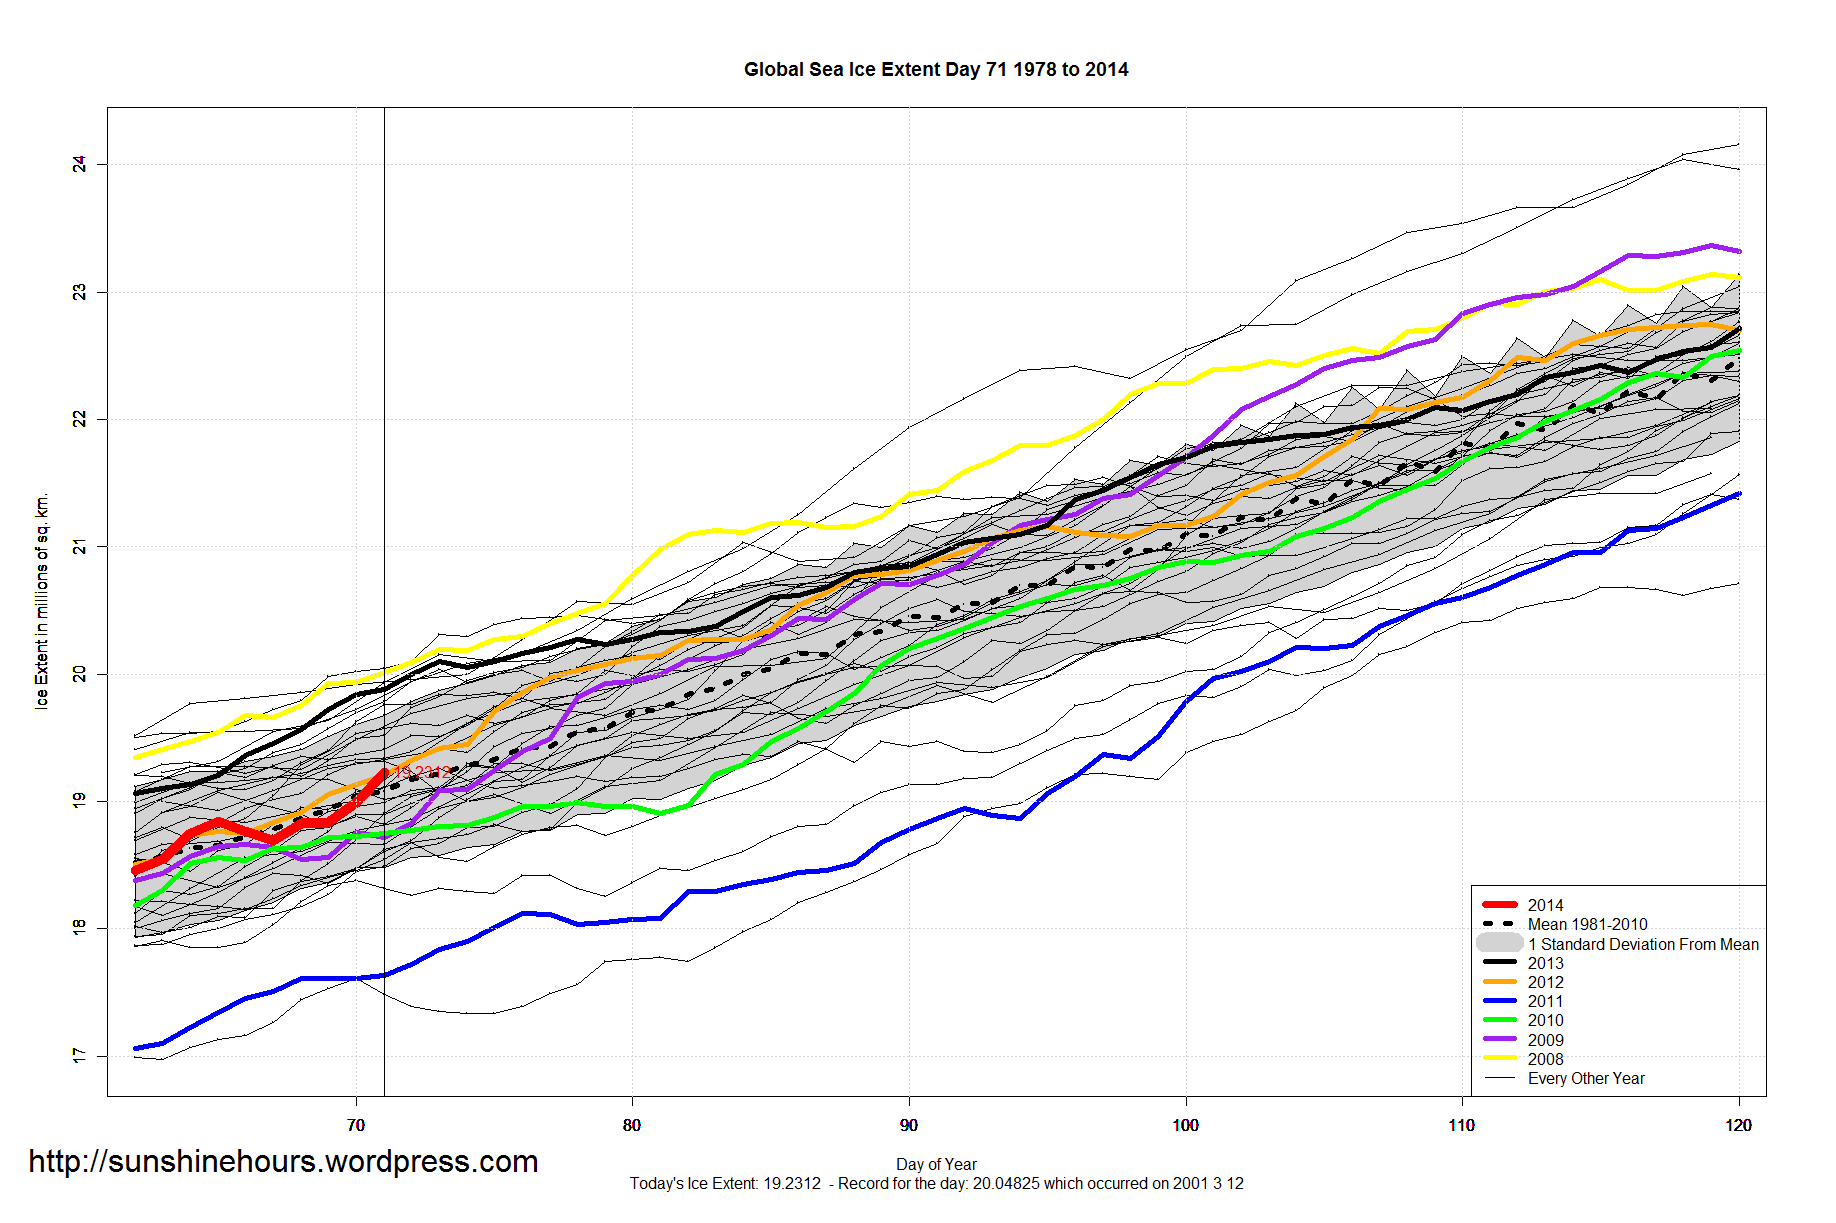
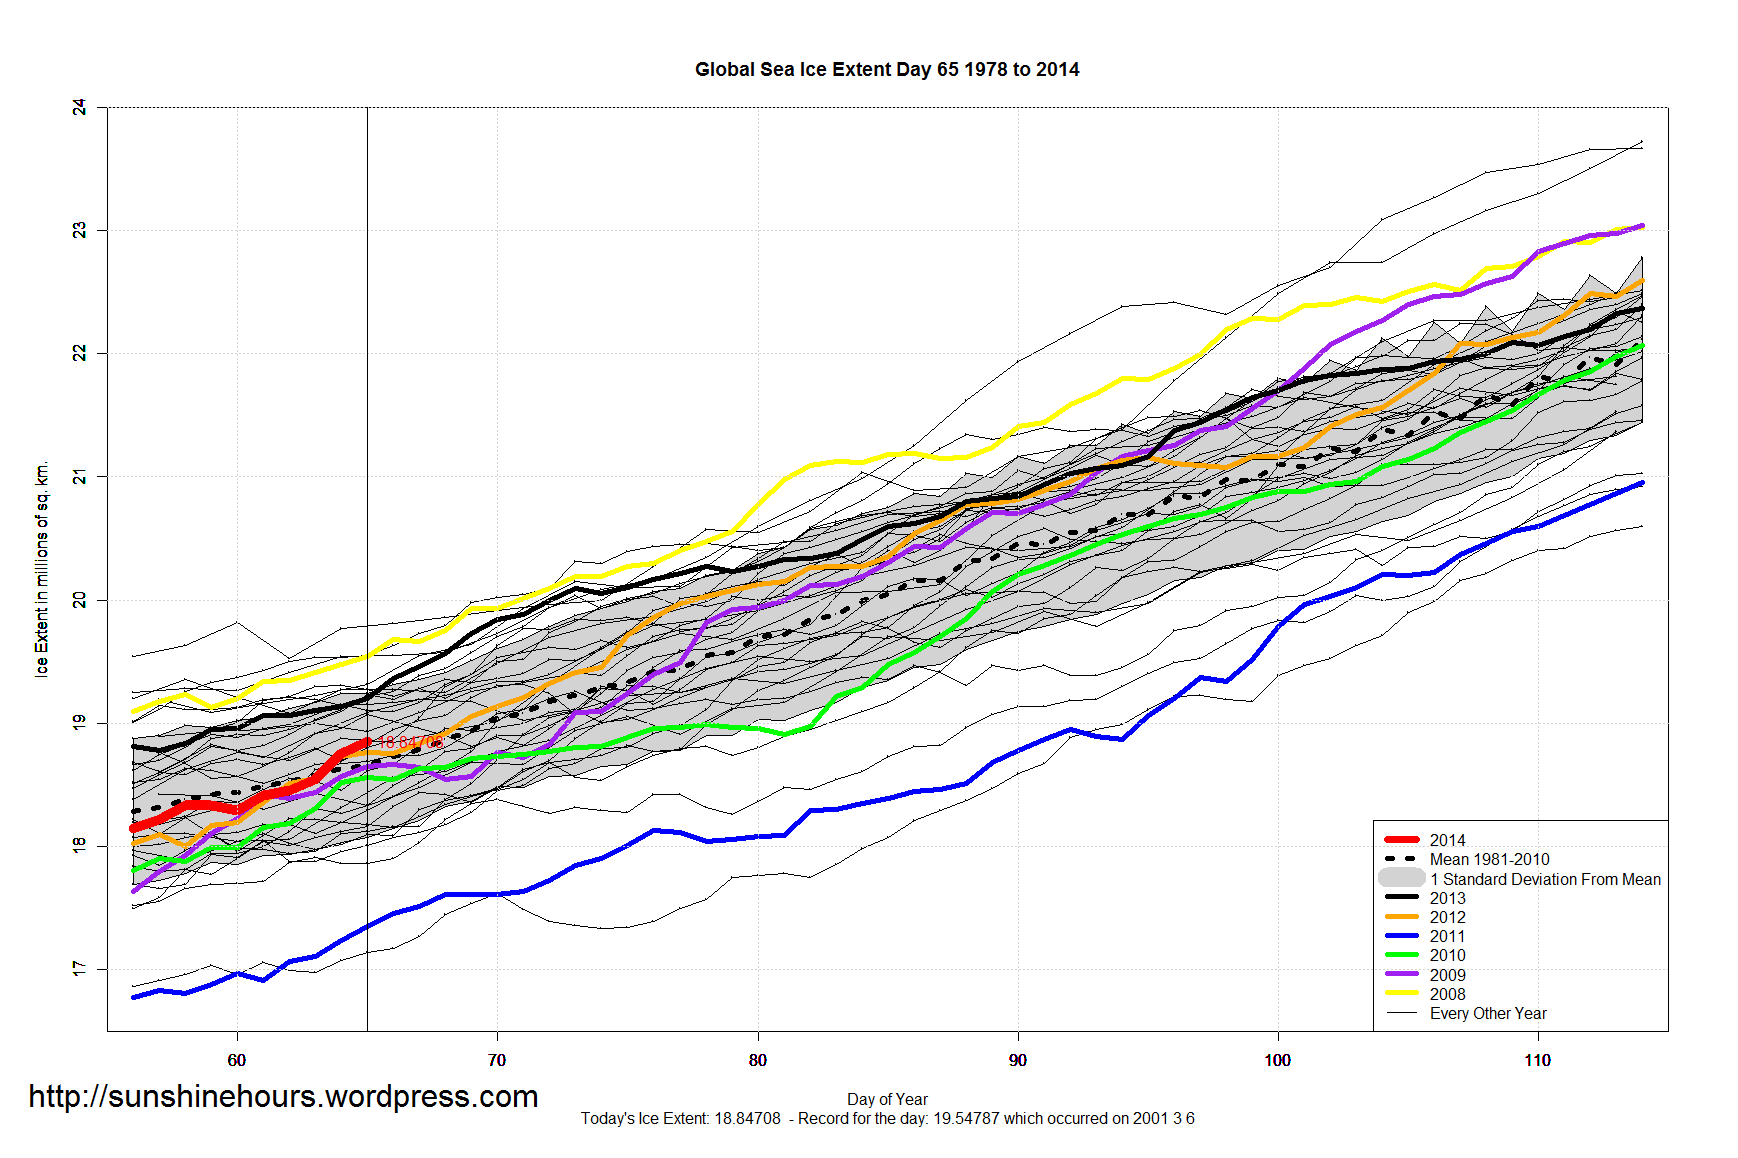
- Global Sea Ice is 582,000 sq km above the 1981-2010 mean.
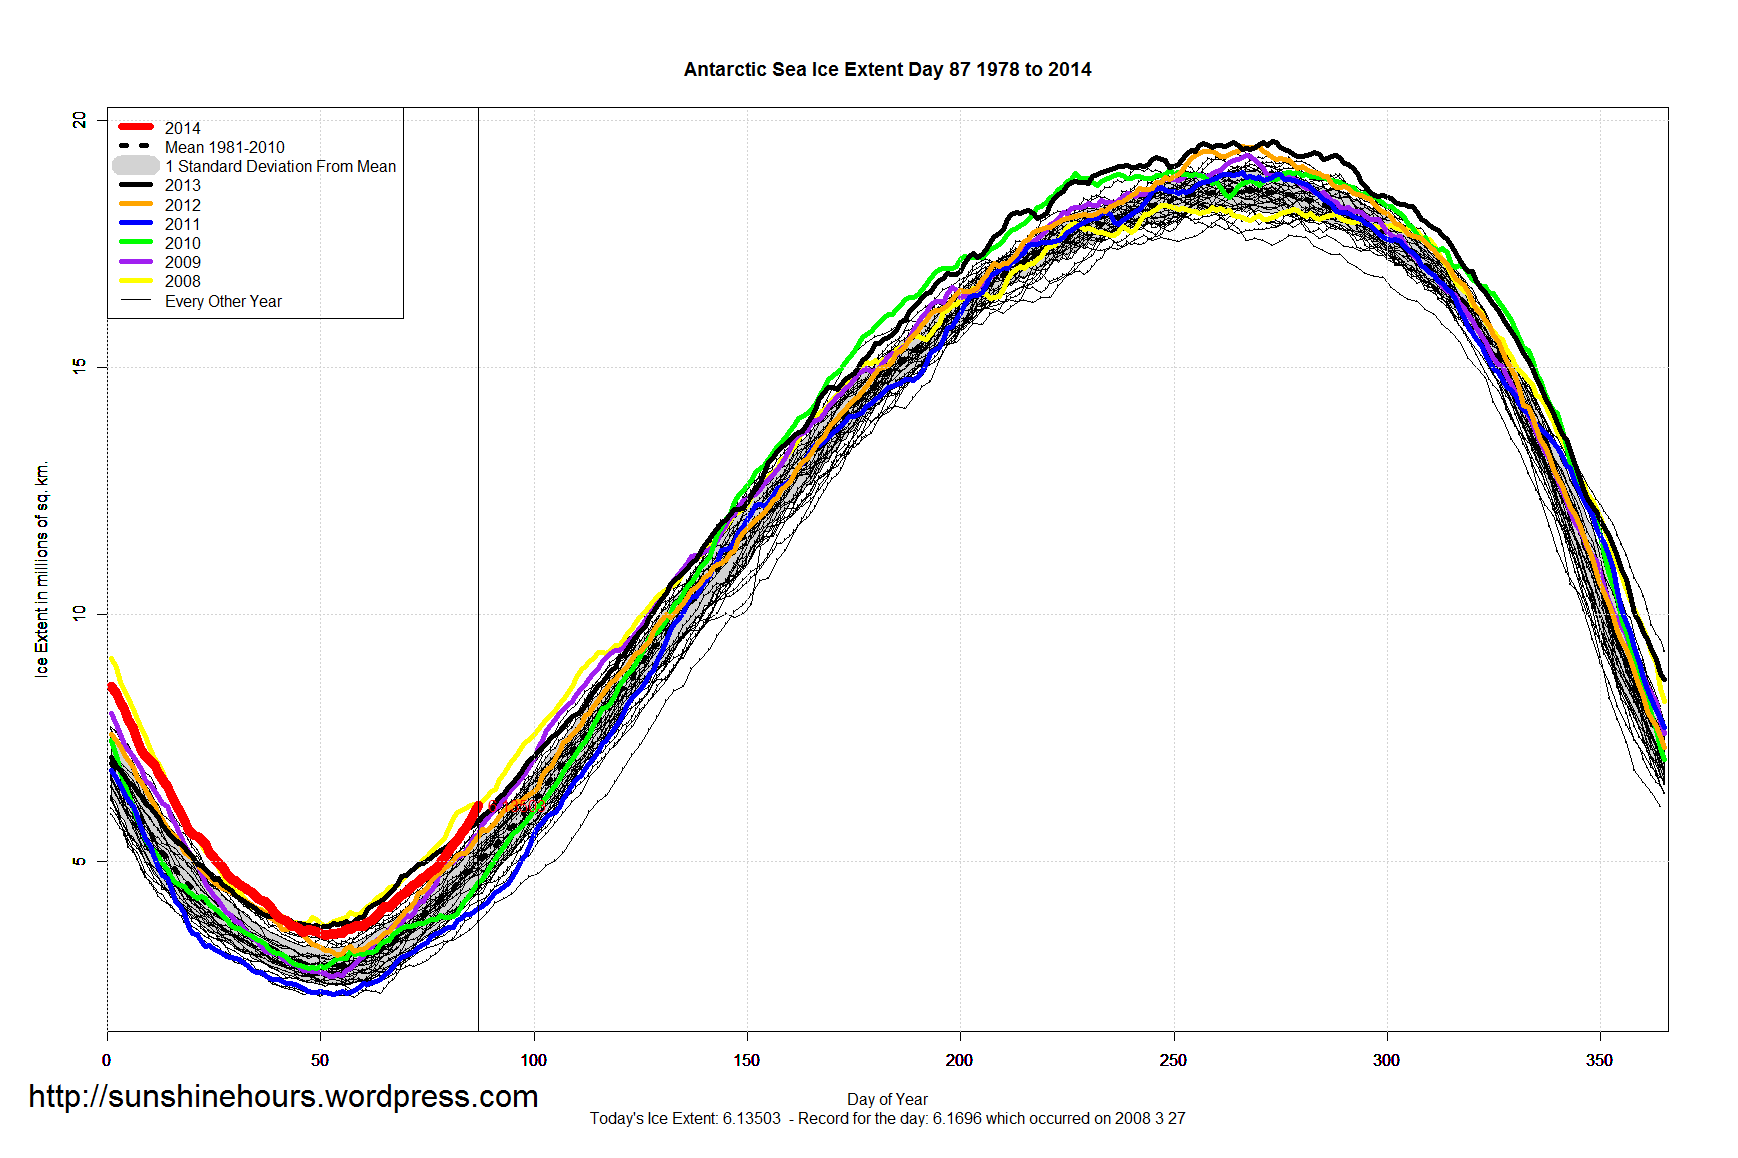
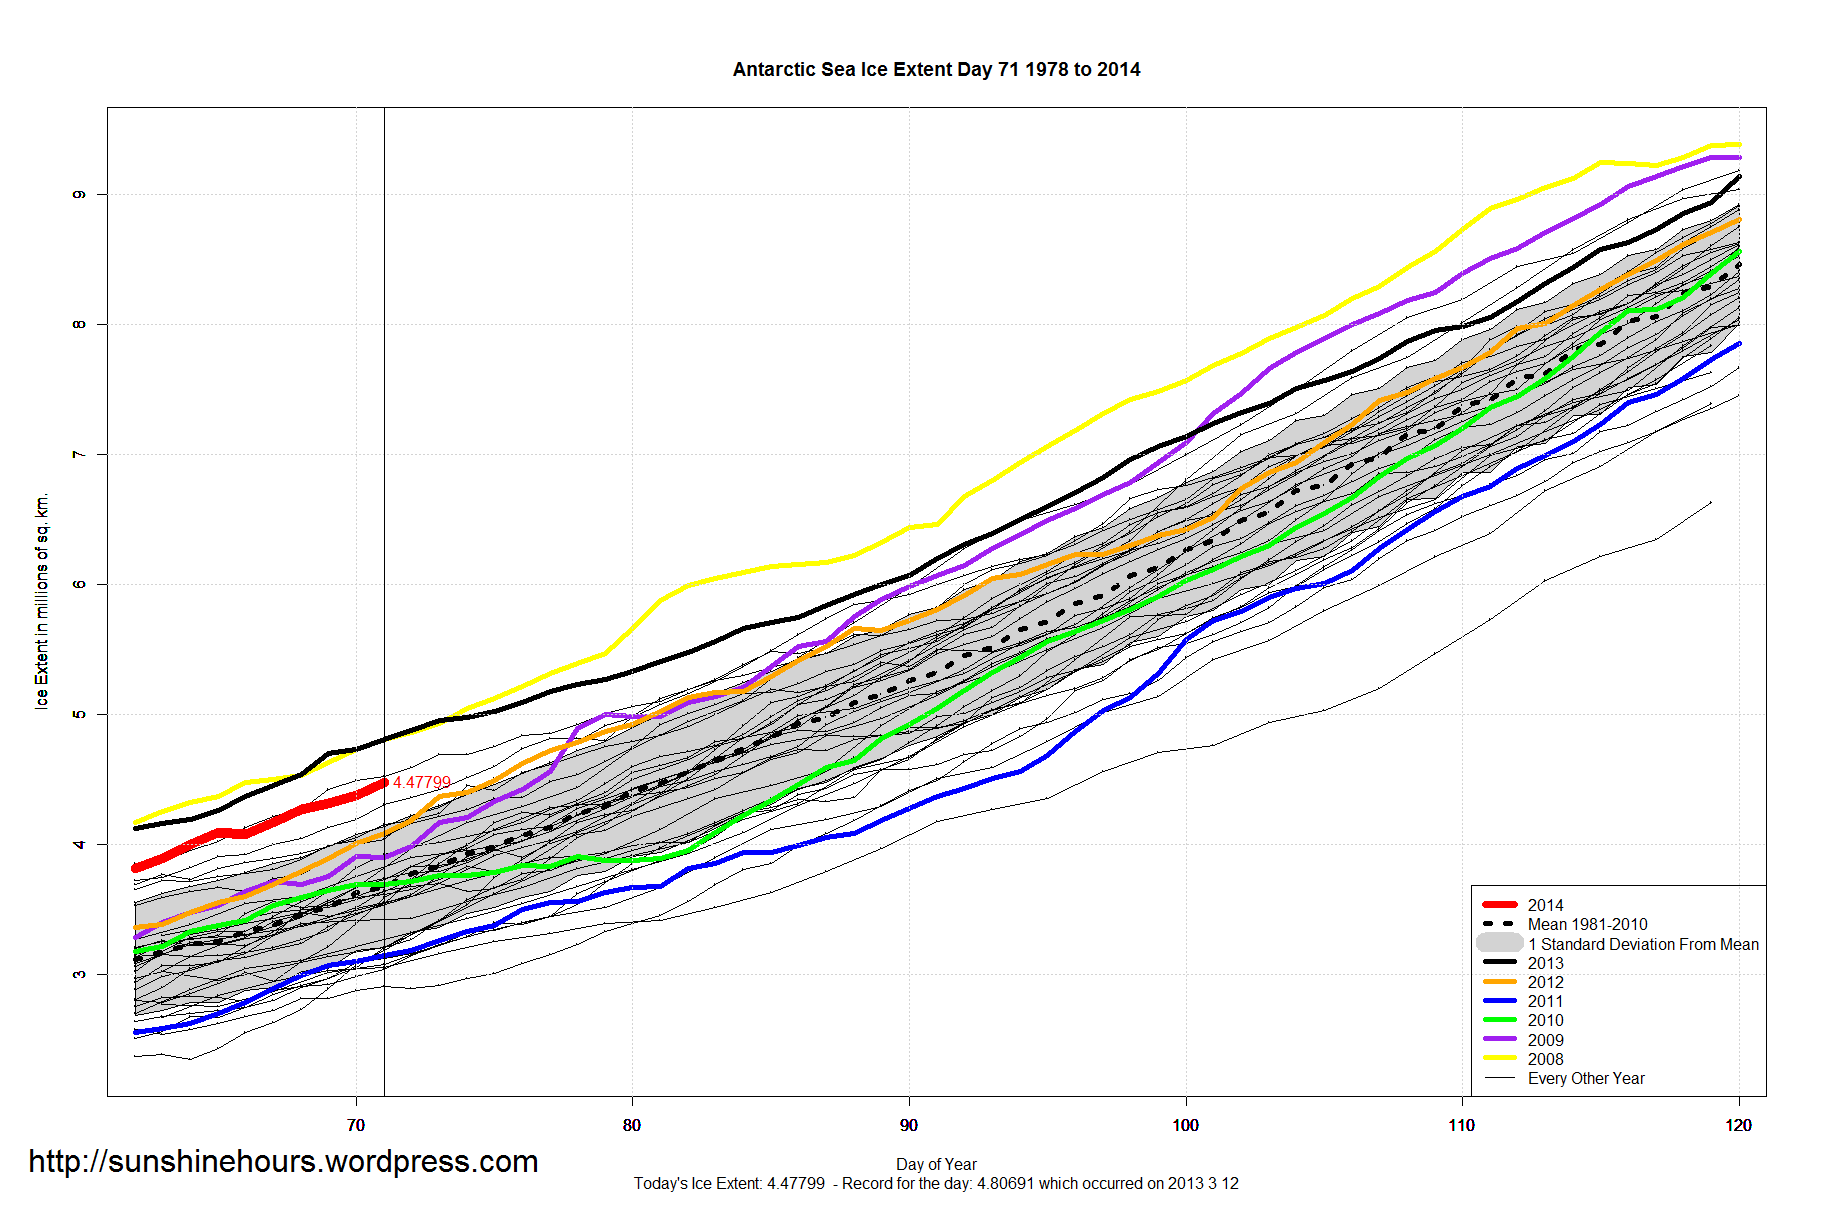
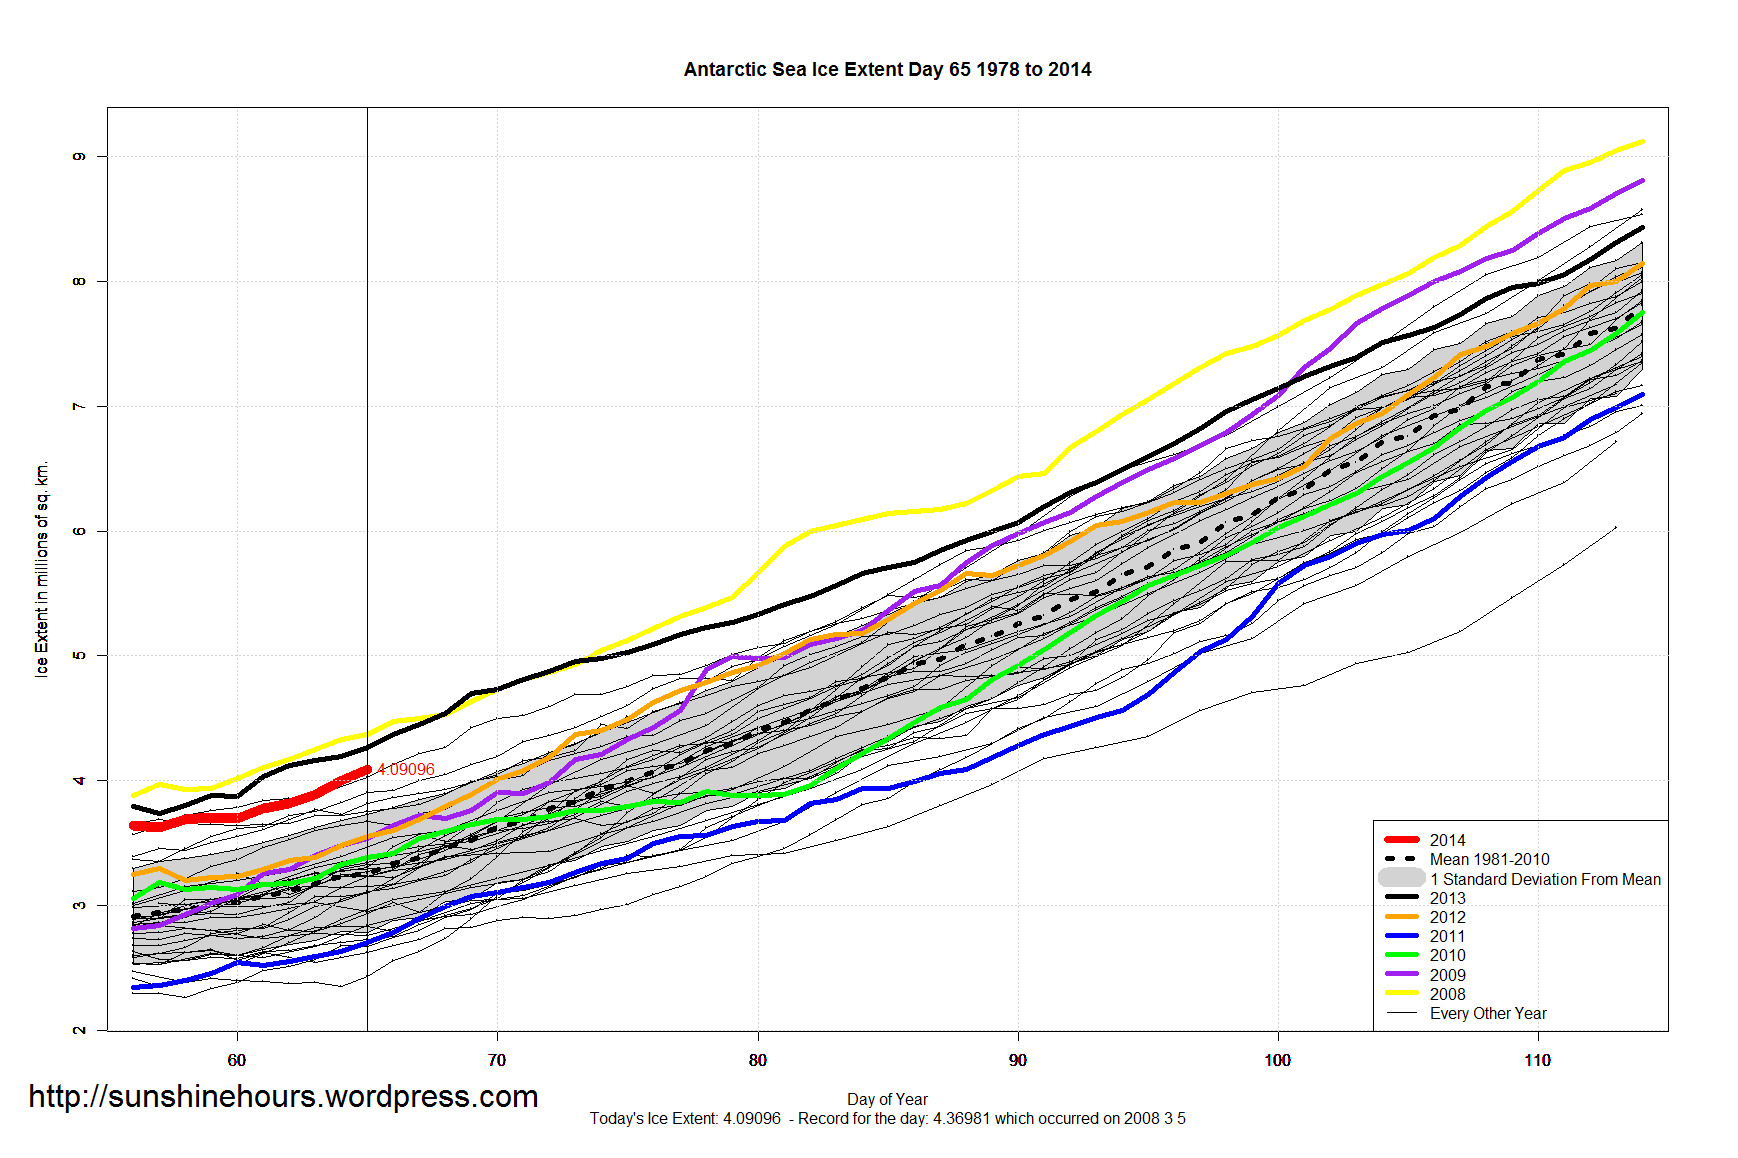
- Antarctic Sea Ice is 1,162,000 sq km above the 1981-2010 mean. 2nd highest for this day and only 35,000 sq km short of the daily record. And still climbing fast enough to break the daily record in 1 or 2 days.
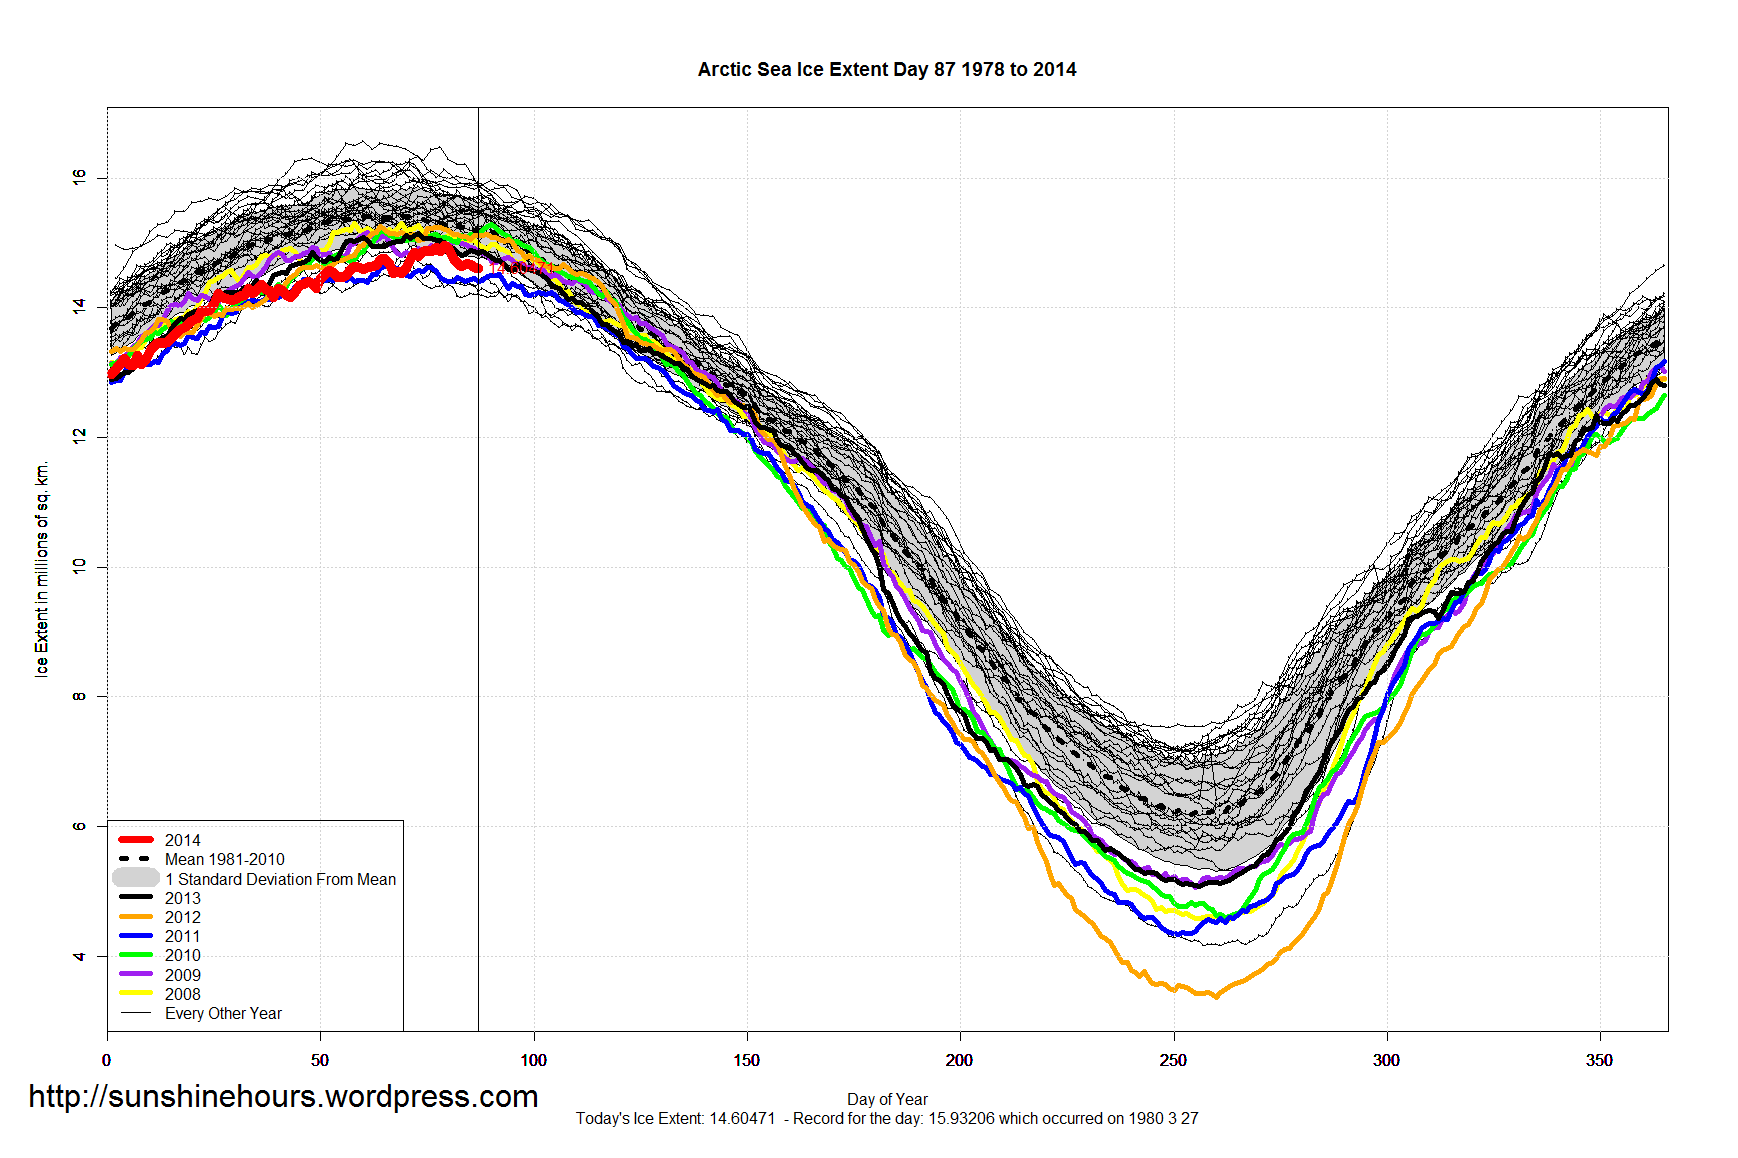
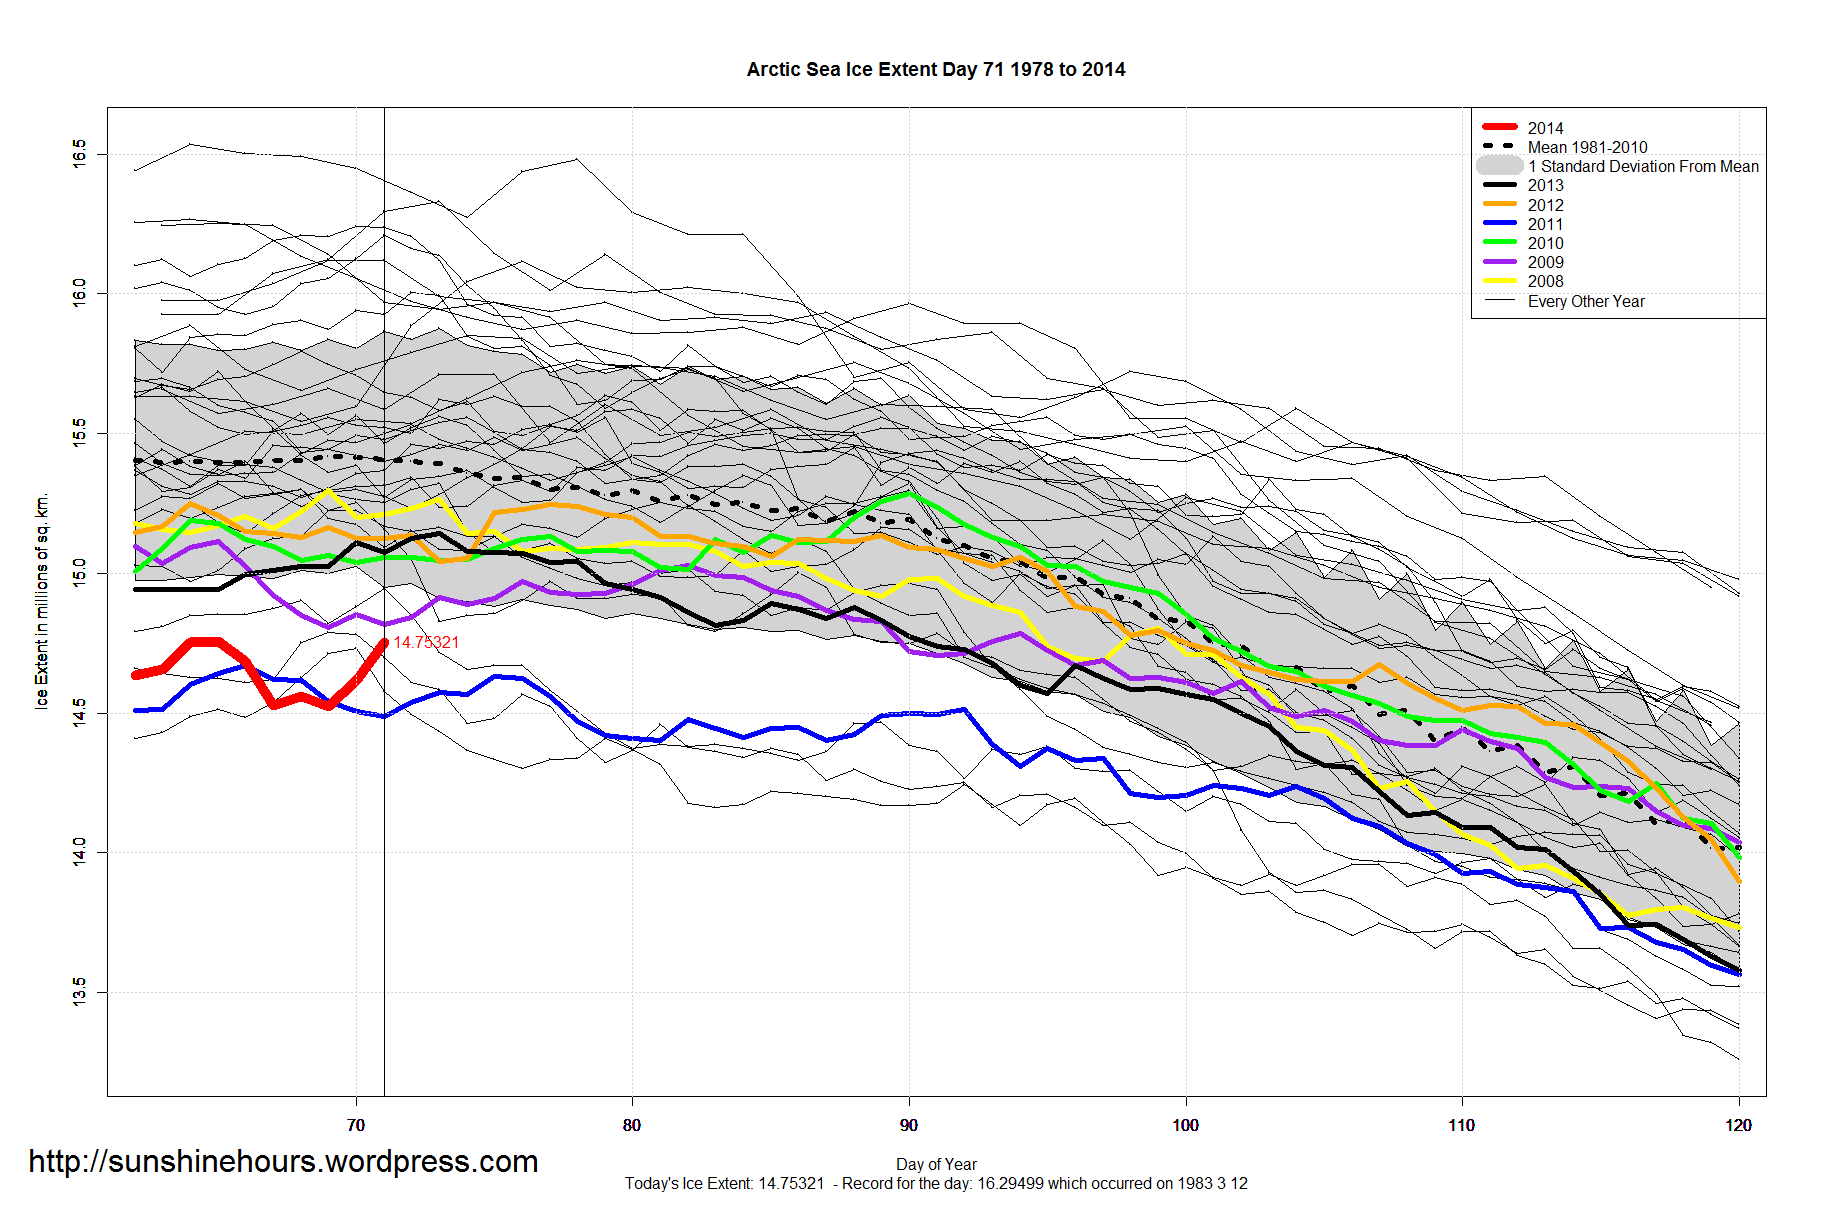
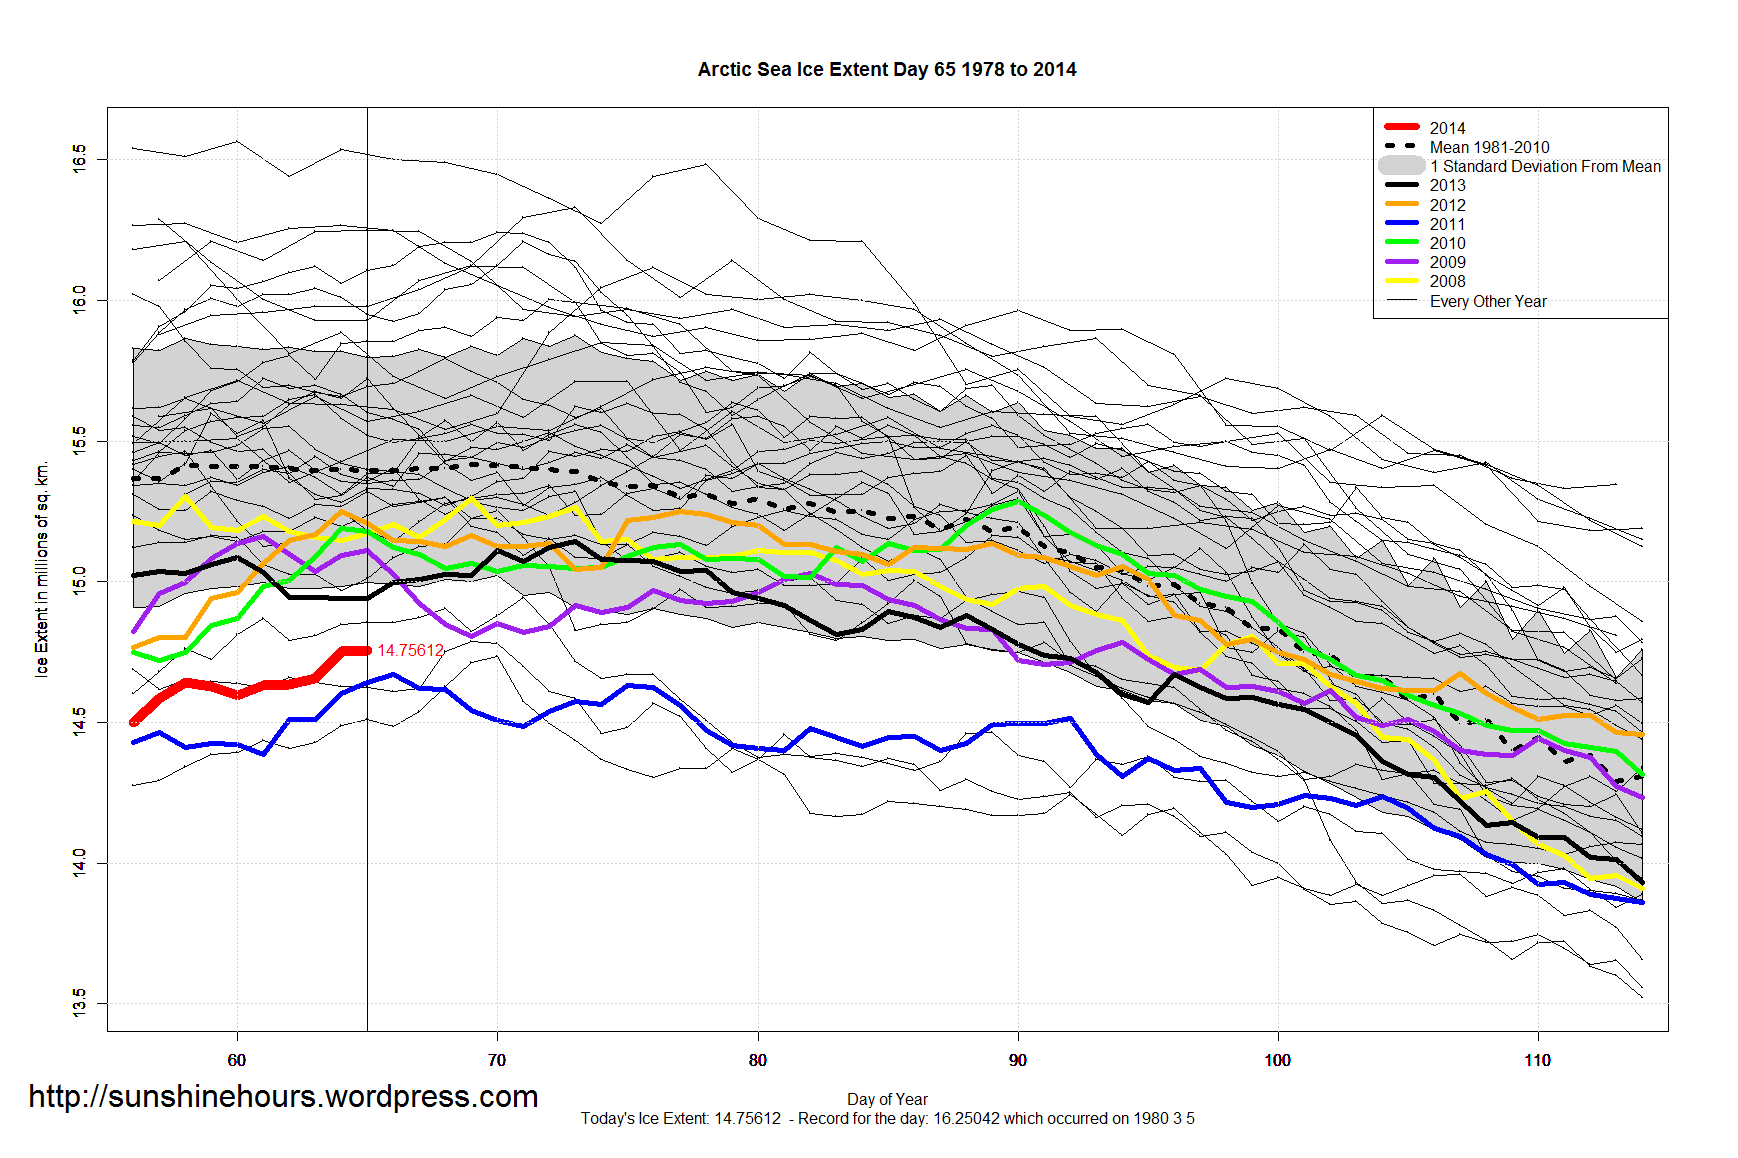
- Arctic Sea Ice is 581,000 sq km below the 1981-2010 mean.
Data here. Graphs below. Click for bigger.