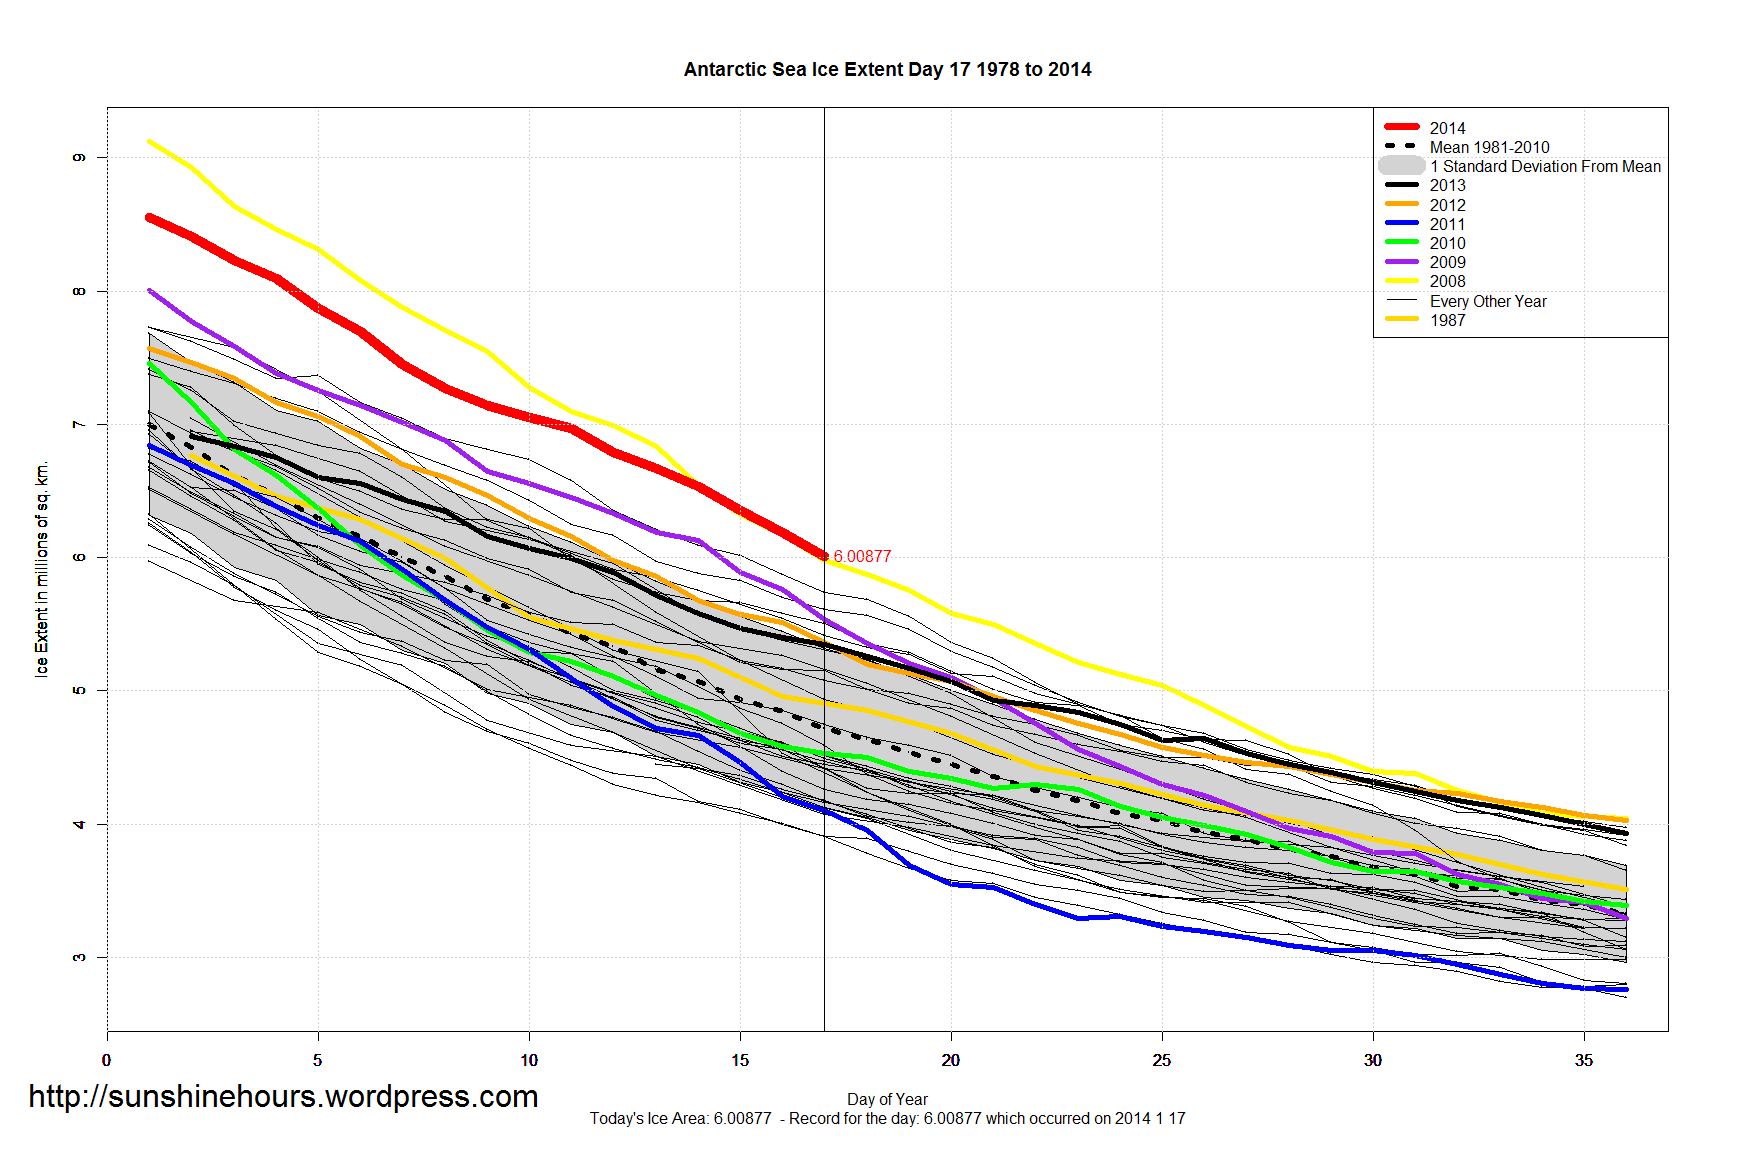
The 3rd daily record for Antarctic Sea Ice Extent in 2014 was set yesterday on Jan 17 (Day 17). The old record was from 2008.
The old record was broken by 31,220 sq km.
Data is here. Click for bigger.
The 3rd daily record for Antarctic Sea Ice Extent in 2014 was set yesterday on Jan 17 (Day 17). The old record was from 2008.
The old record was broken by 31,220 sq km.
Data is here. Click for bigger.
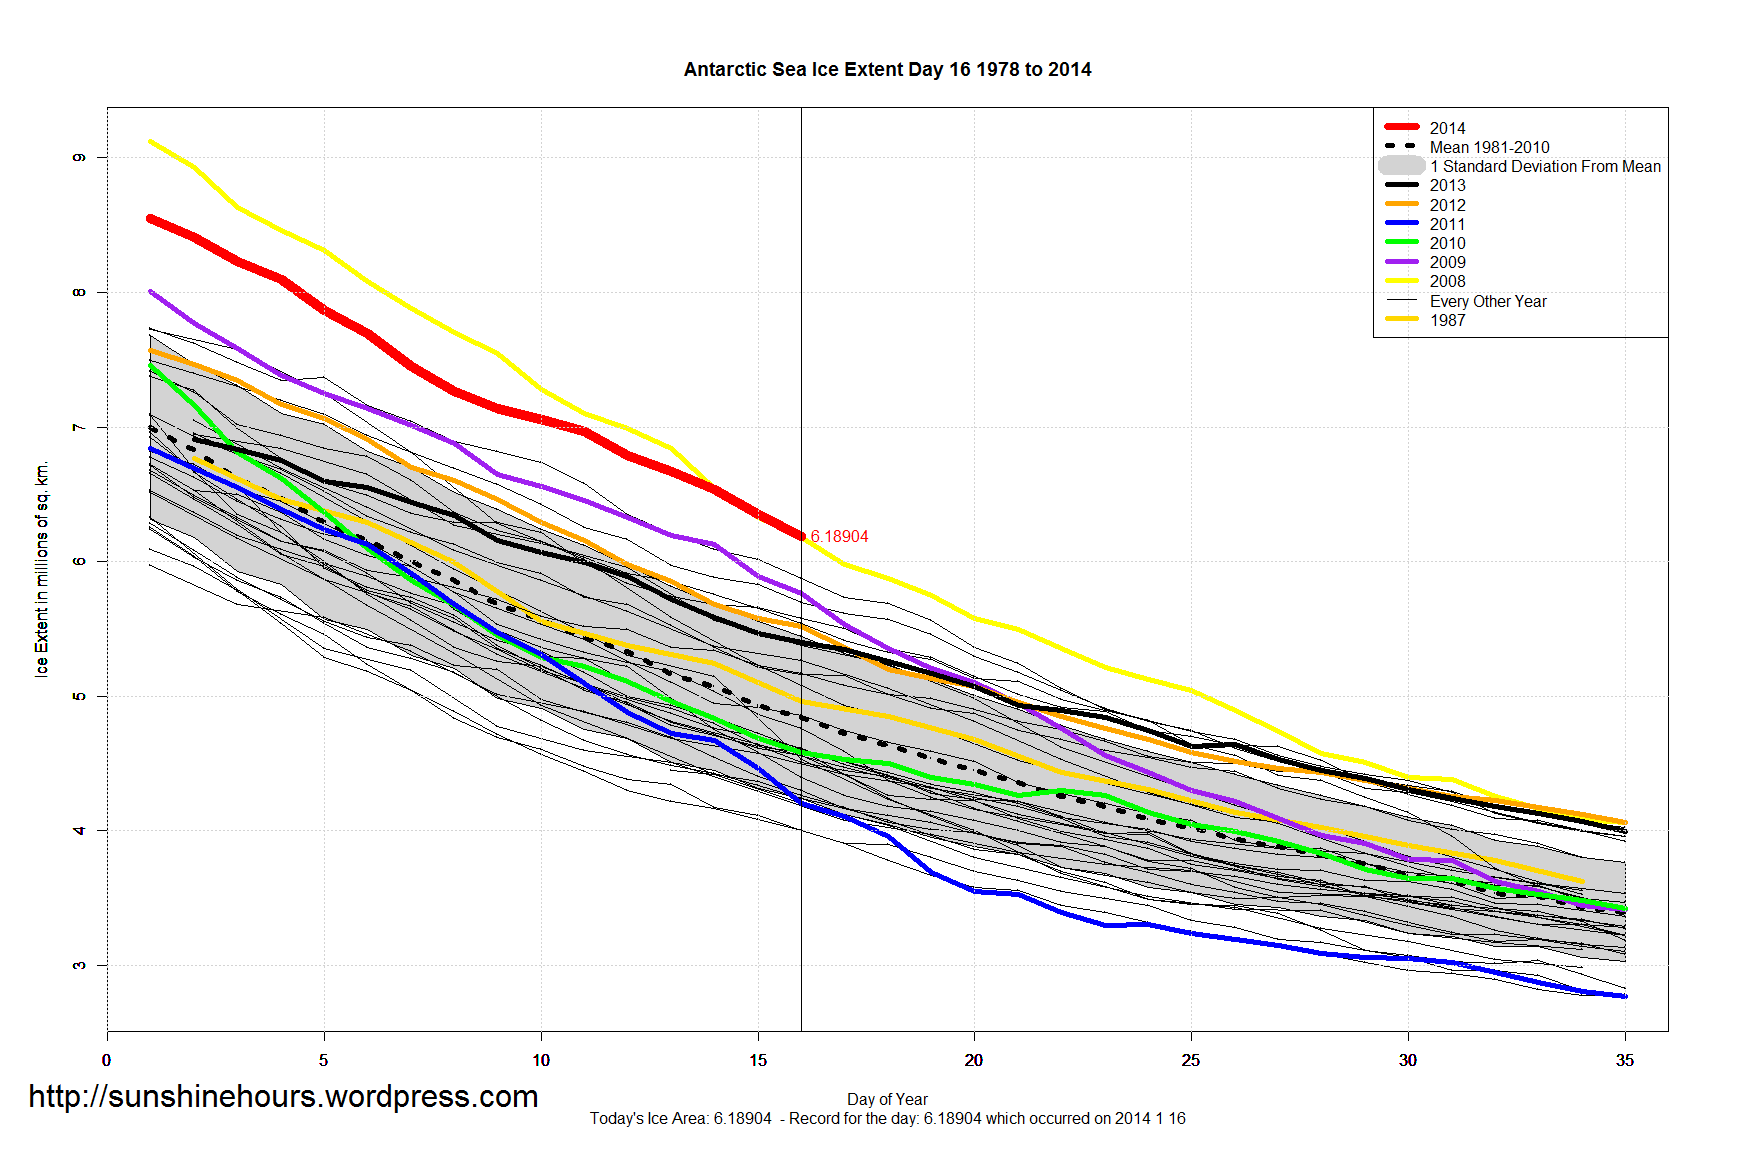
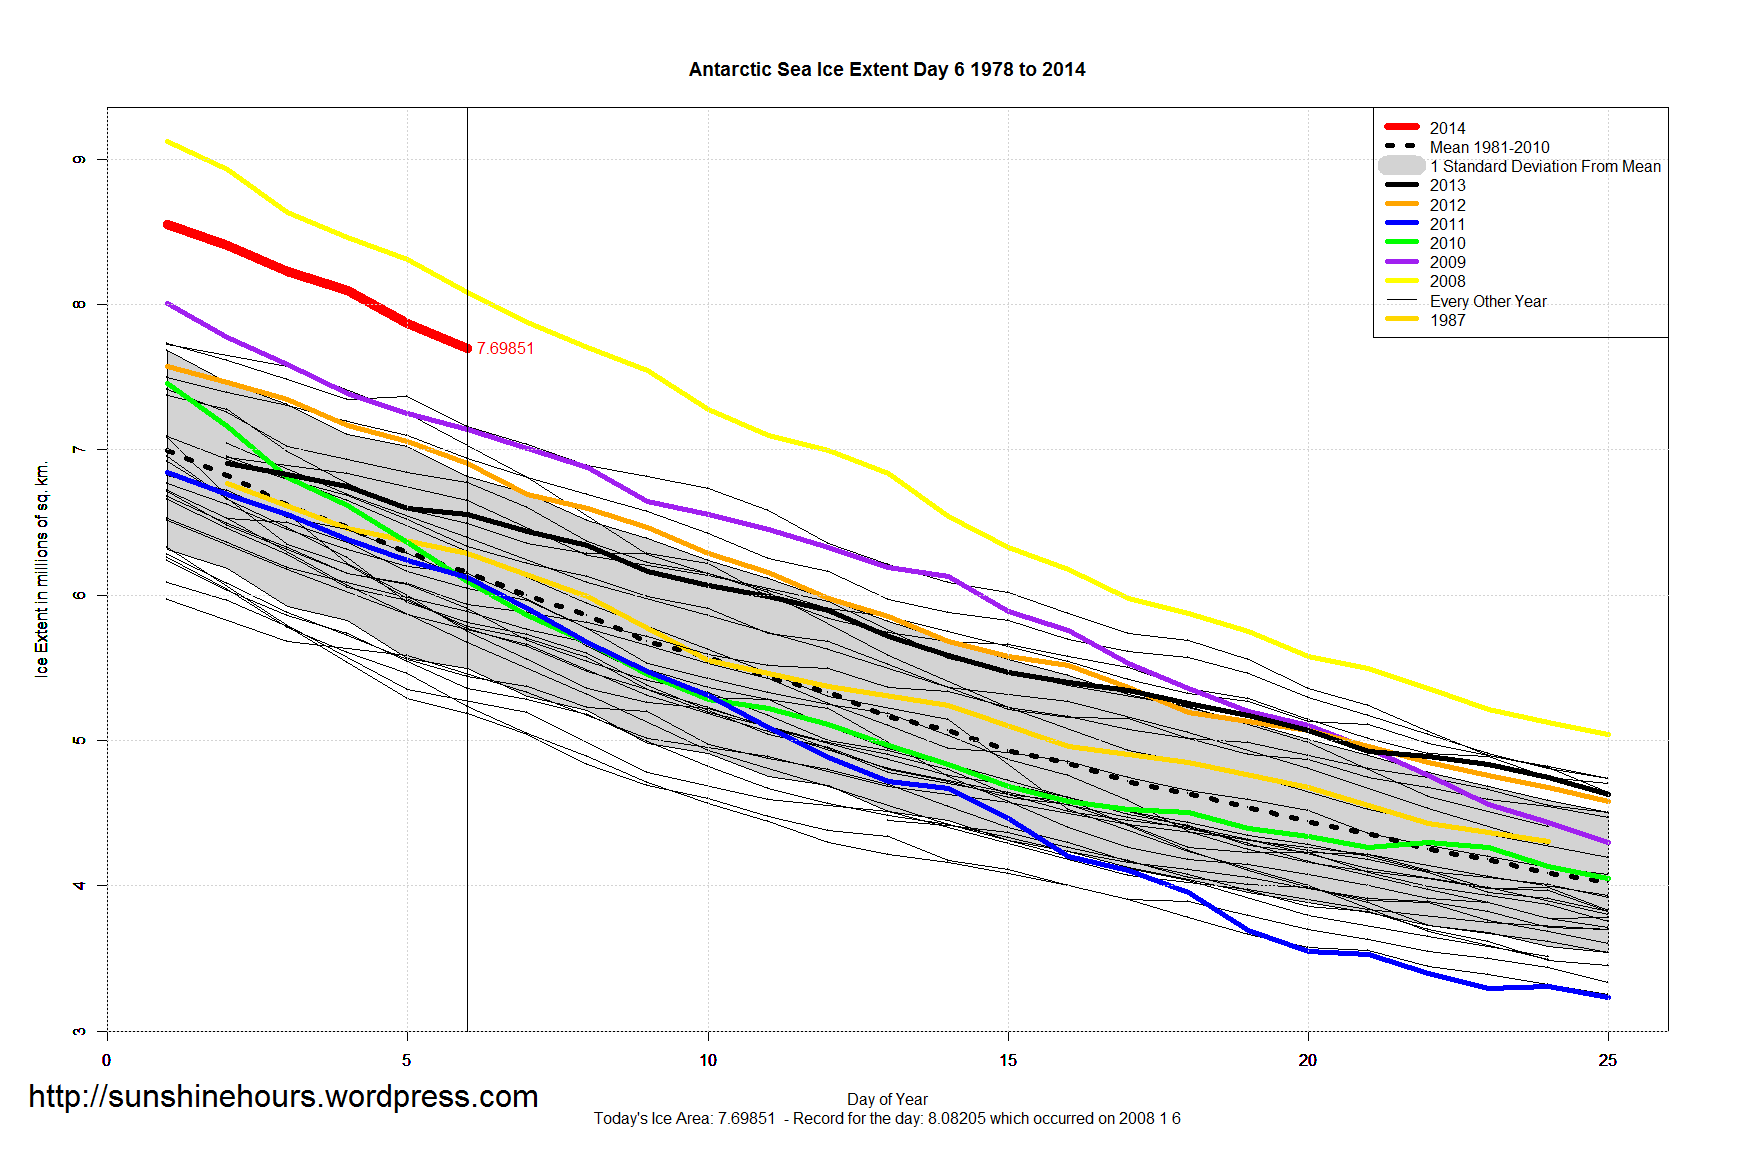
The 2nd daily record for Antarctic Sea Ice Extent in 2014 was set yesterday on Jan 16 (Day 16). The old record was from 2008.
The old record was broken by 12,080 sq km.
Data is here. Click for bigger.
The 1st daily record for Antarctic Sea Ice Extent in 2014 was set yesterday on day 15. The old record was from 2008.
The old record was broken by 26,500 sq km.
Data is here. Click for bigger.

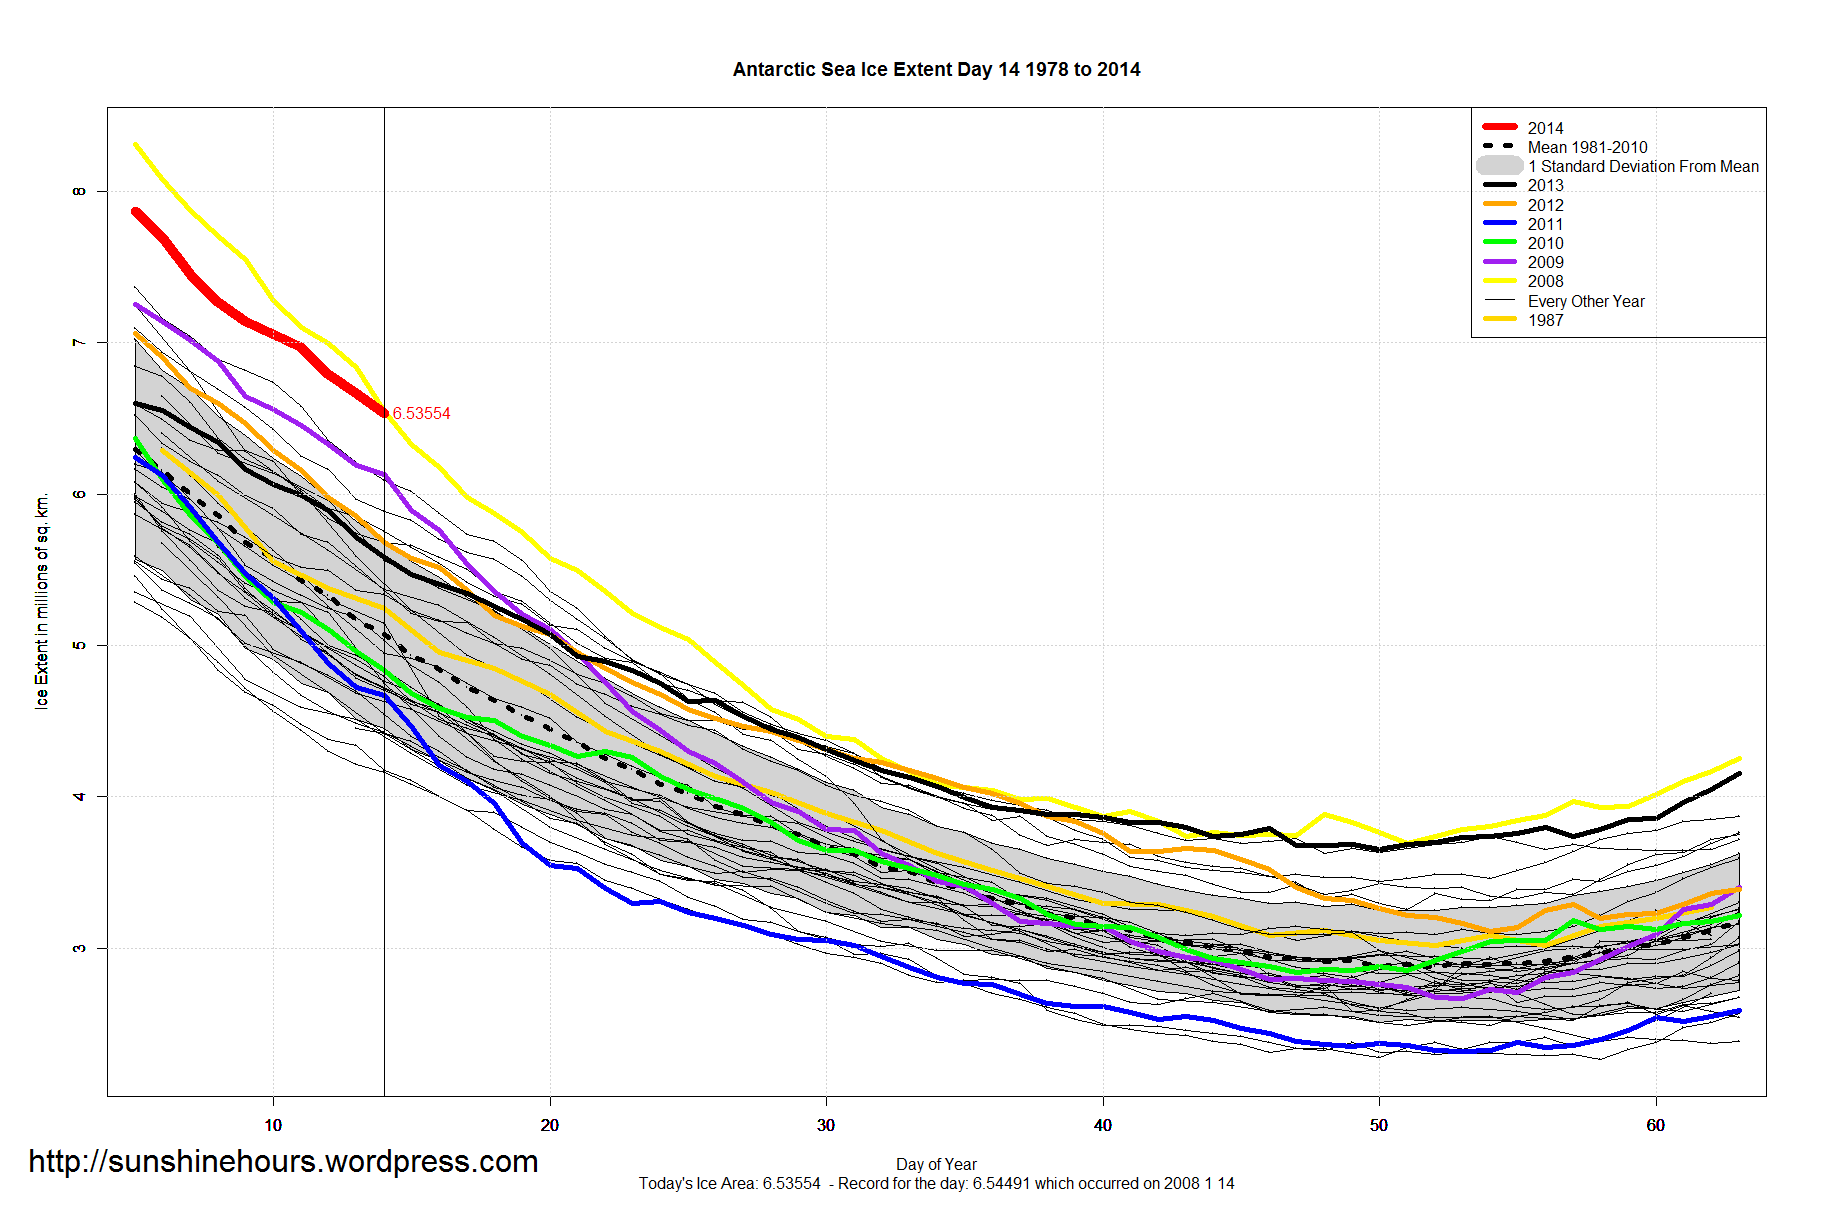
Antarctic Sea Ice Extent on day 14 was only 9370 sq km below the record set in 2008.
Currently extent is 1.47 million sq km above the 1981-2010 mean. Thats 28% higher.
Extent is also more than TWO Standard Deviations above the mean. And has been since Dec 26th. 190 days in 2013 were over TWO standard deviations above the mean.
Data is here. Click for bigger.
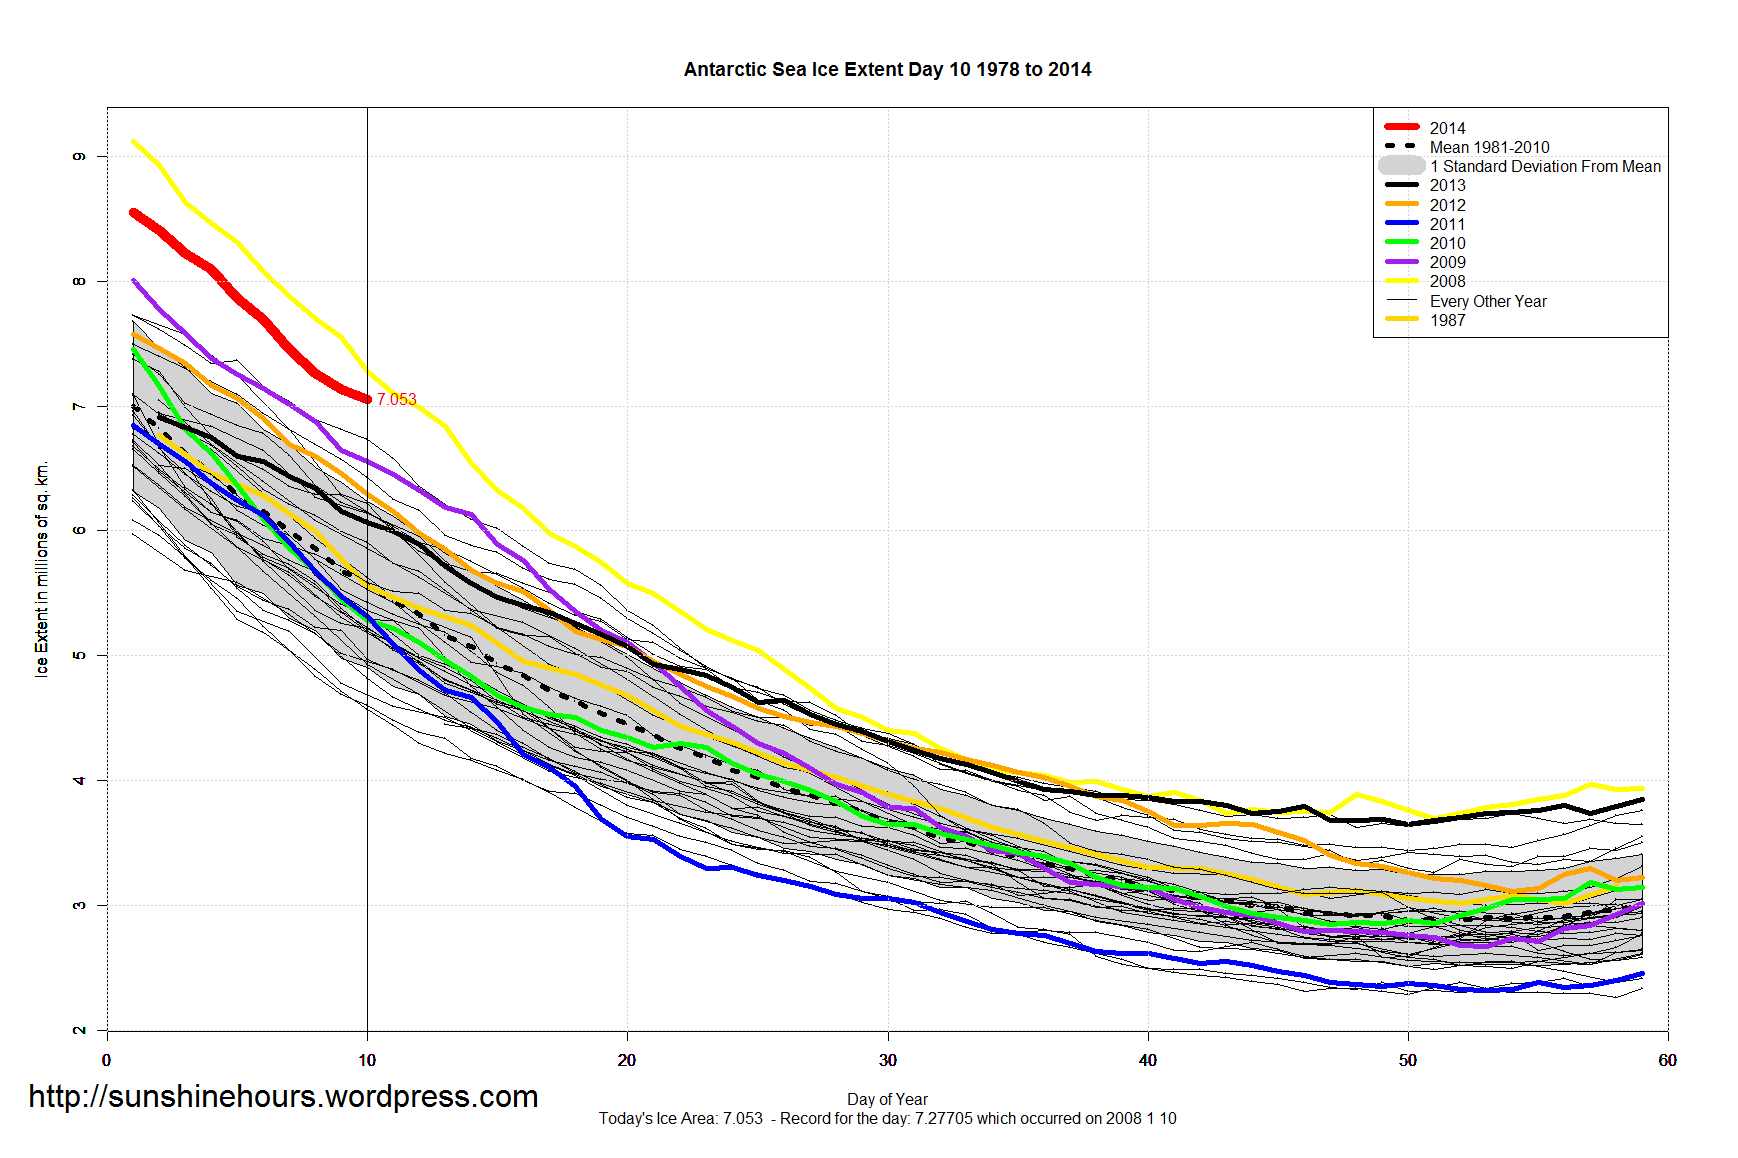
Antarctic Sea Ice Extent Is So High It May Set A Record For Highest Minimum of All Time
The Extent for day 10 is 1.48 million sq km above the 1981-2010 mean. And only 220,000 sq km below 2008.
The highest minimum was in 2008. Sea Ice only fell to 3.69 million sq km on day 51.
Click for bigger.
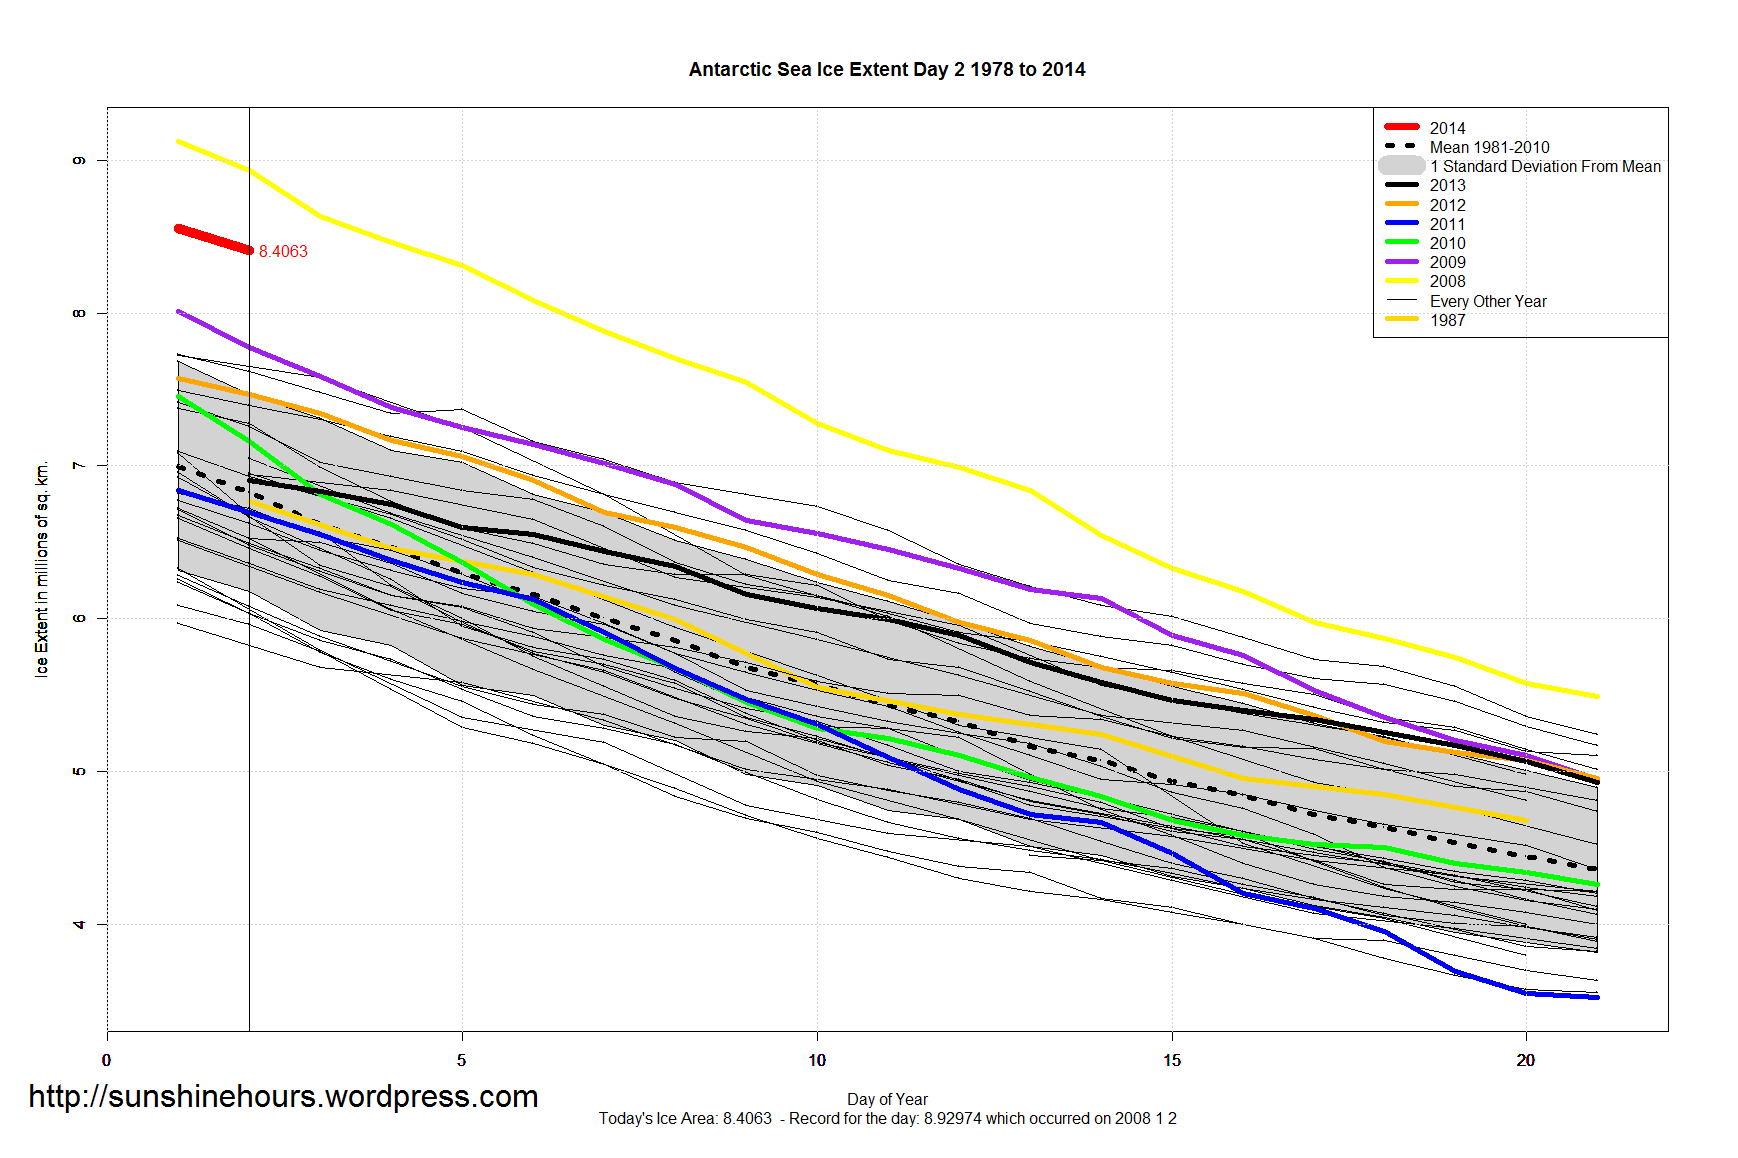
So far in 2014, Antarctic Sea Ice Extent is 1.15 million sq km above 2013 and 1.54 million sq km above the 1981-2010 mean.
More remarkably it is only 400,000 sq km below the extraordinary high extent that occurred at a similar period in 2008.
Extent has been more than two standard deviations above the mean since Dec 26 2013 and one standard deviation above the mean since May 29 2013.
Antarctic Sea Ice Extent is off to a pretty amazing start. 1.58 million sq km above the 1981-2010 mean. 23% above normal.
Note quite as amazing as 2008 though. Remember, all the years from 1979 on are on the graph below. 2014 and 2008 are pretty far out there.
Click to enlarge. Data here.
The bunch of clowns on the MV Akademik Shokalskiy had to have known the ice was highest it has ever been. And the BBC propaganda arm still claims the voyage was to study “melting ice”.
Way back on October 16 2013 the Antarctic supply ship Aurora Australis set sail for summer season and they were interviewed:
“Voyage leader Tony Foy has told Radio National the weather forecast was not good for the start of the journey and there was a lot of ice to get through.
“We’re expecting thick sea ice on the way, but as I told the expeditioners yesterday they’ll get the full Southern Ocean experience which I’m sure they’ll all want,” he said.
“Microwave data we got last week shows the ice concentration this year is as high as it’s been since we started taking readings back in the late 70s.
“I think we can expect it to be pretty slow when we hit the ice edge.”
BBC January 2 2014:
“Despite being trapped, the scientists continued their experiments, measuring temperature and salinity through cracks in the surrounding ice.
One of the aims was to track how quickly the Antarctic’s sea ice was disappearing.”
(h/t EUreferendum)
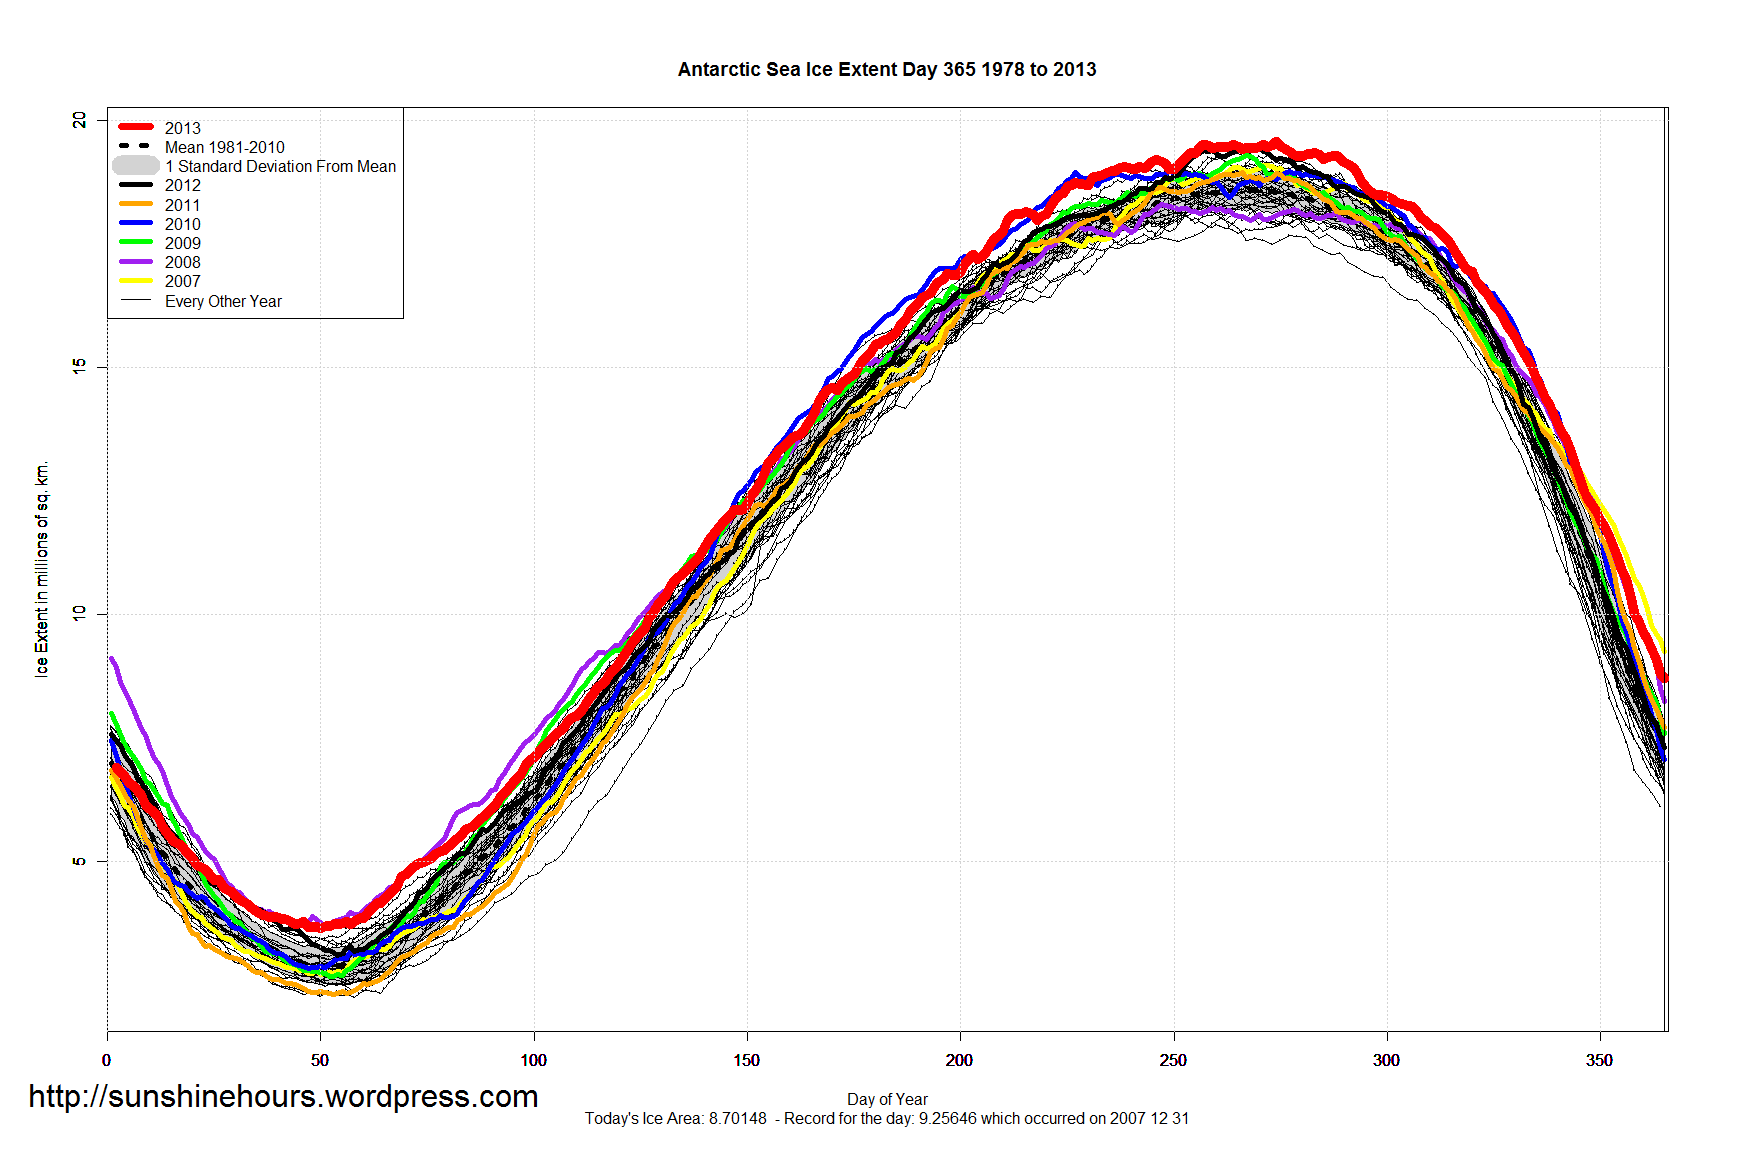
2013 was an average year for Global Sea Ice Extent (thanks to it being a banner year for Antarctic Sea Ice Extent)
The average daily anomaly was 200,000 sq km above the 1981-2010 mean. That would be 15th highest since 1979.
Max Extent of 27.4959 million sq km For Whole Year Occurred On Day: 306 November 2
Max Anomaly For Whole Year Occurred On Day: 353 December 19 = 0.9459423 million sq km
Max Anomaly % For Whole Year Occurred On Day: 73 March 14 = 4.72%
There were zero daily records set and no 2nd places.
Here are the key stats for each year. Min/Max/Anomaly in millions sq km.
| Year | Min | Max | day of Max | day of Min | Avg Anomaly |
| 1979 | 19.09222 | 27.48859 | 176 | 38 | 0.79 |
| 1980 | 18.5996 | 28.11968 | 289 | 57 | 0.37 |
| 1981 | 18.18091 | 27.48105 | 291 | 45 | 0.35 |
| 1982 | 18.76482 | 27.83626 | 306 | 42 | 0.85 |
| 1983 | 18.84029 | 27.89772 | 307 | 47 | 0.5 |
| 1984 | 17.71544 | 27.18759 | 316 | 40 | 0.13 |
| 1985 | 17.92867 | 27.61347 | 306 | 50 | 0.37 |
| 1986 | 18.80319 | 27.00445 | 317 | 45 | 0.08 |
| 1987 | 18.98408 | 27.15319 | 317 | 46 | 0.46 |
| 1988 | 18.15105 | 27.88244 | 319 | 45 | 0.46 |
| 1989 | 18.00758 | 27.50341 | 299 | 48 | 0.17 |
| 1990 | 18.3706 | 27.36396 | 294 | 45 | -0.12 |
| 1991 | 17.96976 | 27.05178 | 309 | 63 | 0.07 |
| 1992 | 17.95822 | 27.58992 | 322 | 60 | 0.29 |
| 1993 | 17.84281 | 27.99757 | 310 | 57 | 0.12 |
| 1994 | 18.57179 | 27.97479 | 309 | 43 | 0.56 |
| 1995 | 18.49688 | 27.11473 | 306 | 45 | -0.01 |
| 1996 | 17.79264 | 27.46173 | 293 | 57 | 0.39 |
| 1997 | 17.65372 | 27.04273 | 310 | 57 | -0.17 |
| 1998 | 18.47935 | 27.58827 | 297 | 47 | 0.27 |
| 1999 | 17.94246 | 27.58386 | 306 | 62 | 0.23 |
| 2000 | 17.5882 | 26.93691 | 302 | 49 | 0.04 |
| 2001 | 18.52515 | 26.75864 | 319 | 38 | 0.05 |
| 2002 | 18.08847 | 26.81604 | 297 | 55 | -0.64 |
| 2003 | 18.72494 | 27.09882 | 306 | 43 | 0.14 |
| 2004 | 18.31746 | 27.09686 | 316 | 51 | -0.01 |
| 2005 | 17.07721 | 27.37923 | 308 | 38 | -0.62 |
| 2006 | 16.7209 | 27.09882 | 298 | 30 | -0.99 |
| 2007 | 17.21196 | 26.24784 | 308 | 47 | -1.05 |
| 2008 | 18.43071 | 27.30686 | 310 | 46 | 0 |
| 2009 | 17.43751 | 26.17157 | 303 | 53 | -0.24 |
| 2010 | 17.39862 | 26.71555 | 313 | 42 | -0.4 |
| 2011 | 16.74368 | 26.17913 | 307 | 42 | -1.24 |
| 2012 | 17.82476 | 25.90133 | 313 | 51 | -0.81 |
| 2013 | 18.21356 | 27.4959 | 306 | 37 | 0.2 |
The Year End Graph.

2013 was a banner year for Antarctic Sea Ice Extent. I enjoy my small role in publicizing this data because the “climate science” profession prefers to ignore Antarctic Sea Ice. Of course it is a little harder for the MSM to ignore Antarctica this year when a ship of “scientists” searching for publicity about lower sea ice caused by “global warming” get stuck in the ice.
The highest maximum for Antarctic Sea Ice Extent of all time was set on October 1st 2013.
The highest average anomaly for a year occurred in 2013. 2013 averaged 850,000 sq km above the 1981-2010 mean.
In 2013, the highest extent ever in each month occurred in July, August, September, October and November.
2013 now has the 2nd highest number of daily records (behind 2008). 2013 also has by far the most “Top 2” days in a year. Only 1979 is left in the list of daily records from before 2000.
| Year | First | Second | Top 2 |
| 2013 | 108 | 149 | 257 |
| 2008 | 121 | 29 | 150 |
| 2010 | 90 | 42 | 132 |
| 2009 | 8 | 33 | 41 |
| 2012 | 8 | 22 | 30 |
| 2006 | 1 | 26 | 27 |
| 1979 | 2 | 12 | 14 |
| 2000 | 4 | 3 | 7 |
| 2004 | 3 | 4 | 7 |
Here are the key stats for each year. Min/Max/Anomaly in millions sq km.
| Year | Min | Max | day of Max | day of Min | Avg Anomaly |
| 1979 | 2.91521 | 18.36699 | 256 | 48 | 0.04 |
| 1980 | 2.52686 | 19.09137 | 267 | 57 | -0.39 |
| 1981 | 2.69524 | 18.85906 | 261 | 51 | -0.21 |
| 1982 | 2.8927 | 18.55004 | 246 | 52 | -0.02 |
| 1983 | 2.84656 | 18.81042 | 263 | 55 | -0.25 |
| 1984 | 2.38292 | 18.37747 | 266 | 58 | -0.2 |
| 1985 | 2.60211 | 18.93215 | 254 | 50 | -0.04 |
| 1986 | 2.95395 | 18.02672 | 261 | 65 | -0.55 |
| 1987 | 3.01642 | 18.52332 | 258 | 52 | -0.24 |
| 1988 | 2.63862 | 18.78456 | 277 | 55 | -0.14 |
| 1989 | 2.7229 | 18.27368 | 266 | 51 | -0.23 |
| 1990 | 2.78435 | 18.3788 | 273 | 53 | -0.24 |
| 1991 | 2.55355 | 18.66993 | 273 | 58 | -0.11 |
| 1992 | 2.49238 | 18.4663 | 255 | 54 | -0.24 |
| 1993 | 2.28078 | 18.709 | 263 | 50 | -0.23 |
| 1994 | 3.08286 | 18.8266 | 243 | 43 | 0.12 |
| 1995 | 3.32988 | 18.7353 | 269 | 55 | 0.15 |
| 1996 | 2.59733 | 18.83039 | 267 | 56 | 0.13 |
| 1997 | 2.26415 | 18.79094 | 265 | 58 | -0.26 |
| 1998 | 2.7715 | 19.2433 | 258 | 56 | 0.08 |
| 1999 | 2.70723 | 18.98068 | 273 | 51 | 0.11 |
| 2000 | 2.58248 | 19.15817 | 272 | 49 | 0.11 |
| 2001 | 3.44094 | 18.49324 | 271 | 50 | 0.02 |
| 2002 | 2.69691 | 18.11556 | 252 | 51 | -0.43 |
| 2003 | 3.6257 | 18.67907 | 268 | 48 | 0.32 |
| 2004 | 3.25927 | 19.12341 | 252 | 51 | 0.32 |
| 2005 | 2.80387 | 19.29451 | 272 | 49 | 0.04 |
| 2006 | 2.4866 | 19.35934 | 264 | 51 | -0.19 |
| 2007 | 2.7227 | 19.08545 | 272 | 50 | 0.03 |
| 2008 | 3.69176 | 18.29726 | 247 | 51 | 0.6 |
| 2009 | 2.67096 | 19.29864 | 267 | 53 | 0.39 |
| 2010 | 2.8422 | 18.9968 | 249 | 47 | 0.45 |
| 2011 | 2.31884 | 18.95328 | 266 | 53 | -0.15 |
| 2012 | 3.11109 | 19.47713 | 266 | 54 | 0.36 |
| 2013 | 3.6504 | 19.57088 | 274 | 50 | 0.85 |
End of Year Graph