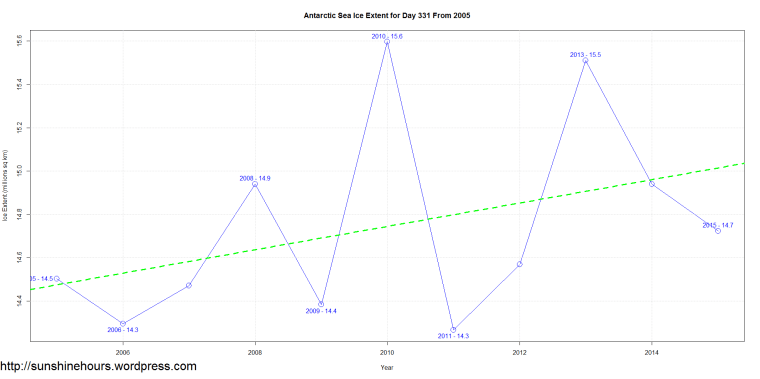
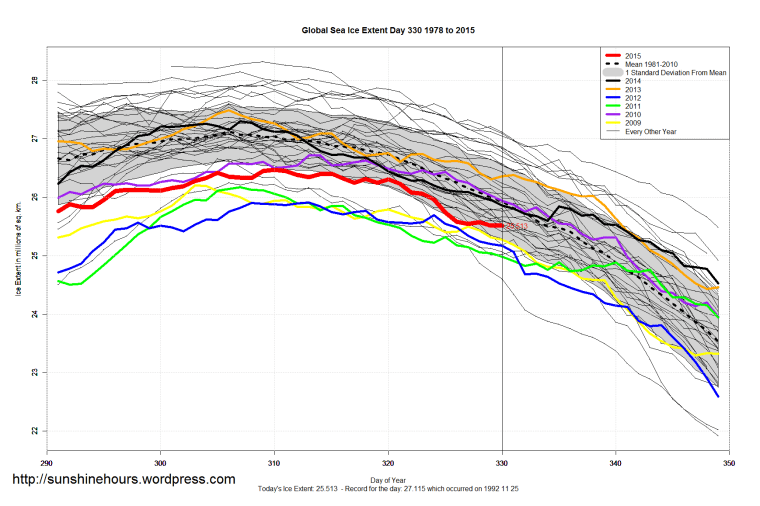
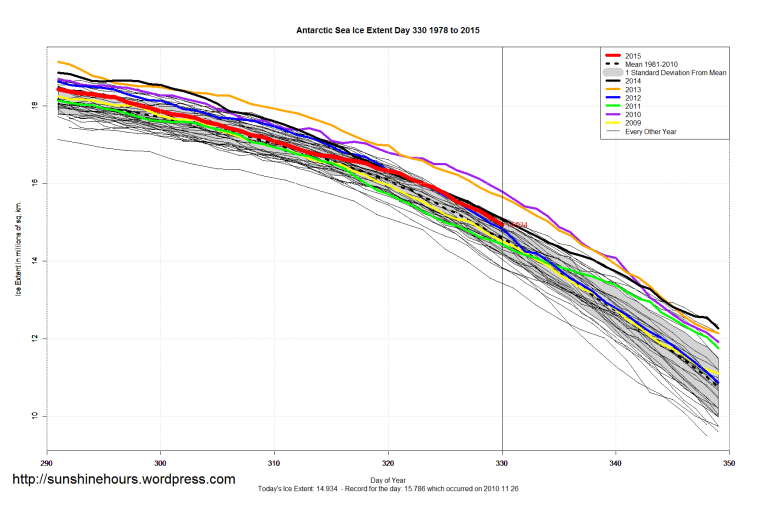
Sea Ice Extent (Global Antarctic and Arctic) – Day 331 – Trends From 2005 Published on November 28, 2015November 28, 2015 by sunshinehours13 Comments Day 331 – Trends From 2005 South / North
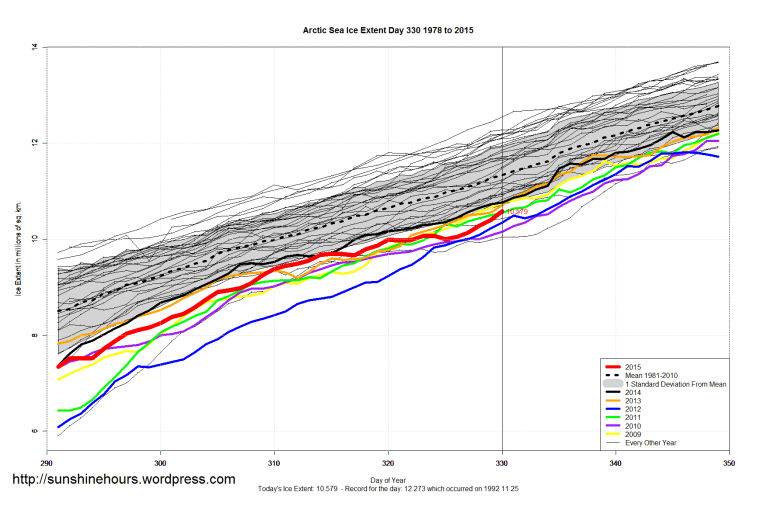
Sea Ice Extent (Global Antarctic and Arctic) – Day 330 Published on November 27, 2015November 27, 2015 by sunshinehours1Leave a comment South / North
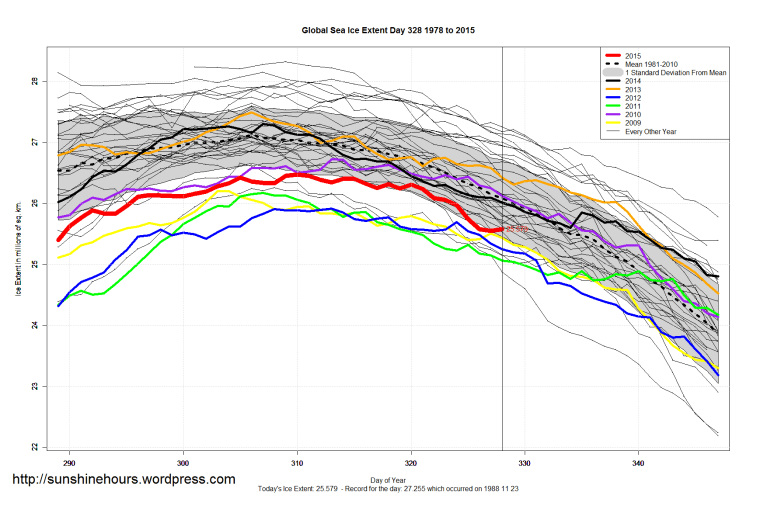
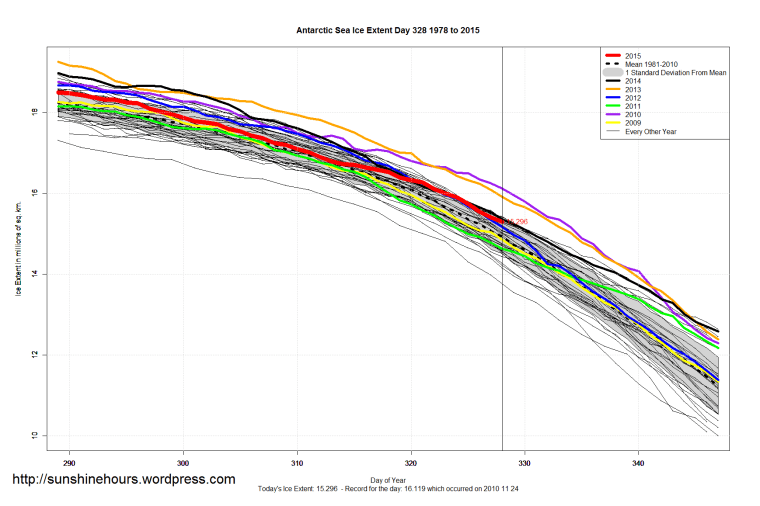
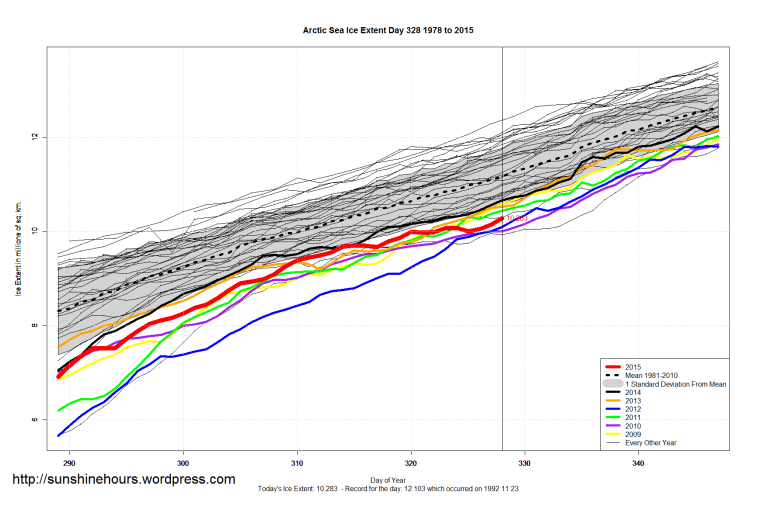
Sea Ice Extent (Global Antarctic and Arctic) – Day 328 Published on November 25, 2015November 25, 2015 by sunshinehours17 Comments South / North
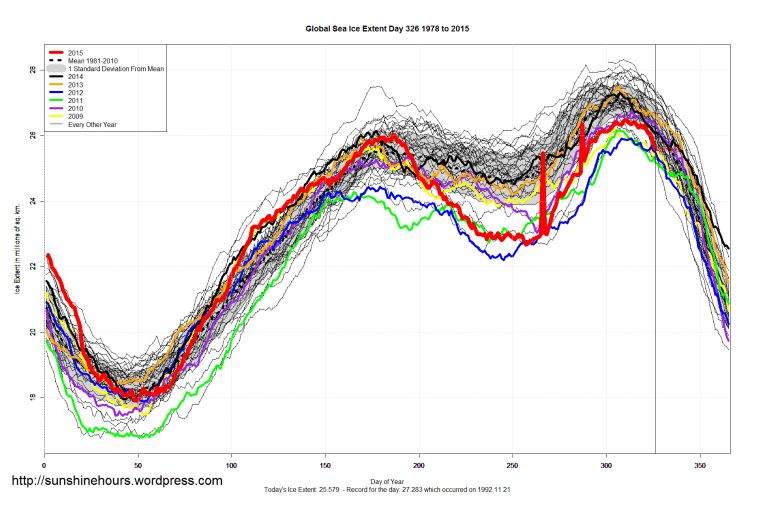
Sea Ice Extent (Global Antarctic and Arctic) – Day 326 Published on November 23, 2015November 23, 2015 by sunshinehours11 Comment All 6 graphs (zoomed and the whole year) South / North
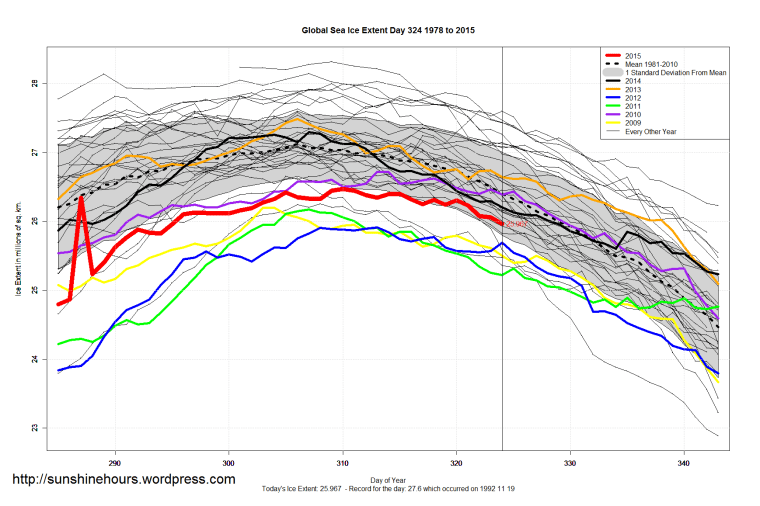
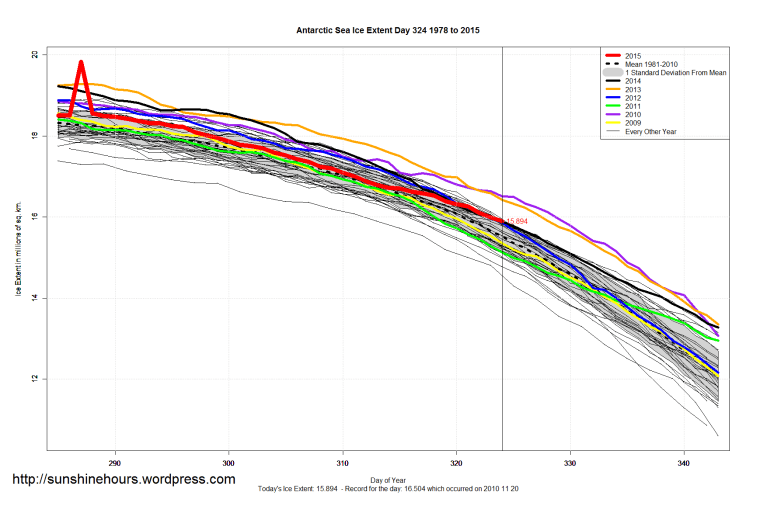
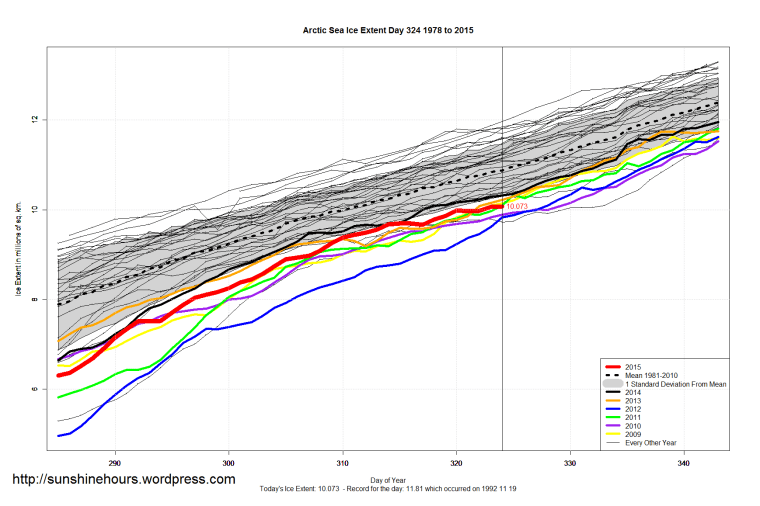
Sea Ice Extent (Global Antarctic and Arctic) – Day 324 Published on November 21, 2015November 21, 2015 by sunshinehours12 Comments South / North
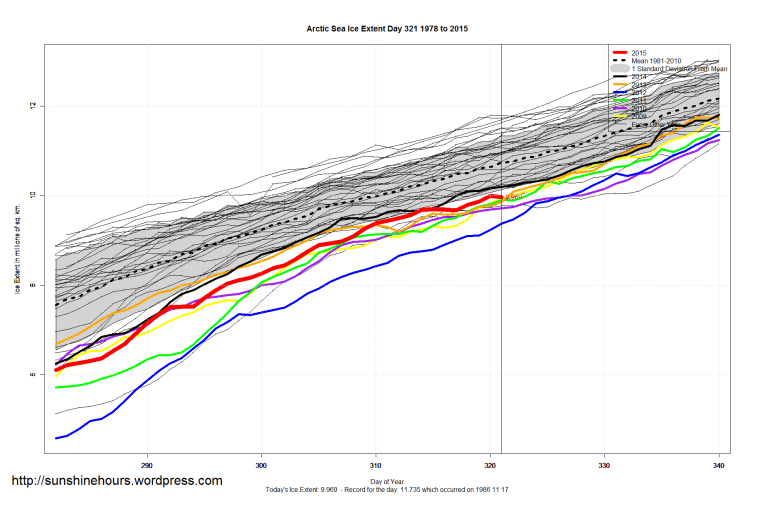
Sea Ice Extent (Global Antarctic and Arctic) – Day 321 Published on November 18, 2015 by sunshinehours1Leave a comment South / North
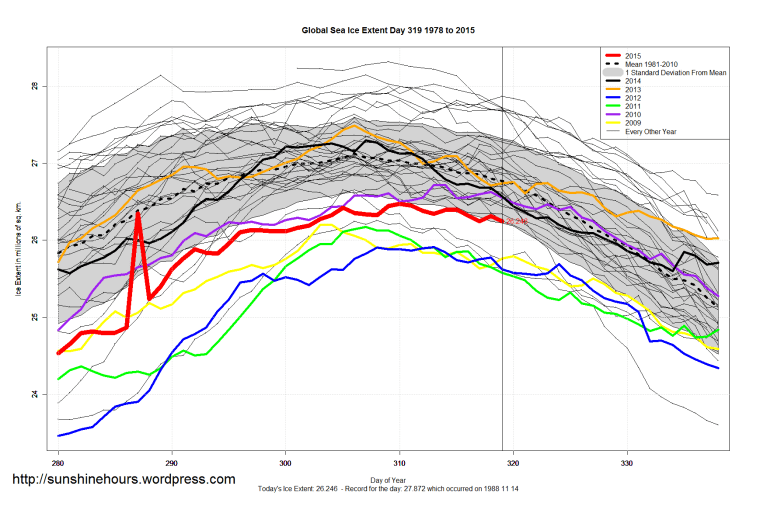
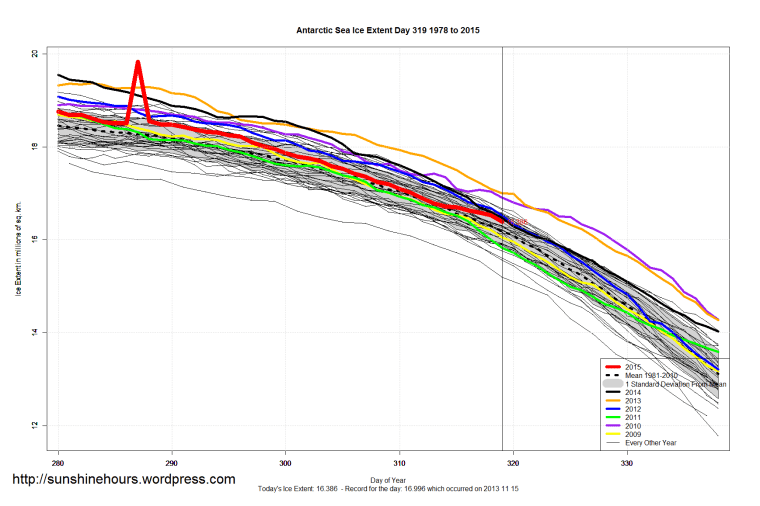
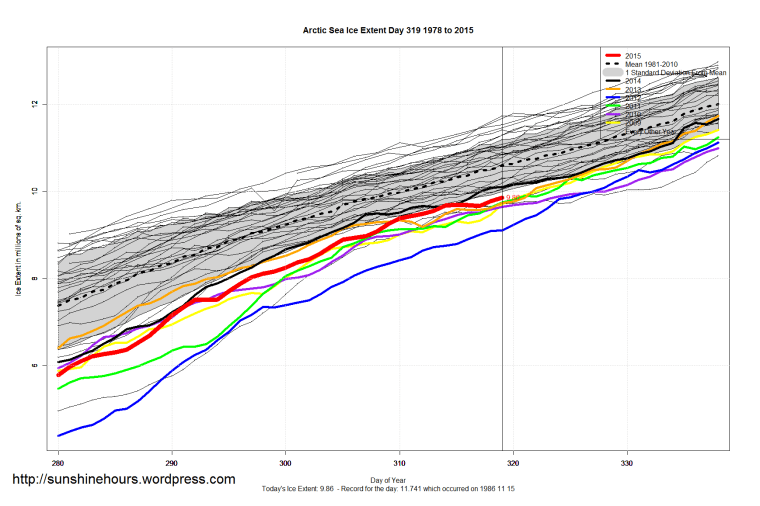
Sea Ice Extent (Global Antarctic and Arctic) – Day 319 Published on November 17, 2015 by sunshinehours1Leave a comment Data for day 319 is from November 15. (I’m late). Day 320’s data should have been out this morning. But it isn’t yet. South / North
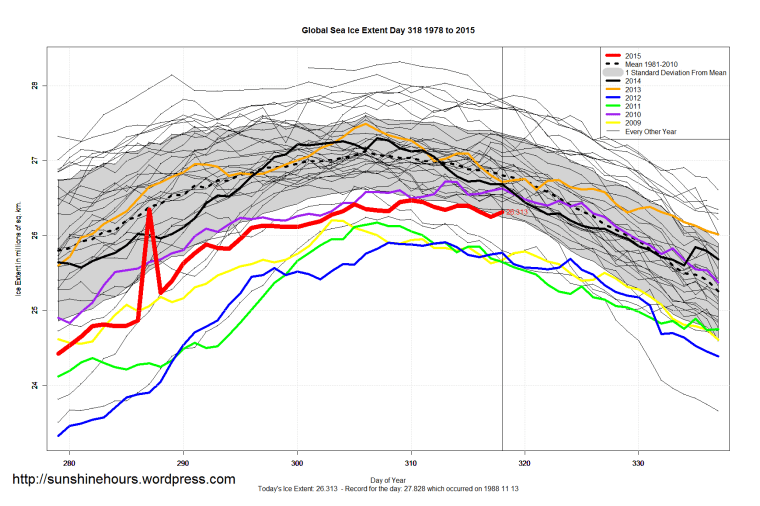
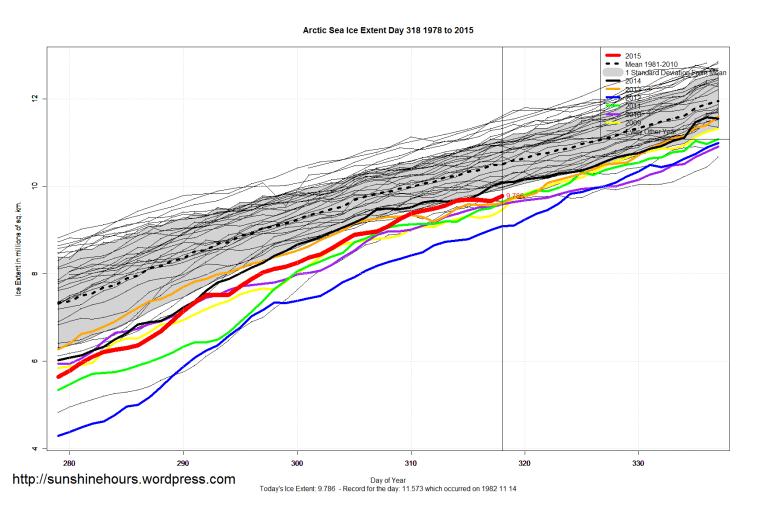
Sea Ice Extent (Global Antarctic and Arctic) – Day 318 Published on November 15, 2015 by sunshinehours11 Comment South / North
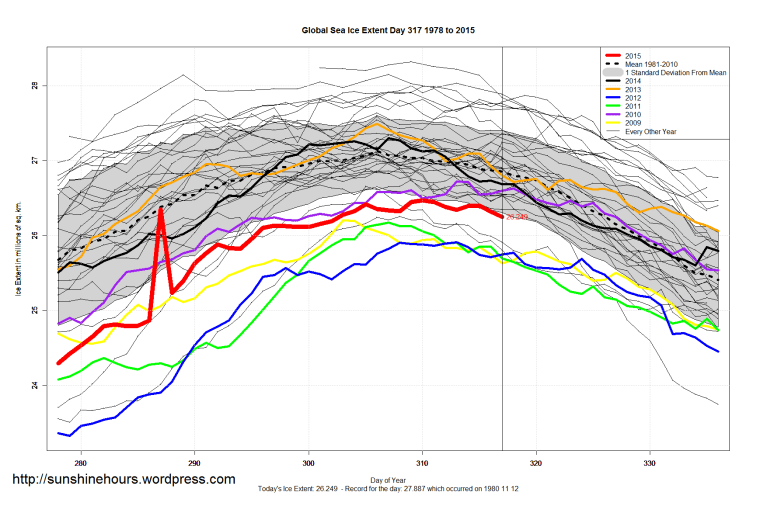
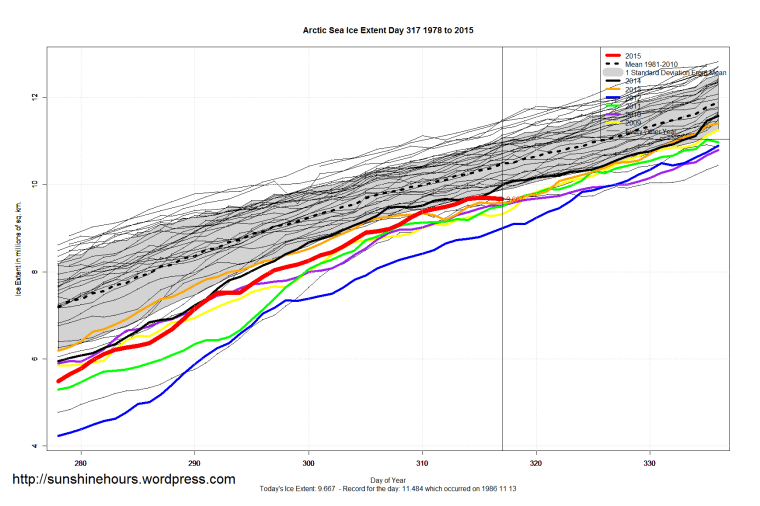
Sea Ice Extent (Global Antarctic and Arctic) – Day 317 Published on November 14, 2015November 14, 2015 by sunshinehours1Leave a comment South / North
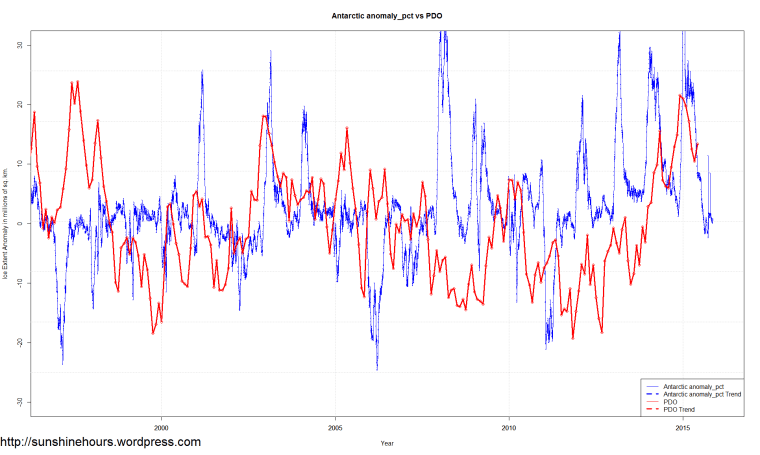
Antarctic Ice Extent Anomaly % vs PDO Published on November 13, 2015November 13, 2015 by sunshinehours13 Comments This graph compares Anomaly Percent (ie if the anomaly is 1,000,000 sq km and the mean is 10,000,000 the value would be 10%)