Sea Ice Update April 30 2014 – Antarctic Sea Ice 52nd daily record – Global Sea Ice 980,000 sq km Above Normal

A quick update for sea ice extent for day 119 of 2014:

  • Global Sea Ice Extent is 981,000 sq km above the 1981-2010 mean.
  • Antarctic Sea Ice Extent is 1,388,000 sq km above the 1981-2010 mean. That’s the 52nd daily record for 2014.
  • Arctic Sea Ice Extent is -407,000 sq km below the 1981-2010 mean.  Only 190,000 sq km melted in the last 11 days. Last year 600,000 sq km melted in same 11 days.

NOAA Data here and here here. Graphs below. Click for bigger.

Global_Sea_Ice_Extent_Zoomed_2014_Day_119_1981-2010 Antarctic_Sea_Ice_Extent_Zoomed_2014_Day_119_1981-2010 Arctic_Sea_Ice_Extent_Zoomed_2014_Day_119_1981-2010

MASIE April 29 2014 – Arctic Ice Extent By Region As of Day 118

April 29 2014  MASIE Update (This Arctic Sea Ice dataset frm MASIE only has 28 days of data.

This is the gain/loss from day 91 to day 118. Negative = loss. Sorted with biggest loser in last 7 days at top. Northern Hemisphere is the grand total.

Notice that even though the NH shows a 404,000 melt in the last 14 days, only 16,782 melted in last 7 days.

The bottom 5 have all gained in last 7 days. Including 102,200 in the Barents Sea.

Region Start End Last 28 Last 14 Last 7 Days
Northern Hemisphere 14,789,245 13,959,969 -829,276 -404,018 -16,782
Baffin Bay Gulf of St. Lawrence 1,711,230 1,454,513 -256,717 -151,655 -79,359
Bering Sea 664,041 474,076 -189,965 -160,060 -70,680
Baltic Sea 15,337 8,725 -6,612 -7,013 -653
Beaufort Sea 1,070,445 1,070,445 0 0 0
Chukchi Sea 966,006 966,006 0 0 0
East Siberian Sea 1,087,137 1,087,137 0 0 0
Laptev Sea 897,845 897,845 0 0 0
Canadian Archipelago 853,214 853,214 0 0 0
Hudson Bay 1,260,903 1,260,903 0 0 0
Yellow Sea 0 0 0 0 0
Sea of Okhotsk 829,717 376,689 -453,028 -118,565 223
Central Arctic 3,231,886 3,248,013 16,127 4,581 1,482
Greenland Sea 624,163 649,651 25,488 15,511 13,156
Kara Sea 932,891 935,023 2,132 0 16,849
Barents Sea 634,409 675,523 41,114 15,469 102,200


Here is the MASIE graph. The flat lines at the bottom are regions that have melted and are now  ice free. The completely flat lines elsewhere indicate no melting at all yet. The changing lines indicate melting regions.

Click for bigger.

MASIE Arctic Ice Extent as of 2014118


Sea Ice Update April 28 2014 – Antarctic Sea Ice 50% higher than 1980! – Global Sea Ice 1.02 million sq km Above Normal

A quick update for sea ice extent for day 117 of 2014:

  • Global Sea Ice Extent is 1,027,000 sq km above the 1981-2010 mean.
  • Antarctic Sea Ice Extent is 1,461,000 sq km above the 1981-2010 mean. That is the 50th daily record of 2014. For day 117, 2014 Antarctic Sea Ice Extent is is 50% higher than 1980!
  • Arctic Sea Ice Extent is -434,000 sq km below the 1981-2010 mean.

NOAA Data here and here here. Graphs below. Click for bigger.

Antarctic Sea Ice Extent for Day 117 From 1980 (infilled) Global_Sea_Ice_Extent_Zoomed_2014_Day_117_1981-2010 Antarctic_Sea_Ice_Extent_Zoomed_2014_Day_117_1981-2010 Arctic_Sea_Ice_Extent_Zoomed_2014_Day_117_1981-2010

MASIE April 26 2014 – Arctic Ice Extent By Region As of Day 115

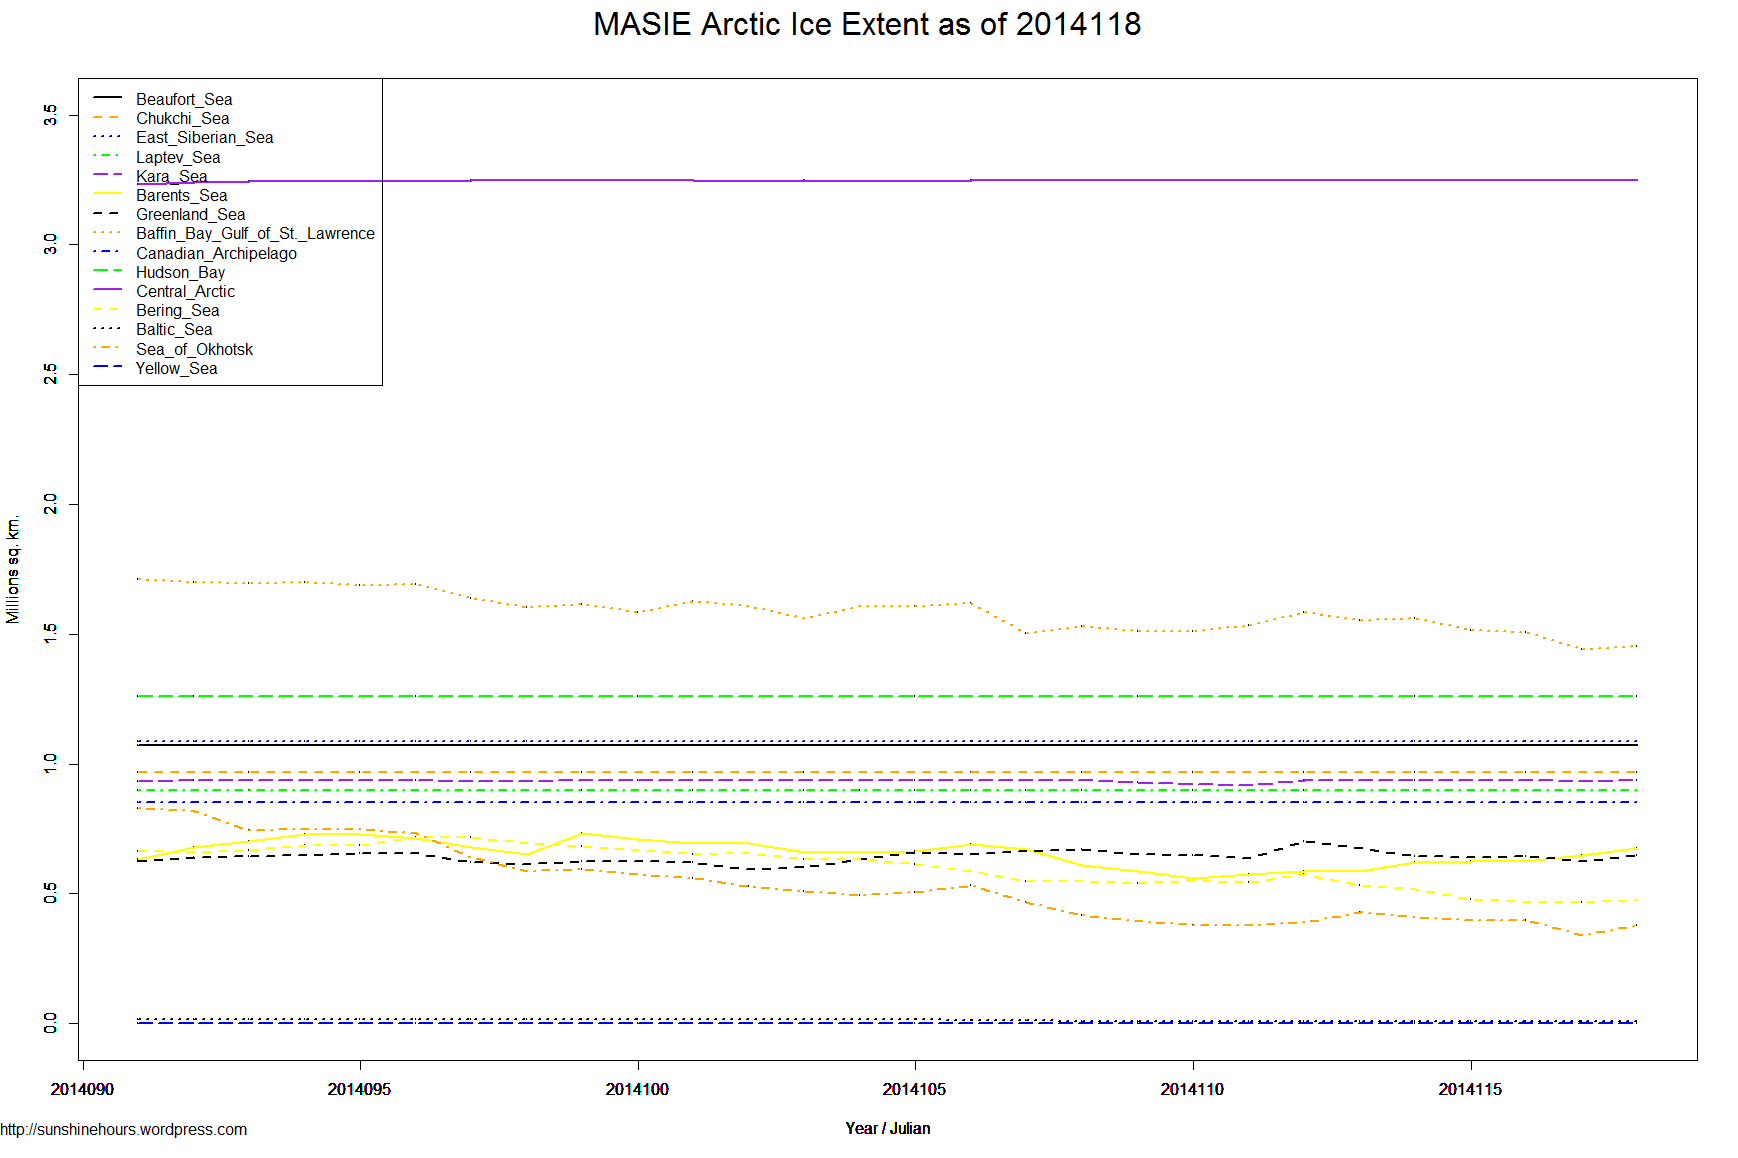
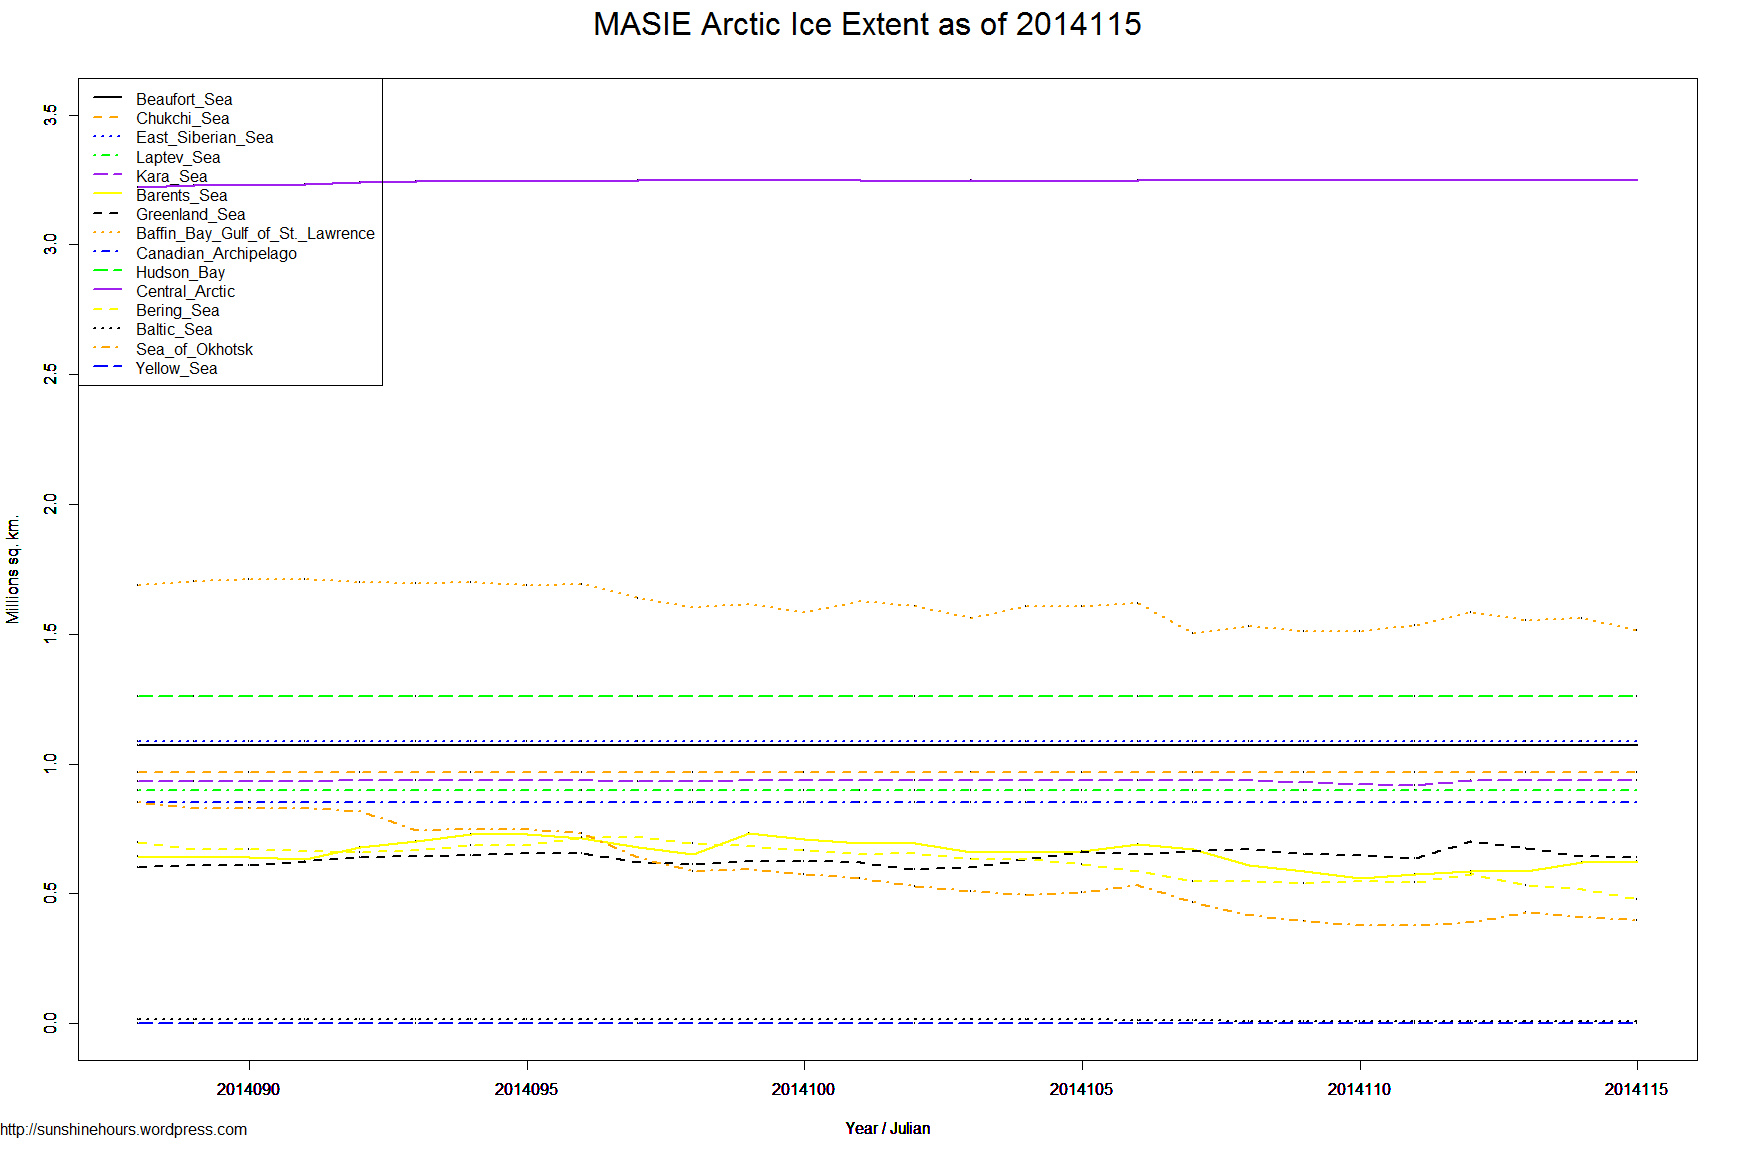
This Arctic Sea Ice dataset frm MASIE only has 28 days of data. I leave out the NH total otherwise the all of the other lines would look kind of flat.

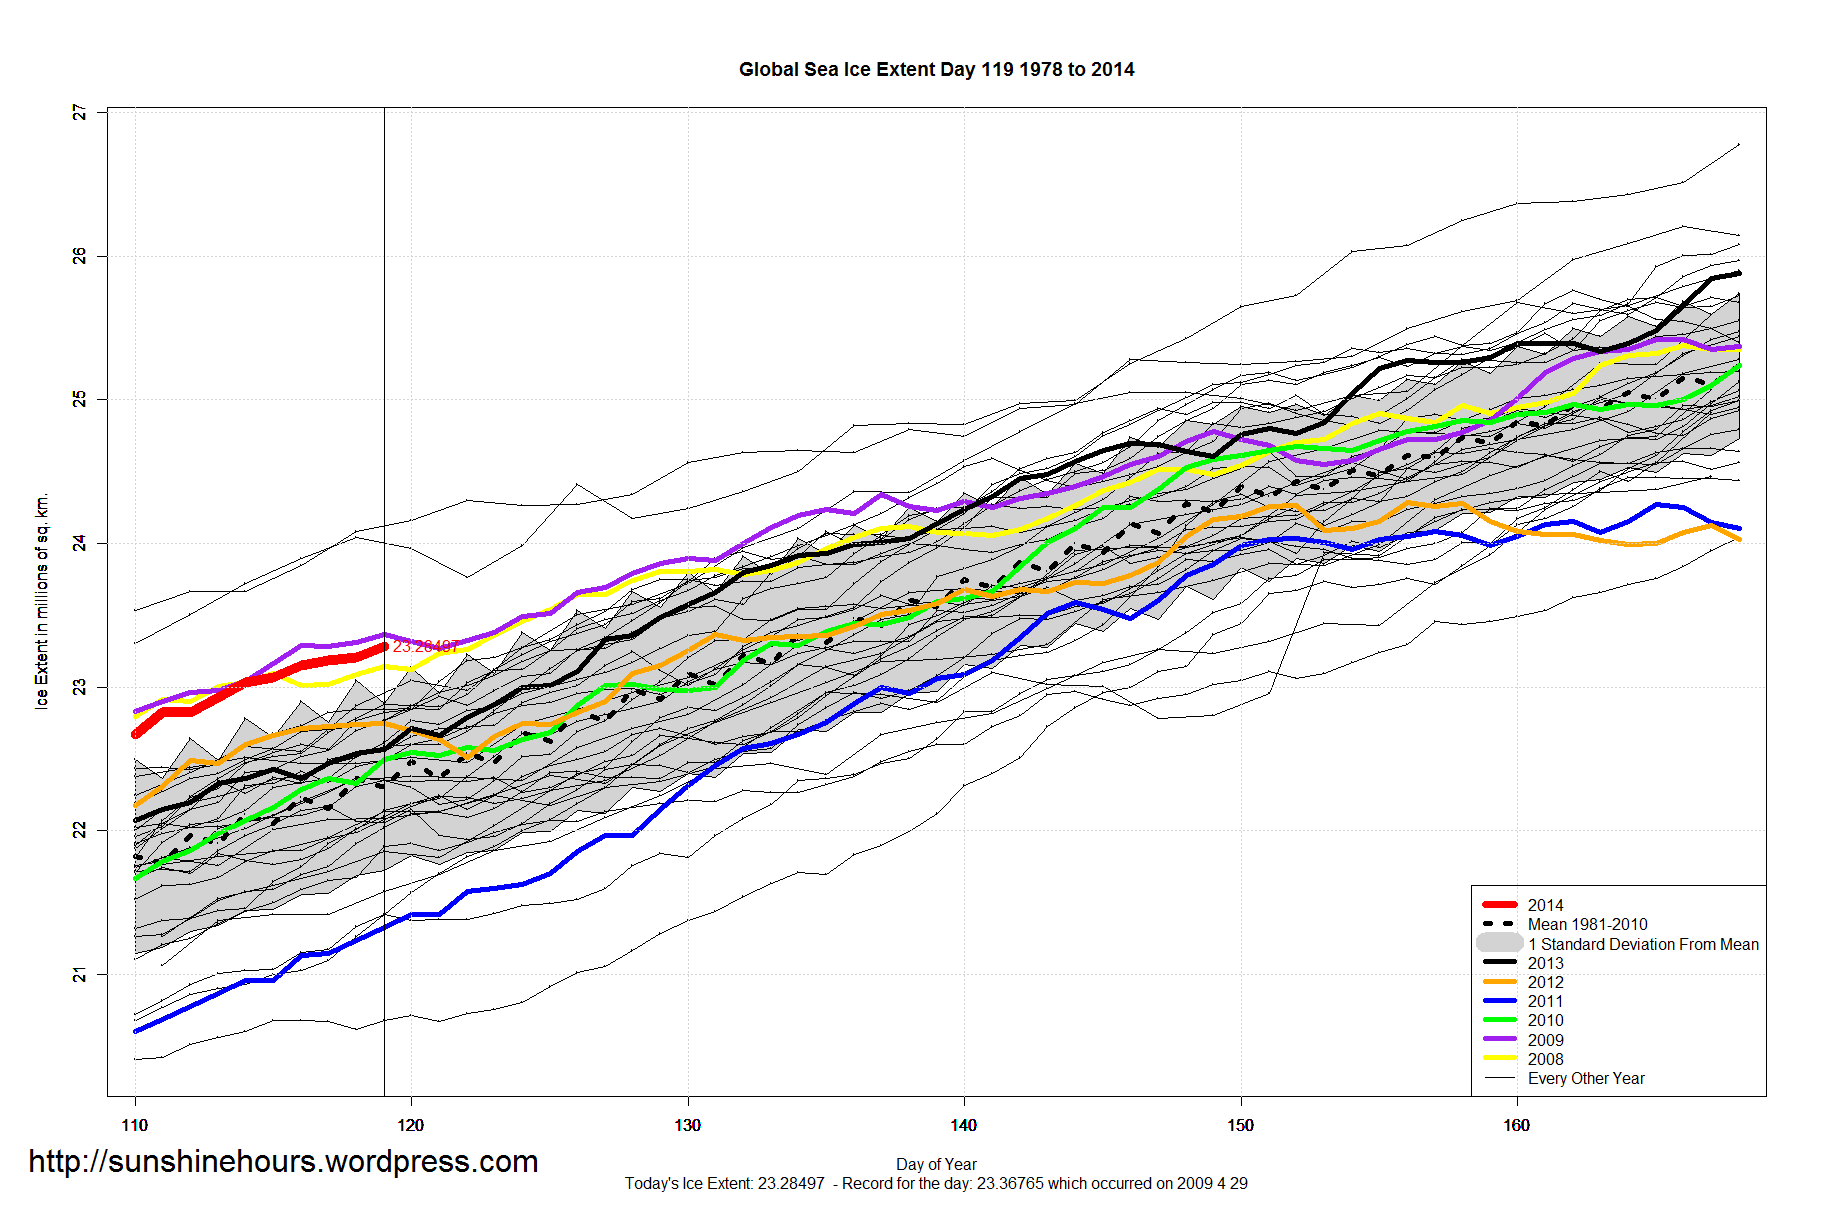
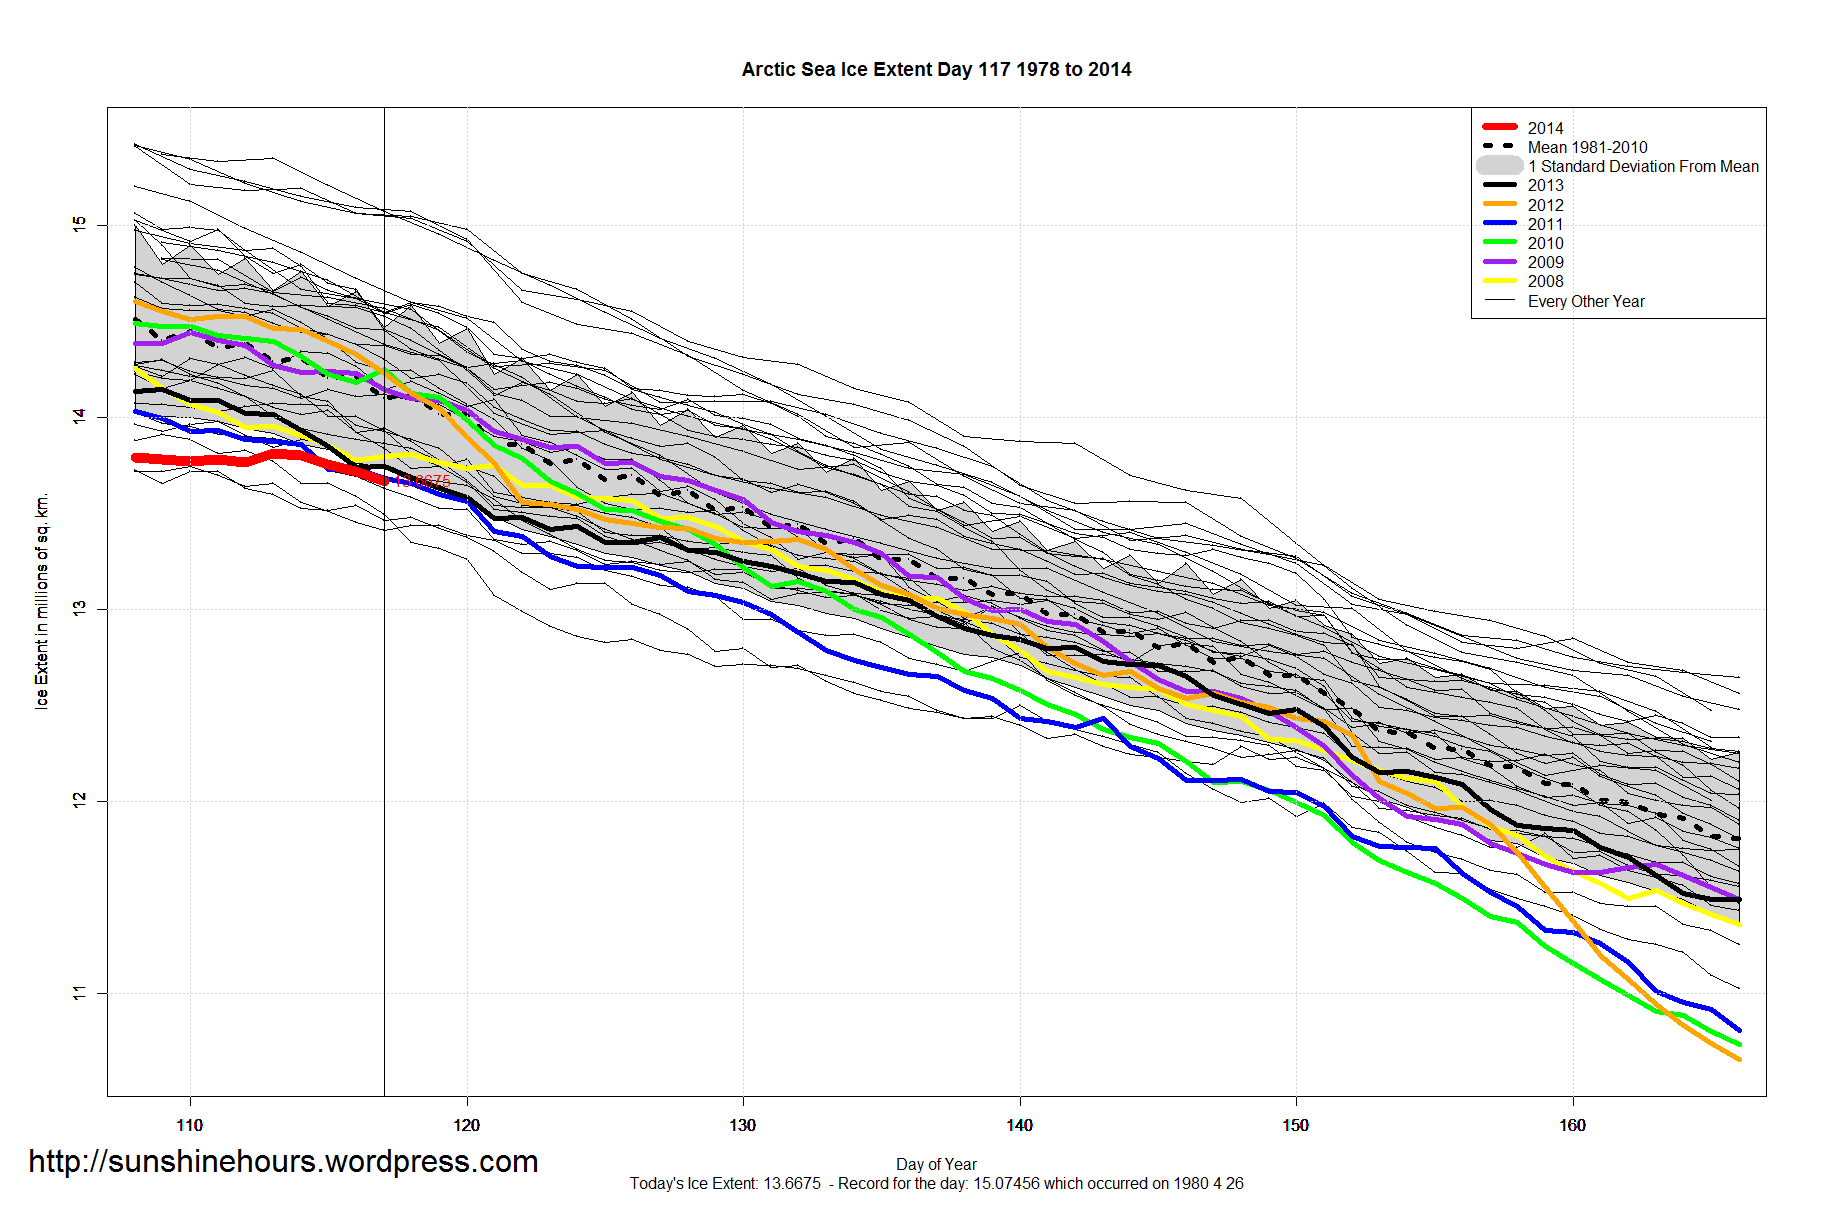
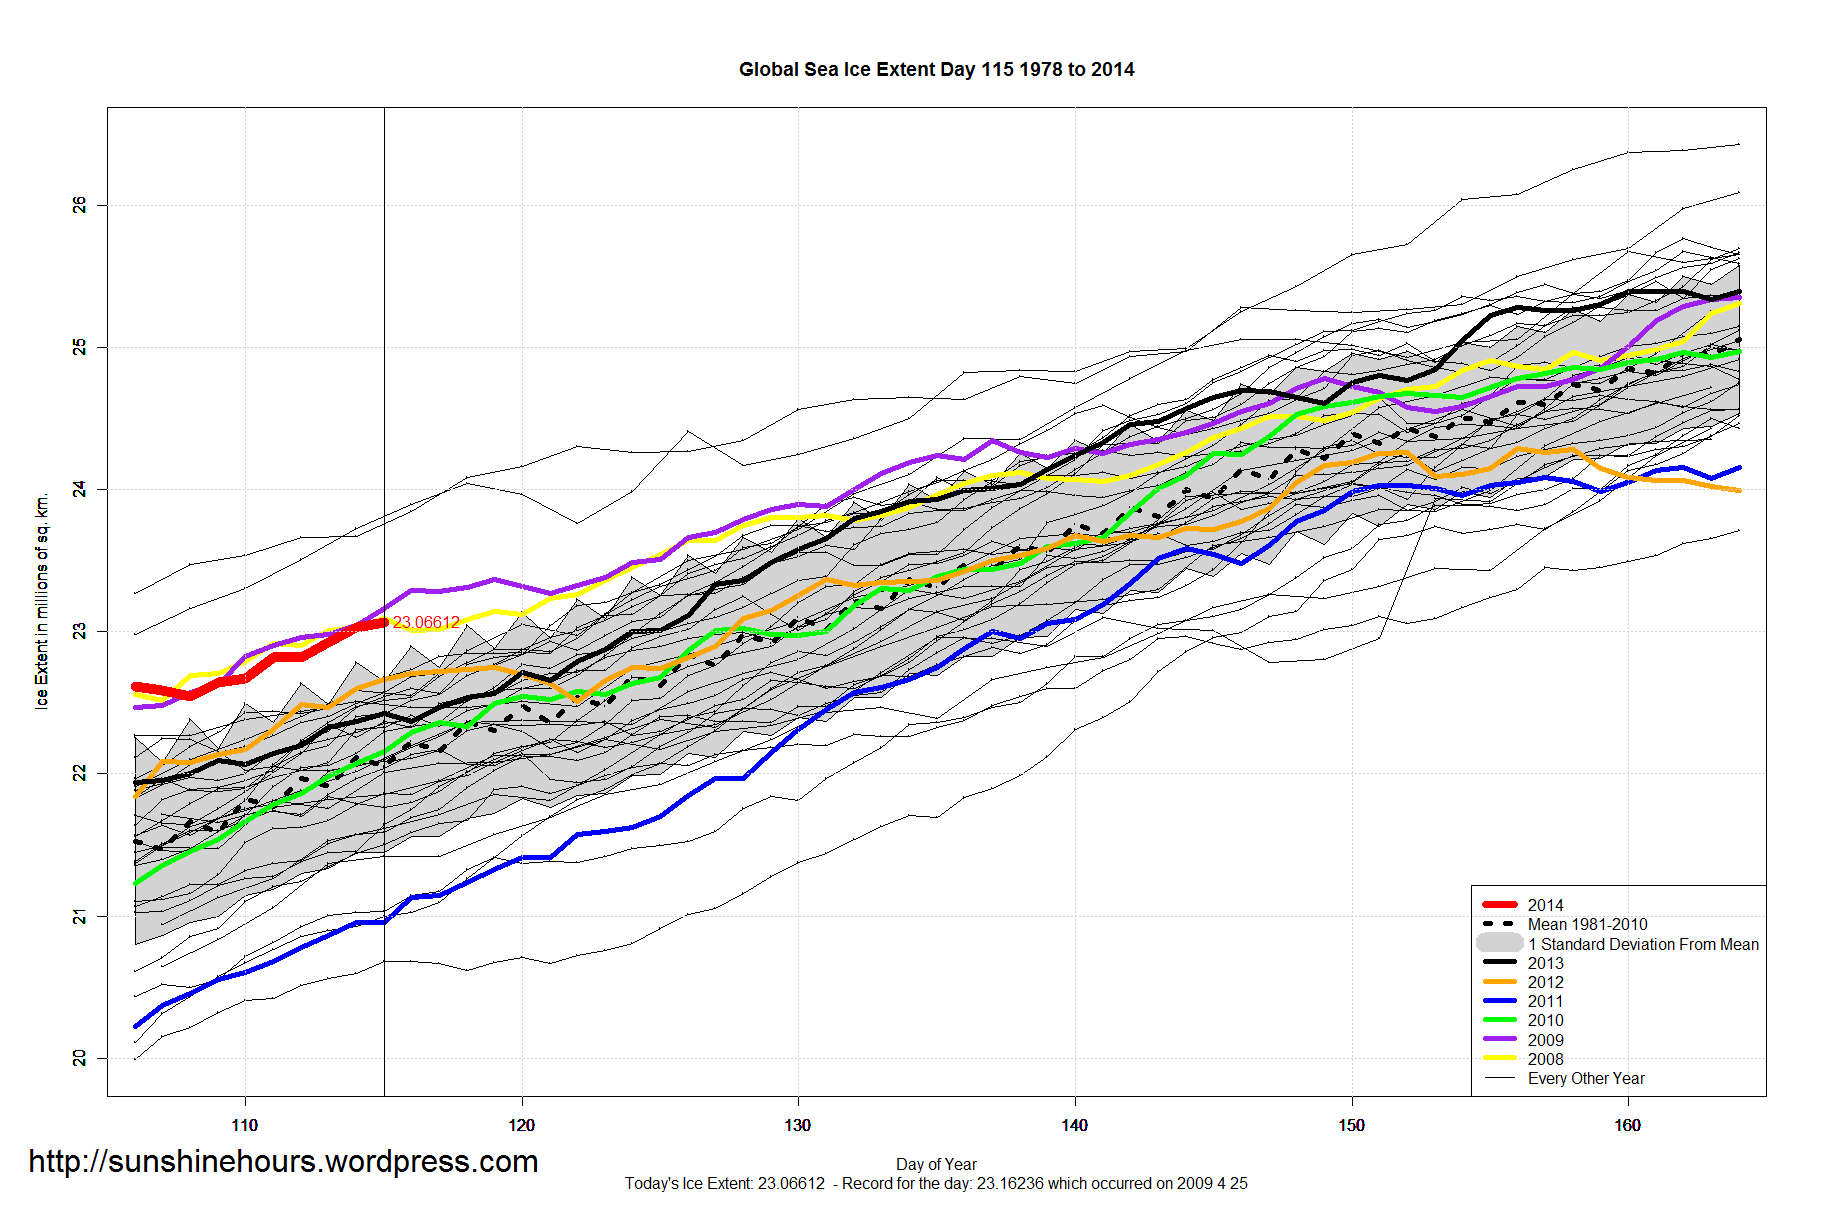
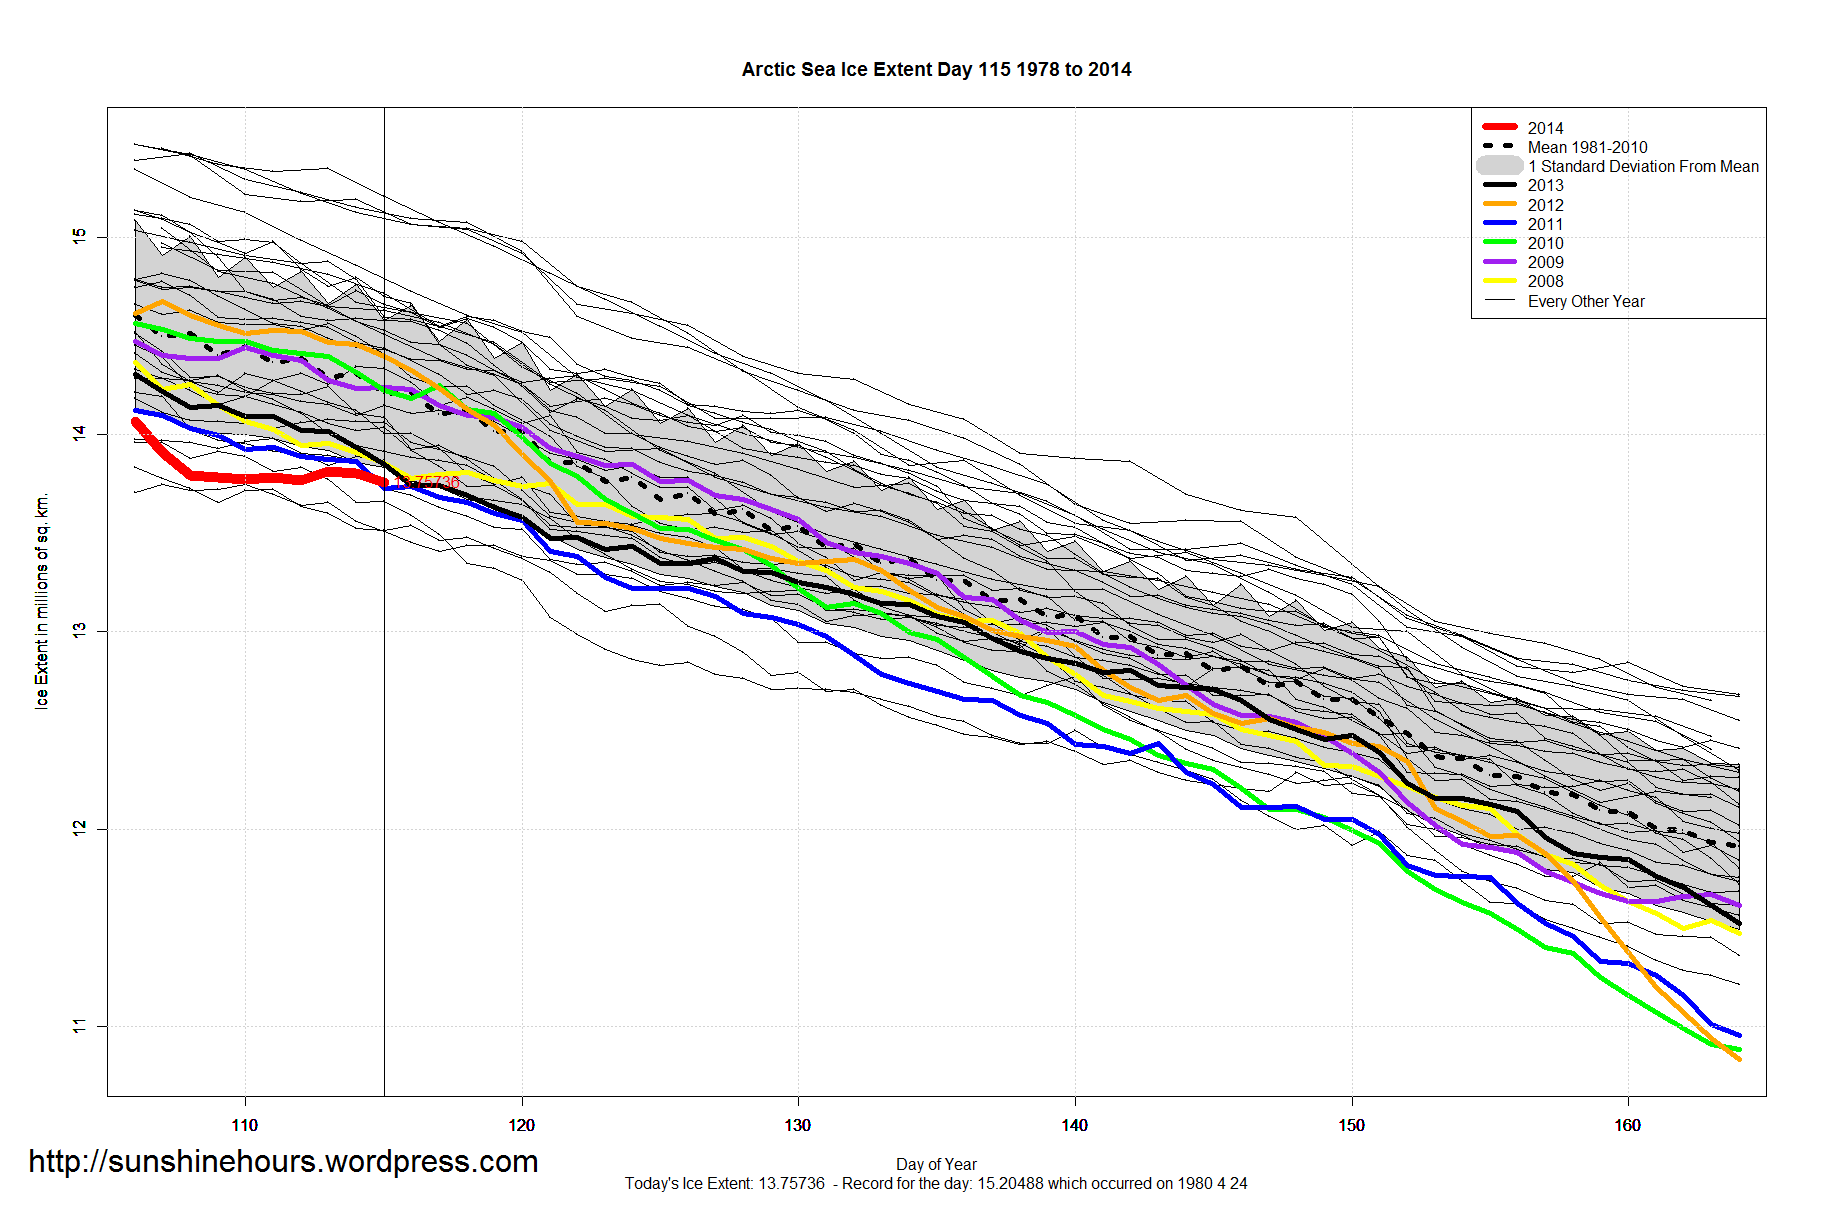
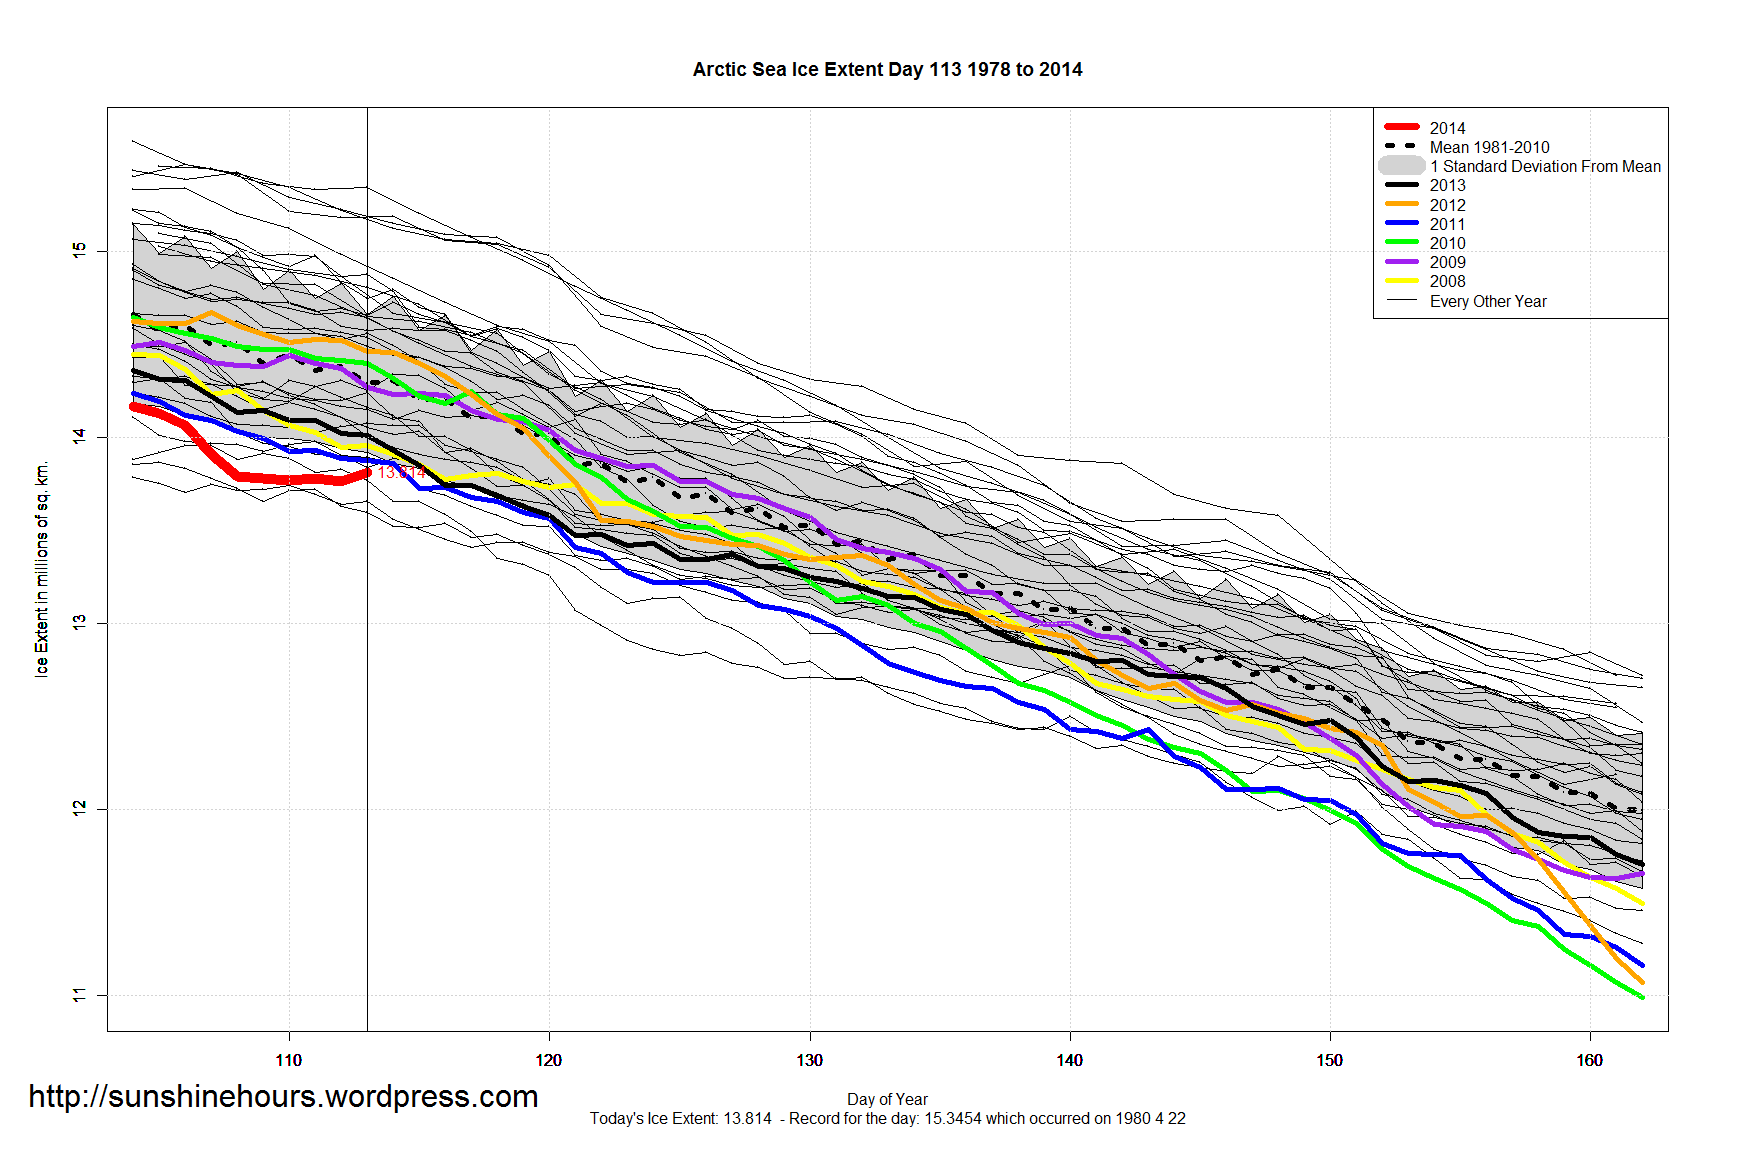
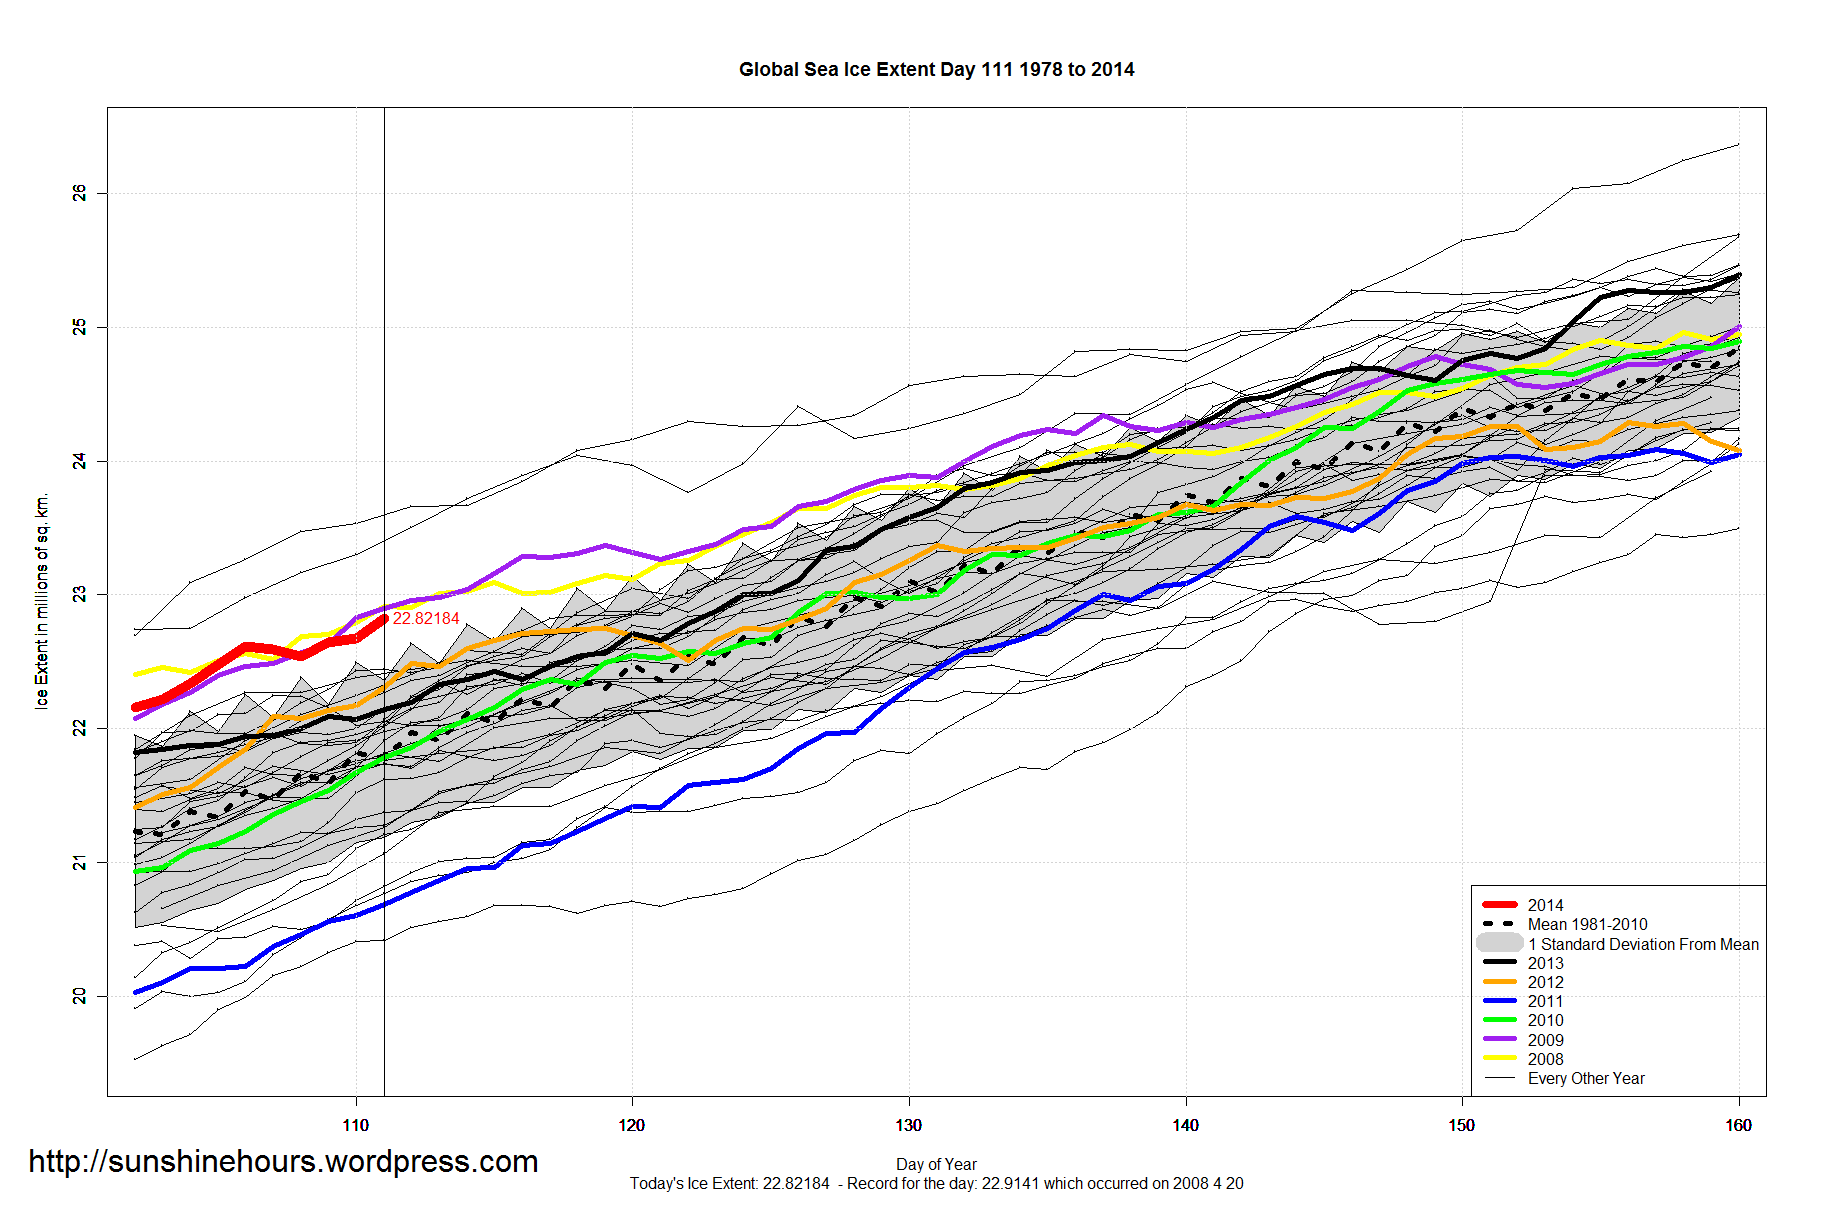
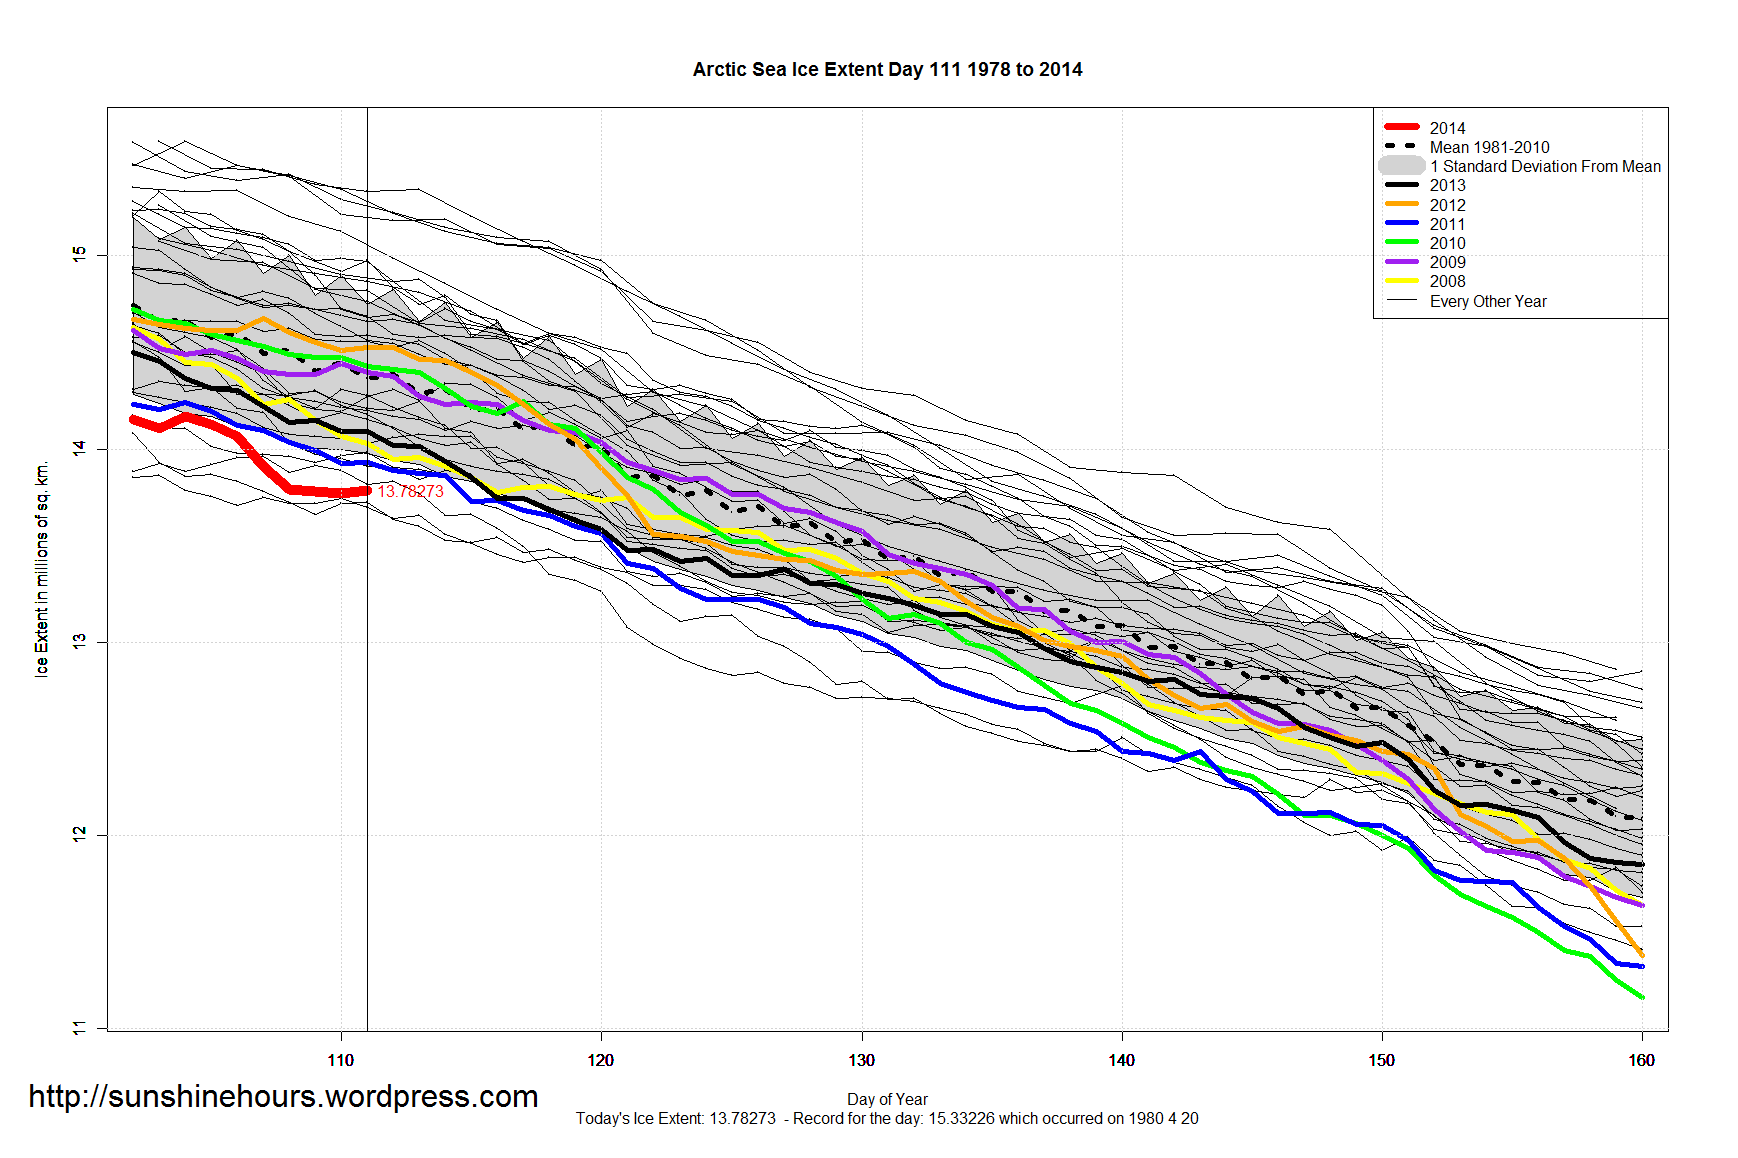
Earlier today I posted my sea ice update and noted that ice loss in the Arctic had been almost flat for a week (compared to last year).

MASIE totals are not identical to NSIDC totals. Its the trend that is worth looking at.

This is the gain/loss from day 88 to day 115. Negative = loss. Sorted with biggest loser in last 7 days at top. Northern_Hemisphere is the grand total.

Region Start End Last 28 Days Last 14 Last 7
Northern_Hemisphere 14,805,115 13,984,885 -820,230 -509,465 -121,570
Bering_Sea 697,324 479,375 -217,949 -173,774 -68,905
Greenland_Sea 603,416 639,494 36,078 20,265 -32,575
Sea_of_Okhotsk 853,240 398,045 -455,195 -162,679 -18,897
Baffin_Bay_Gulf_of_St._Lawrence 1,688,530 1,515,185 -173,346 -112,258 -14,610
Baltic_Sea 15,337 8,172 -7,165 -7,566 -1,958
Beaufort_Sea 1,070,445 1,070,445 0 0 0
Chukchi_Sea 966,006 966,006 0 0 0
East_Siberian_Sea 1,087,137 1,087,137 0 0 0
Laptev_Sea 897,845 897,845 0 0 0
Kara_Sea 933,859 935,023 1,164 0 0
Canadian_Archipelago 853,214 853,214 0 0 0
Hudson_Bay 1,260,903 1,260,903 0 0 0
Central_Arctic 3,221,921 3,248,013 26,092 452 0
Yellow_Sea 0 0 0 0 0
Barents_Sea 645,917 623,822 -22,096 -71,839 15,375

The flat lines at the bottom are regions that have melted and are now  ice free. The completely flat lines elsewhere indicate no melting at all yet. The changing lines indicate melting regions.

The purple line near the top is the “Central Arctic “.  You can barely notice it rose from 3221921 on day 88 to 3248013 on day 115.

(I wish I had historical MASIE data) Click for bigger.

MASIE Arctic Ice Extent as of 2014115


Sea Ice Update April 26 2014 – Antarctic Sea Ice 48th Daily Record of 2014 – Global Sea Ice 1.02 million sq km Above Normal

A quick update for sea ice extent for day 115 of 2014:

  • Global Sea Ice Extent is 1,016,000 sq km above the 1981-2010 mean.
  • Antarctic Sea Ice Extent is 1,464,000 sq km above the 1981-2010 mean.  That’s the 48th daily record.
  • Arctic Sea Ice Extent is -448,000 sq km below the 1981-2010 mean. Melt practically stopped dead for the last week. Only 40,000 sq km melted since day 108. Last year 285,000 sq km melted in the same period.

NOAA Data here and here here. Graphs below. Click for bigger.

Global_Sea_Ice_Extent_Zoomed_2014_Day_115_1981-2010 Antarctic_Sea_Ice_Extent_Zoomed_2014_Day_115_1981-2010 Arctic_Sea_Ice_Extent_Zoomed_2014_Day_115_1981-2010


Sea Ice Update April 24 2014 – Antarctic Sea Ice 46th Daily Record of 2014 – Global Sea Ice 1.01 million sq km Above Normal

A quick update for sea ice extent for day 113 of 2014:

  • Global Sea Ice Extent is 1,013,000 sq km above the 1981-2010 mean.
  • Antarctic Sea Ice Extent is 1,488,000 sq km above the 1981-2010 mean. That is the 18th daily record in a row and 46th for 2014
  • Arctic Sea Ice Extent is -476,000 sq km below the 1981-2010 mean. Day 113 is actually higher than the previous 5 days. Maybe near normal 80N temperatures have something to do with it.

NOAA Data here and here here. Graphs below. Click for bigger.

Global_Sea_Ice_Extent_Zoomed_2014_Day_113_1981-2010 Antarctic_Sea_Ice_Extent_Zoomed_2014_Day_113_1981-2010 Arctic_Sea_Ice_Extent_Zoomed_2014_Day_113_1981-2010


Sea Ice Update April 22 2014 – Antarctic Sea Ice 44th Daily Record of 2014 – Global Sea Ice 1.05 million sq km Above Normal

A quick update for sea ice extent for day 111 of 2014:

  • Global Sea Ice Extent is 1,047,000 sq km above the 1981-2010 mean.
  • Antarctic Sea Ice Extent is 1,627,000 sq km above the 1981-2010 mean. That is the 44th daily record for 2014.
  • Arctic Sea Ice Extent is -581,000 sq km below the 1981-2010 mean.

Data here. Graphs below. Click for bigger.


Global_Sea_Ice_Extent_Zoomed_2014_Day_111_1981-2010 Antarctic_Sea_Ice_Extent_Zoomed_2014_Day_111_1981-2010 Arctic_Sea_Ice_Extent_Zoomed_2014_Day_111_1981-2010


Sea Ice Update April 20 2014 – Global Sea Ice 1.05 million sq km Above Normal – Antarctic Sea Ice 42nd Daily Record

Happy Easter!

A quick update for sea ice extent:

  • Global Sea Ice Extent is 1,054,000 sq km above the 1981-2010 mean.
  • Antarctic Sea Ice Extent is 1,673,000 sq km above the 1981-2010 mean. That is the 42nd daily record for 2014.
  • Arctic Sea Ice Extent is -620,000 sq km below the 1981-2010 mean.

Data here. Graphs below. Click for bigger.


Global_Sea_Ice_Extent_Zoomed_2014_Day_109_1981-2010 Antarctic_Sea_Ice_Extent_Zoomed_2014_Day_109_1981-2010 Arctic_Sea_Ice_Extent_Zoomed_2014_Day_109_1981-2010


Sea Ice Update April 17 2014 – Highest Global Sea Ice For This Day in 30 years – Over 1 Million Sq Km Above Normal

A quick update for sea ice extent:

  • Global Sea Ice Extent is 1,088,000 sq km above the 1981-2010 mean. That is ranked 3 for the day.
  • Antarctic Sea Ice Extent is 1,622,000 sq km above the 1981-2010 mean. That is ranked 1 for the day.
  • Arctic Sea Ice Extent is -534,000 sq km below the 1981-2010 mean. That is ranked 28 for the day.

Data here. Graphs below. Click for bigger.

Global_Sea_Ice_Extent_Zoomed_2014_Day_106_1981-2010


Global_Sea_Ice_Extent_2014_Day_106_1981-2010

Sea Ice Update April 15 2014 – Global Sea Ice 955,000 sq km Above Normal and Antarctica 1,451,000 sq km Above Normal

A quick update for sea ice extent:

  • Global Sea Ice Extent is 955,000 sq km above the 1981-2010 mean.
  • Antarctic Sea Ice Extent is 1,451,000 sq km above the 1981-2010 mean. That is the 37th daily record for 2014.
  • Arctic Sea Ice Extent is -497,000 sq km below the 1981-2010 mean. And just below the one standard deviation mark.

Data here. Graphs below. Click for bigger.

Global_Sea_Ice_Extent_Zoomed_2014_Day_104_1981-2010 Antarctic_Sea_Ice_Extent_Zoomed_2014_Day_104_1981-2010 Arctic_Sea_Ice_Extent_Zoomed_2014_Day_104_1981-2010