PDO AMO Arctic Antarctic

The graphs start from 1950 to show a full 66 year cycle of the PDO and AMO.

I’m graphing anomalies from the mean for all. Sea Ice is in millions of sq km.

PDO versus Arctic Extent  – note that the satellite record for sea ice starts at peak of PDO

AMO versus Antarctic Extent

Everything

JAXA versus MASIE versus NSIDC – Day 165 – 2016

Now that NSIDC is publishing data again I thought I would post two graphs comparing JAXA MASIE and NSIDC.

I’m doing it for Arctic and Antarctic (but MASIE has no Antarctic data)

Normally in the Arctic JAXA and NSIDC are very close only at the minimum … but now they are very close.

And in the Antarctic they might as well be doing just one they overlap so much.

Arctic Sea Ice - JAXA versus MASIE versus NSIDC 2015 2016

Antarctic Sea Ice - JAXA versus MASIE versus NSIDC 2015 2016


Greenland Melting: Broken Satellite ‘Confirms’

I was reading this article on Greenland melting. And then I read this:

Capture

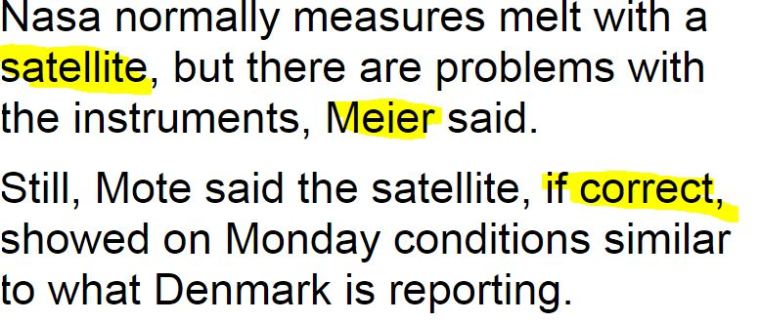
Meier is (I assume) Walt Meier of the NSIDC.

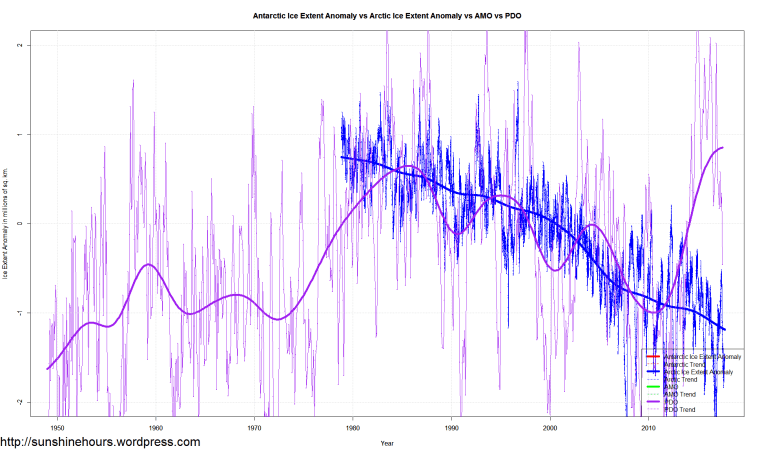
Ok … so the satellite that was producing spurious massive jumps in Arctic/Antarctic Sea Ice is being used to confirm the melting of Greenland despite being told the satellite is broken.

Yup. Sounds typical.

On Monday and Tuesday, about 12 per cent of the ice sheet surface area — 656,000 square miles or 1.7 million square kilometers — showed signs of melting ice, according to Peter Langen, a climate scientist at the Danish Meteorological Institute.

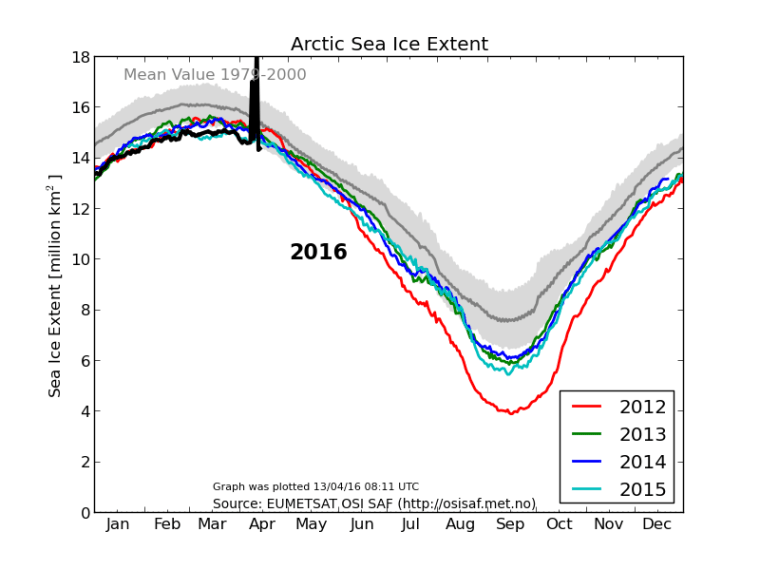
This is the DMI graph of the arctic sea ice extent using data from the same satellite … I think.

DMI_JUMPY_icecover_current_new

Wait. This just in.(I’m flabbergasted).

Greenland calbration

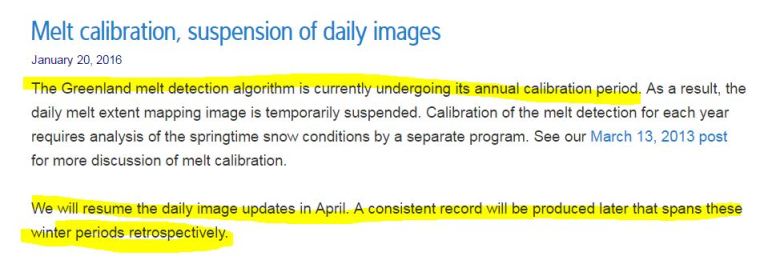
Greenland Surface Melt dataset produced by:

DMSP 5D-2/F11, DMSP 5D-2/F13, DMSP 5D-2/F8, DMSP 5D-3/F17, NIMBUS-7

F17 is the satellite producing spurious sea ice data.


Antarctic Sea Ice – 29% Above Normal – 17th Daily Record of 2014 – 13th In A Row – Day 34

The 17th daily record for Antarctic Sea Ice Extent in 2014 was set yesterday on Feb 3 (Day 34).

The old record was broken by 290,000 sq km. Sea Ice is 980,000 sq km above the 1981-2010 mean. Thats 28.65%.

And WOW …. I know this is probably just an aberration (but it isn’t a normal time so who knows) but extent only fell 3230 sq km from day 33 to 34. Normally at this time of year extent falls around 40,000-100,000 sq km per day.

Caveat: the raw data has 0.00058 sq km in the missing column (which is usually 0). Not sure what that means, but that is only 580 sq km.

I’ve added the 2008 Highest Minimum point to this graph. Data is here. Click for bigger.

Antarctic_Sea_Ice_Extent_Zoomed_2014_Day_34_1981-2010


Antarctic Sea Ice Minimum Trend Climbing at 140,000 sq km per decade!

Antarctic Sea Ice Minimum Trend is climbing at 140,000 sq km per decade!

After declaring Antarctic had the 2nd highest minimum of all time I thought I should graph the trend.

Wow. At this rate Antarctic Sea Ice minimum will just keep growing and growing until you can’t get near Antarctica by ship at all! (probably not but it is fun to claim).

Antarctic_Sea_Ice_Extent_Minimums_Trend

Antarctic Sea Ice 24% Above Average (and only 8300 sq km short of a record)

UPDATE: The next day set a record.

Antarctic Sea Ice on day 42 (Feb 11 2013) is  24% above average (770,000 sq km) and and only 8300 sq km short of a record.

There is a chance of an all-time record of the highest minimum ever in the coming days. The record is from 2008 – 3.69176 million sq km – on day 51.

Antarctic_Sea_Ice_Extent_Zoomed_2013_Day_42_1981-2010