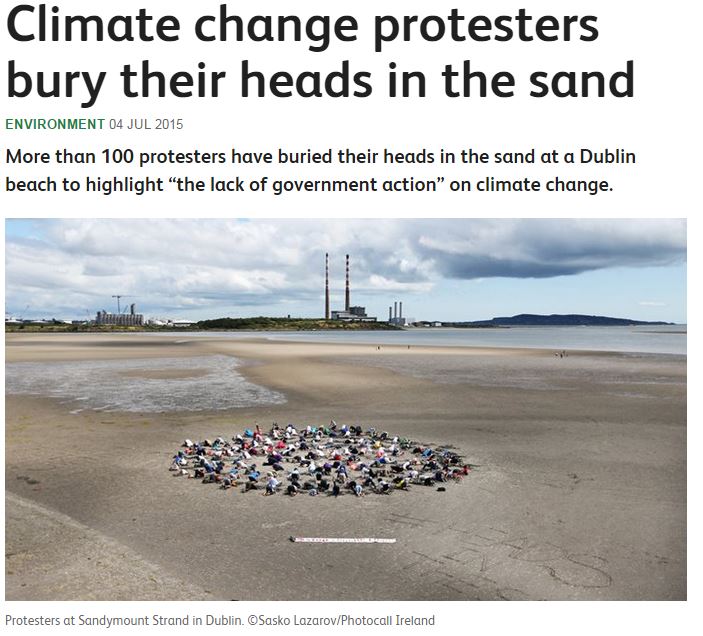
http://utv.ie/News/2015/07/04/Climate-change-protesters-bury-their-heads-in-the-sand-40400
Doom!!!! They predicted doom!!!!
San Jose Mercury News (CA) – June 30, 1989 – 3F General News
A senior environmental official at the United Nations, Noel Brown, says entire nations could be wiped off the face of the earth by rising sea levels if global warming is not reversed by the year 2000. Coastal flooding and crop failures would create an exodus of “eco-refugees,” threatening political chaos, said Brown, director of the New York office of the U.N. Environment Program. He said governments have a 10-year window of opportunity to solve the greenhouse effect before it goes beyond human…
“The province of Saskatchewan experienced extreme hardship during the Great Depression of the 1930s.
Grasshoppers, hail and drought destroyed millions of acres of wheat. The drought caused massive crop failures, and Saskatchewan became known as a dust bowl.
The term “Dirty Thirties” described the prairies, creating pessimistic perceptions and negative stereotypes about life in Saskatchewan.
In 1928, the net FARMING income was $363 million; by 1933, it dropped to $11 million; and by 1937, two-thirds of the farm population of Saskatchewan was destitute.
Relief costs for the Saskatchewan government escalated to $62 million, which was higher than its total revenues. At least 250,000 people left the prairie provinces between 1931 and 1941.”
http://esask.uregina.ca/entry/great_depression.html
Paul Homewood discusses BBC claims that Heatwaves are more likely due to climate change. And because 2014 was the “hottest” year.
So I decided to look at the HADCET MAXTEMP data.
Not the average. The maximum.
I then arbitrarily set the heatwave boundary at 25C.
And then calculated the number of days over 25 and the longest stretch (ie Heatwave).
Guess what? 2014 barely ranks. Only 8 days above 25. 1911 had 29! (See large table at bottom for 25C heatwaves)
What if I set the Heatwave definition at 30C? There are only 8 years that have days over 30C.
1976 is the winner. And 1976 was 39 years ago! (Corrected from 30)
The 30C days and temps.
“1976-07-01” “1976-07-02” “1976-07-03” “1976-07-04” “1976-07-05” “1976-07-06” “1976-07-07”
“30.6” “31.8” “33.2” “31.4” “31.4” “31.6” “30.4”
30C Heatwaves
| Year | Days | Longest Heatwave |
| 1976 | 9 | 7 |
| 1995 | 5 | 4 |
| 1975 | 4 | 2 |
| 1906 | 3 | 3 |
| 1948 | 3 | 3 |
| 2006 | 3 | 2 |
| 1923 | 2 | 2 |
| 1990 | 2 | 2 |
25C Heatwave.
| Year | Days | Longest Heatwave |
| 1976 | 33 | 16 |
| 1995 | 33 | 10 |
| 1911 | 29 | 4 |
| 2006 | 26 | 7 |
| 1947 | 25 | 10 |
| 2003 | 23 | 10 |
| 1949 | 22 | 6 |
| 1933 | 21 | 6 |
| 1893 | 19 | 6 |
| 1921 | 19 | 6 |
| 1955 | 19 | 5 |
| 1975 | 19 | 8 |
| 1983 | 18 | 7 |
| 1989 | 18 | 7 |
| 1899 | 17 | 4 |
| 1887 | 16 | 3 |
| 1959 | 16 | 3 |
| 1990 | 16 | 4 |
| 1997 | 16 | 7 |
| 2013 | 16 | 8 |
| 2005 | 15 | 5 |
| 1884 | 14 | 5 |
| 1900 | 14 | 3 |
| 1935 | 14 | 4 |
| 1999 | 14 | 5 |
| 2001 | 13 | 5 |
| 1941 | 12 | 3 |
| 1878 | 11 | 6 |
| 1897 | 11 | 4 |
| 1898 | 11 | 5 |
| 1934 | 11 | 8 |
| 1970 | 11 | 5 |
| 1984 | 10 | 5 |
| 1901 | 9 | 5 |
| 1925 | 9 | 3 |
| 1942 | 9 | 4 |
| 1982 | 9 | 2 |
| 1991 | 9 | 3 |
| 1994 | 9 | 3 |
| 1996 | 9 | 5 |
| 2004 | 9 | 2 |
| 1906 | 8 | 5 |
| 1929 | 8 | 3 |
| 1957 | 8 | 4 |
| 1960 | 8 | 3 |
| 1969 | 8 | 3 |
| 1986 | 8 | 4 |
| 2014 | 8 | 5 |
| 1896 | 7 | 2 |
| 1919 | 7 | 2 |
| 1923 | 7 | 3 |
| 1944 | 7 | 3 |
| 1952 | 7 | 2 |
| 1973 | 7 | 4 |
| 1886 | 6 | 3 |
| 1895 | 6 | 2 |
| 1908 | 6 | 3 |
| 1914 | 6 | 2 |
| 1926 | 6 | 4 |
| 1937 | 6 | 2 |
| 1940 | 6 | 4 |
| 1945 | 6 | 3 |
| 1946 | 6 | 5 |
| 1961 | 6 | 2 |
| 2010 | 6 | 2 |
| 2011 | 6 | 3 |
| 1881 | 5 | 2 |
| 1885 | 5 | 4 |
| 1918 | 5 | 3 |
| 1930 | 5 | 4 |
| 1948 | 5 | 5 |
| 1953 | 5 | 2 |
| 1977 | 5 | 5 |
| 1987 | 5 | 2 |
| 1992 | 5 | 2 |
| 1998 | 5 | 4 |
| 2000 | 5 | 3 |
| 2009 | 5 | 4 |
| 1891 | 4 | 4 |
| 1902 | 4 | 2 |
| 1904 | 4 | 2 |
| 1912 | 4 | 3 |
| 1922 | 4 | 2 |
| 1928 | 4 | 2 |
| 1932 | 4 | 2 |
| 1936 | 4 | 3 |
| 1939 | 4 | 4 |
| 1943 | 4 | 2 |
| 1950 | 4 | 4 |
| 1963 | 4 | 2 |
| 1968 | 4 | 2 |
| 2008 | 4 | 2 |
| 1894 | 3 | 2 |
| 1905 | 3 | 2 |
| 1917 | 3 | 2 |
| 1978 | 3 | 2 |
| 1980 | 3 | 2 |
| 1988 | 3 | 2 |
| 2002 | 3 | 2 |
| 1880 | 2 | 2 |
| 1924 | 2 | 2 |
| 1972 | 2 | 2 |
What was once launched as a – well-intentioned – green energy revolution has now mutated into a giant VEB [i.e. East German state company]. In Gabriel’s system electricity production is no longer determined by demand – as is usual in a market economy. It is not demand that determines supply – but the subsidy billions. Produced is only what wind and solar power and feed-in tariffs expensively allow, not what the public and the economy need – cheap energy. In Gabriel’s national energy system there is an ideological distinction between “good” (green) and “evil” (traditional) energy. Therefore, even profitable and clean gas power plants are switched off – as just happened to Europe’s most modern gas-fired power plant in Irsching. Instead, new subsidy-fed projects are connected to the grid without the necessary network capacity and without the necessary storage technology. For these intermittent power plants, coal power plants have to be kept running as backups, which in turn emit a lot more CO2, which now are also extra-taxed. It all feels like socialist self-perpetuating: this energy revolution cannot be stopped.
http://www.thegwpf.com/the-madness-of-germanys-energy-socialism/
Time magazine, June 24, 1974:
As they review the bizarre and unpredictable weather pattern of the past several years, a growing number of scientists are beginning to suspect that many seemingly contradictory meteorological fluctuations are actually part of a global climatic upheaval. However widely the weather varies from place to place and time to time, when meteorologists take an average of temperatures around the globe they find that the atmosphere has been growing gradually cooler for the past three decades. The trend shows no indication of reversing. Climatological Cassandras are becoming increasingly apprehensive, for the weather aberrations are studying may be the harbinger of another ice age.
Telltale signs are everywhere—from the unexpected persistence and thickness of pack ice in the waters around Iceland to the southward migration of a warmth-loving creature like the armadillo from the Midwest. Since the 1940s the mean global temperature has dropped about 2.7° F. Although that figure is at best an estimate, it is supported by other convincing data.
Even more from the Wayback Machine:
When Climatologist George J. Kukla of Columbia University’s Lamont-Doherty Geological Observatory and his wife Helena analyzed satellite weather data for the Northern Hemisphere, they found that the area of the ice and snow cover had suddenly increased by 12% in 1971 and the increase has persisted ever since. Areas of Baffin Island in the Canadian Arctic, for example, were once totally free of any snow in summer; now they are covered year round.
To the anti-nuclear pro-Coal activists … THANKS!
“New coal power projects planned for Japan could emit carbon dioxide equal to about a 10th of the country’s total emissions, an environmental group said in a statement Thursday. Japan has 43 coal power projects either under construction or planned, representing combined capacity of 21,200 megawatts “
http://www.thegwpf.com/japan-to-build-40-new-coal-power-plants/
“Japan now appears set to embrace a dominant role for dirty coal in the country’s energy mix for decades to come.”
http://www.thegwpf.com/economy-first-japan-plans-dominant-role-for-coal-by-2030/
Whoa!
The global average temperature of 62.45 degrees Fahrenheit for 1997 was the warmest year on record, surpassing the previous record set in 1995 by 0.15 degrees Fahrenheit
The average temperature for the year [2014] was 0.69°C (1.24°F) above the 20th century average of 13.9°C (57.0°F) [ie 58.24F] , beating the previous record warmth of 2010 and 2005 by 0.04°C (0.07°F).
http://tomnelson.blogspot.ca/2015/02/noaa-settled-science-earth-at-5824f-in.html
Too stupid to spend much time on it … but so stupid it should be noted.
“The scientists set up infrared heaters over the five meadow plots measuring 30 square metres (322 square feet).
Left to run day and night, the heaters burned through more than 128,462 kilowatt hours of electricity.”
“When future generations look back on the global-warming scare of the past 30 years, nothing will shock them more than the extent to which the official temperature records – on which the entire panic ultimately rested – were systematically “adjusted” to show the Earth as having warmed much more than the actual data justified.”
“Two weeks ago, under the headline “How we are being tricked by flawed data on global warming”, I wrote about Paul Homewood, who, on his Notalotofpeopleknowthat blog, had checked the published temperature graphs for three weather stations in Paraguay against the temperatures that had originally been recorded. In each instance, the actual trend of 60 years of data had been dramatically reversed, so that a cooling trend was changed to one that showed a marked warming.”
Read it all here:
