Correction: Northern Hemisphere CERES 18 Year Temperatures Trend does not = 0

Update: Willis made a mistake. Read about it here.

Original post below:


Willis Eschenbach is looking at the CERES satellite data trends from 2000.

While the Globe is averaging a tiny .07C per decade, the Northern Hemisphere trend is 0.

And Land is trending down -0.09C per decade.

As he says

“I’ve never seen a climate model from the turn of the century that predicted that for the first 18 years of the 21st Century the land would be cooling … and despite that, we’re supposed to believe that those same climate models can tell us what the temperatures will be doing in the year 2100 … yeah, that’s totally legit …”

Correction: Northern Hemisphere CERES 18 Year Temperatures Trend = 0

Update: Willis made a mistake. Read about it here.

Original post below:


Willis Eschenbach is looking at the CERES satellite data trends from 2000.

While the Globe is averaging a tiny .07C per decade, the Northern Hemisphere trend is 0.

And Land is trending down -0.09C per decade.

As he says

“I’ve never seen a climate model from the turn of the century that predicted that for the first 18 years of the 21st Century the land would be cooling … and despite that, we’re supposed to believe that those same climate models can tell us what the temperatures will be doing in the year 2100 … yeah, that’s totally legit …”

Alberta Average July Tmax By Decade

I posted some data about temperatures in Edmonton and Alberta. I wanted to visualize it. So I’ve made a grid.

The source of the data is Environment Canadas monthly summaries.

I’m using Tmax, not Tmean. (The logic being that max temps are the problem)

And I’m starting with the July only average for the decade. (I’ll expand in later posts).

There are 1087 stations with July data in Alberta.

I’m narrowing it down to stations with 25 years of data and data all the way up to 2017 and 80% complate.

Things to note:

Only 29 stations make the cut. Only 1 station has the 2010s as the decade with the hottest July average Tmax.

Only 2 stations have data from the 1940s (none before that).

So … AGW ain’t going to kill Albertans in July. They already survived July in the 2000s.

And there isn’t any stations with old and new data. (By that I mean the 30s).


Station
Station No
Records Min Year Max Year pct of data 2010s 2000s 1990s 1980s 1970s 1960s 1950s 1940s 1930s 1920s 1910s 1900s 1890s 1880s
KANANASKIS 3053600 77 1940 2017 98.7 30.4 31.1 28.3 30.1 29.3 28.8 29.3 29.9
CAMROSE 3011240 70 1946 2017 97.2 29.9 31.6 28.7 30 29.1 31.1 31.2 30.9
COLD LAKE A 3081680 65 1953 2017 100 30.2 31.2 29.8 30 29.3 31.4 30.9
FORT SASKATCHEWAN 3012710 58 1958 2017 96.7 31.4 32 29 30.3 29.9 31.6 33.9
CRAIGMYLE 3021940 52 1960 2017 89.7 31.8 33.5 30.3 32.8 32.6 32.7
EDMONTON STONY PLAIN 301222F 52 1966 2017 100 29.8 30.8 27.8 29.2 28.4 28.6
QUEENSTOWN 3035340 51 1967 2017 100 31.9 33.3 31.4 33.8 34.2 32.2
FORESTBURG PLANT SITE 3012652 50 1968 2017 100 31.7 34 30.9 32.6 31.8 31.7
HIGH LEVEL A 3073146 47 1971 2017 100 30.9 29.9 29.7 29.8 29.2
SIMONETTE 3075937 44 1974 2017 100 28.9 30 29.1 29.3 28.6
VEGREVILLE 3016GF0 37 1981 2017 100 30.7 31.3 29.7 30.3
FABYAN 3012515 36 1981 2017 97.3 29.9 32.2 29.7 31.9
LLOYDMINSTER A 3013961 36 1982 2017 100 29.4 31.6 29.6 31.7
ELK ISLAND NAT PARK 3012275 33 1982 2017 91.7 30.8 31.3 29.9 29.4
BRULE BLACK CAT 3060903 31 1987 2017 100 30.7 31 28.8 29.8
PICTURE BUTTE WEST 303N1G3 31 1987 2017 100 33.6 34.6 31.3 33.2
ENTWISTLE 3062451 30 1988 2017 100 29.9 31.3 29.1 29.8
UNIVERSITY OF ALBERTA METABOLIC CENTRE 301FFNJ 30 1987 2017 96.8 31.8 32.2 29.5 30.8
OKOTOKS 303M9JM 28 1990 2017 100 32.8 33.3 29.9
BROOKS 3030QLP 26 1989 2017 89.7 33.3 35 33.2 34
BOW ISLAND 3030768 25 1993 2017 100 33.7 34.3 31.6
BOW VALLEY 3050778 25 1993 2017 100 32.1 32.2 29.1
COP UPPER 3031875 25 1993 2017 100 31.1 31.3 28.5
CROWSNEST 3051R4R 25 1993 2017 100 31 32 29.1
ESTHER 1 301B460 25 1993 2017 100 32.9 34.8 32.3
LACOMBE CDA 2 3023722 25 1993 2017 100 30.1 31.3 28.4
SUNDRE A 3026KNQ 25 1993 2017 100 30.6 31.1 28.5
THREE HILLS 3026479 25 1993 2017 100 30.7 32.5 29.9
VAUXHALL CDA CS 3036682 25 1993 2017 100 33.6 34.8 32.8

Average Temperatures and Adaptation

I was looking at the weather forecast for today and I noticed the historical high and low section (1947 to 2015).

For November 26 the average temperature is 7.7C.

If global warming occurs, how will we adapt to 8.7C or 9.7C on this day in the future?

Isn’t that a stupid question? Or just plain silly. There isn’t really an “average temperature” to adapt to. We’ve already “adapted” to a 26C swing in temperatures.

That’s right. The historical low is -10.5C in 1985 and the historical high is 16.1C in 1949.

I’d love a 16C day today! Isn’t going to happen today. It could. And it did. Back in 1949.


Fuel Efficient GDI Engines Are Dirtier

Oh no … what a surprise …

Researchers at the University of Toronto’s Faculty of Applied Science & Engineering looked at the emissions from gasoline direct injection (GDI) engines, which are smaller and more efficient than traditional petrol engines.

Car manufacturers have adopted GDI engines in models to satisfy demand for more miles per gallon, and increased power output. According to the team, the number of GDI engines found in new cars between 2009 and 2015 has jumped to from five per cent to 46 per cent.

But their analysis revealed while carbon dioxide emissions were lower in GDI engines, they pumped out more soot and harmful organic compounds such as benzene and toluene.

‘The whole motivation for creating these engines in the first place was fuel efficiency. But what we haven’t considered are the other climate-related emissions,’ explained Professor Greg Evans, an engineer and applied chemist at Toronto.

If a vehicle emits a small amount of soot, it can completely negate the lower amount of CO2 that it’s emitting.

Read more: http://www.dailymail.co.uk/sciencetech/article-3688189/Not-green-Fuel-efficient-cars-churning-pollutants-previously-thought.html


Antarctic Ice Cores Are Useless To Detect Global Warming

A new paper is out trying to explain why Antarctica isn’t warming.

“These findings suggest the Southern Ocean responds to greenhouse gas forcing on the centennial, or longer, timescale over which the deep ocean waters that are upwelled to the surface are warmed themselves. It is against this background of gradual warming that multidecadal Southern Ocean temperature trends must be understood.

There is a little name calling aimed at deniers (who happen to be right)

Those who said there was a conundrum were just deniers. It’s right there in the press release, paragraph two:

The study resolves a scientific conundrum, and an inconsistent pattern of warming often seized on by climate deniers.

Which rather begs the question: If there was a conundrum then the skeptics who pointed it out were not deniers, but correct. And if there was no conundrum, and deniers were denying something, then this is not a new finding at all. Alternately perhaps some researchers “knew” the answer they were going to find, and the other researchers, who can’t see the future, are deniers?


But the thought that came to me was … if there have been episodes of global warming in the past that last a few hundred years …. the ice cores would have missed them completely. Right?


Does commercial jet traffic affect climate?

The other day I was crossing the harbor near where I live in a small ferry. I noticed numerous fresh jet contrails article14972
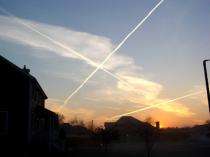
crisscrossing the sky. And then I noticed that many of the cirrus-like clouds were just older contrails that had dissipated. And I realized that it would have been a clear blue sky if it wasn’t for the jet traffic.

And today I looked up the term contrails and climate change on google.

From 2011:

In a recent study published in Nature Climate Change, Dr. Ulrike Burkhardt and Dr. Bernd Karcher from the Institute for Atmospheric Physics at the German Aerospace Centre show that the contrails created by airplanes are contributing more to global warming that all the CO2 that has been caused by the entire 108 years of airplane flight. Airplane contrails are the white clouds that we see in the sky spreading behind jets.

These cirrus clouds are created when the hot, moist air released from the plane freezes in the colder and drier air. These clouds then trap the long-wave radiation from Earth and create a warming of the atmosphere. In their study, Burkhardt and Karchar utilized satellite imagery of these spreading contrails to create a computer model which estimates how the contrails affect the Earth’s temperature. They have discovered that aviation contrails play a huge role in the impact on the climate and an even greater impact than that created by the CO2 emissions produced.

While the CO2 emissions from airplanes account for around three percent of the annual CO 2emissions from all fossil fuels and change the radiation by 28 milliwatts per square meter, the aviation contrails are responsible for a change of around 31 milliwatts per square meter.

From 2005:

Is this atmospheric graffiti a problem? Research by Penn State geography professor Andrew Carleton suggested it could be. Contrails “can extend the natural cirrus cover,” Carleton explained, and unlike most clouds, cirrus tend to warm the surface overall because they trap heat more than they reflect the sun’s radiation. “This is a concern to climate scientists because it could mean that a lot more contrails would make global warming worse.”

Although scientists had suspected that contrails affect regional temperatures, there was no way to truly test the idea until the terrorist attacks on Sept. 11, 2001. In the enforced no-fly period following the collapse of the World Trade Center, air traffic was completely stopped for three days and scientists were able to directly compare temperatures logged in the presence of contrails against temperature data collected with contrail-free skies.

“I remember walking to and from my office (during that time) and thinking how incredibly clear the skies were,” recalled Carleton. He mentioned this to a colleague and former doctoral-degree student of his, David Travis of the University of Wisconsin, who had noticed the same thing. “Then we started thinking that we should look at the temperature conditions” during those days in September and compare them to years past, Carleton said.

Looking at daytime highs and nighttime lows, Carleton and Travis found the average daily temperature range across the no-fly period to be almost 2 degrees Fahrenheit larger than when jets do fly. This implies, Carleton explained, that contrails lower daytime maximum temperatures and increase nighttime low temperatures — probably in the same way that cirrus clouds do, by blocking some solar radiation from reaching earth’s surface during the day and insulating against heat loss at night.