NOAA USA – Why is February Such A Key Month?

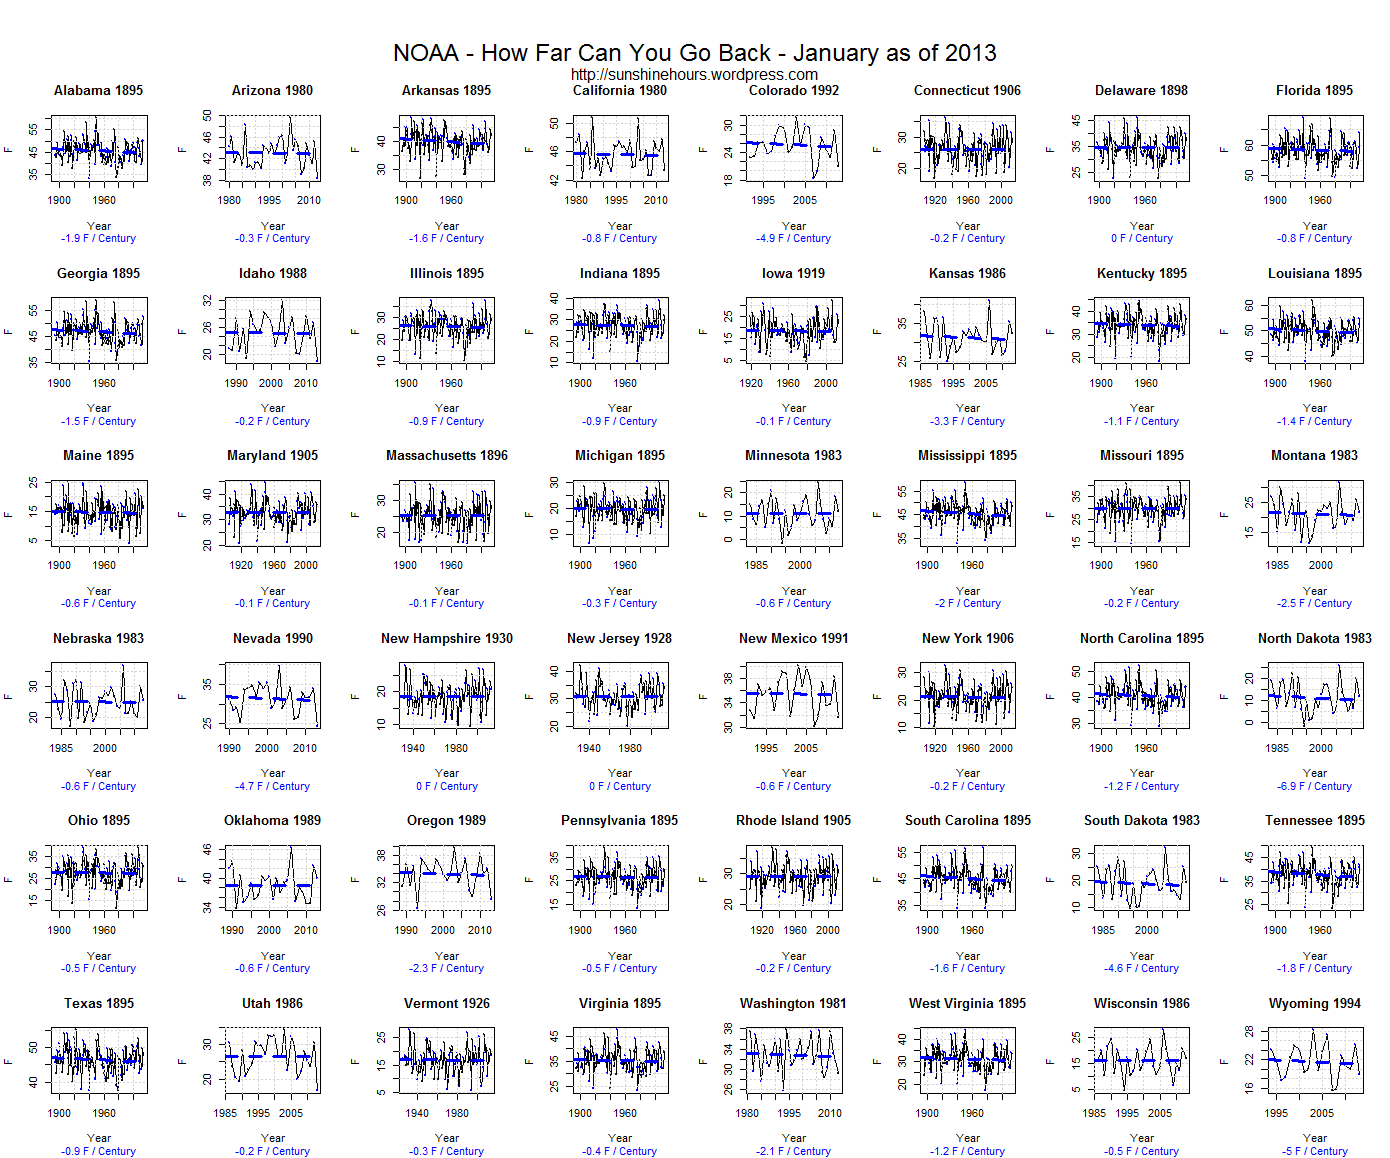
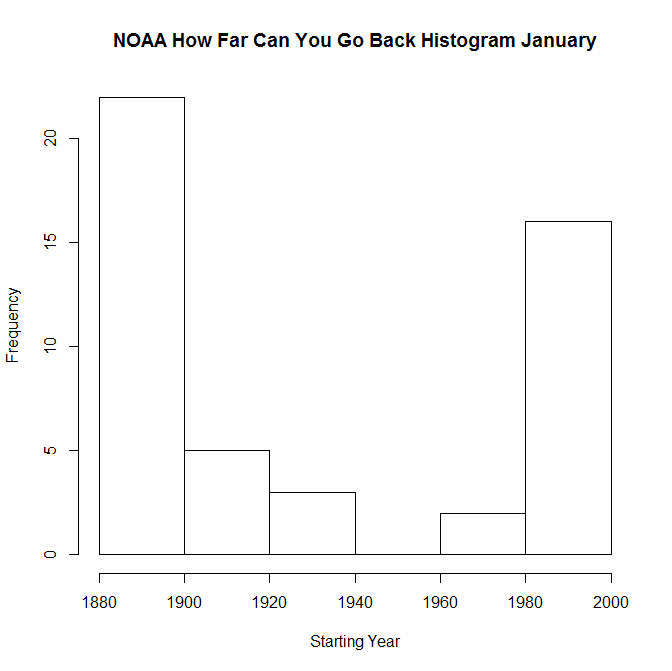
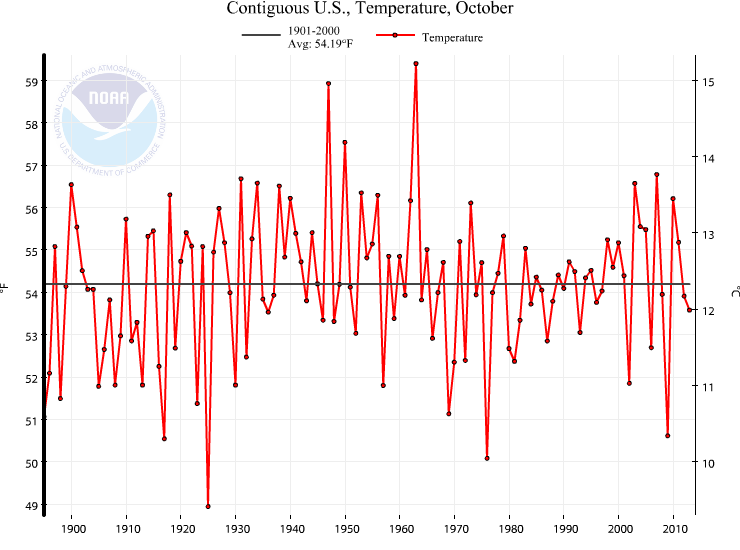
From 1895 to 1998 the Contiguous USA warmed at a very small rate of .78F per century. The NOAA graph is here.

The interesting thing is that 34% of the warming occurred in the month of February.  January even had a slight cooling trend.

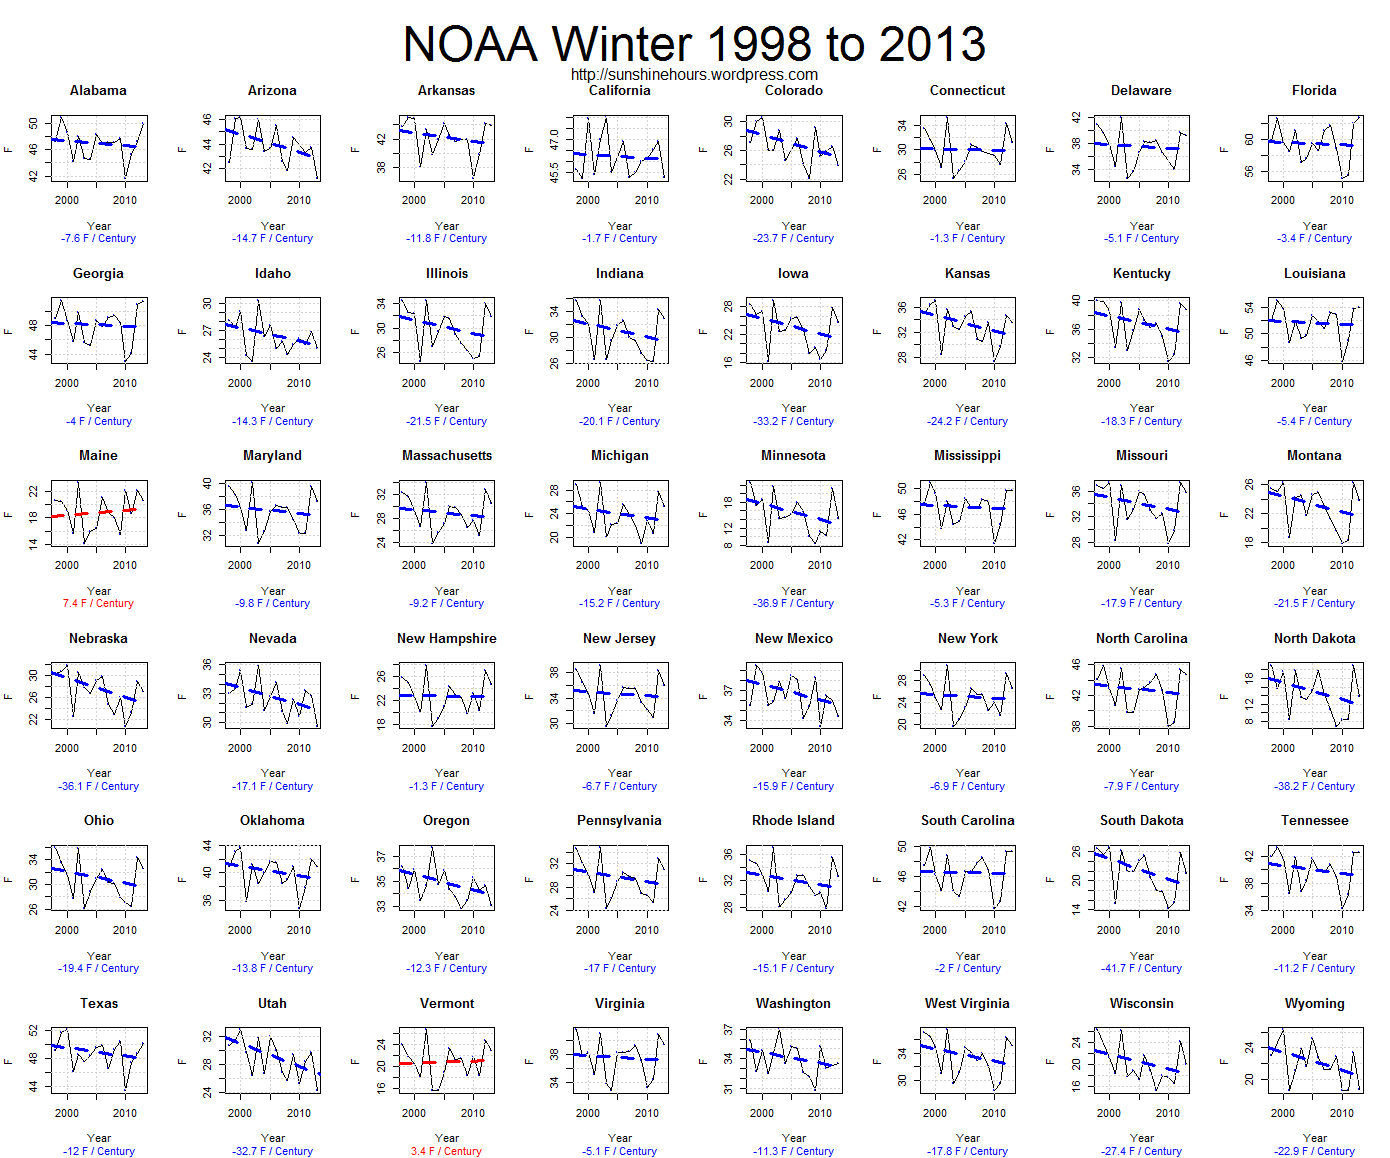
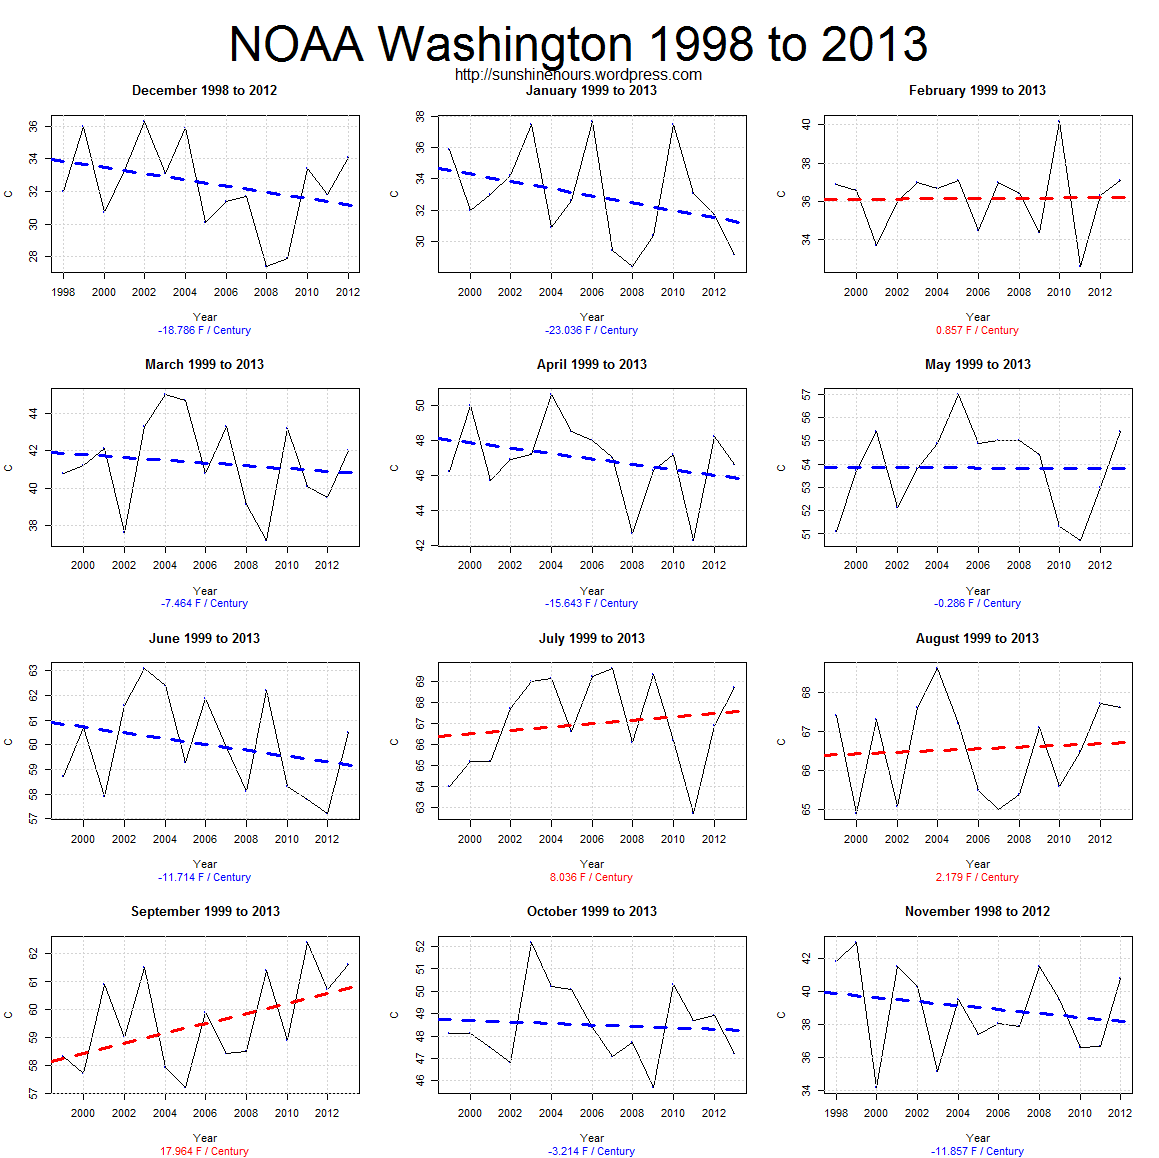
From 1998 to 2013,  the USA cooled at a rate of -3.33F per century. February was responsible for 66% of the cooling.

Any ideas? Is it an NOAA artifact or something else? It seems strange that CO2 would prefer February for 100 years and then forsake it. 🙂

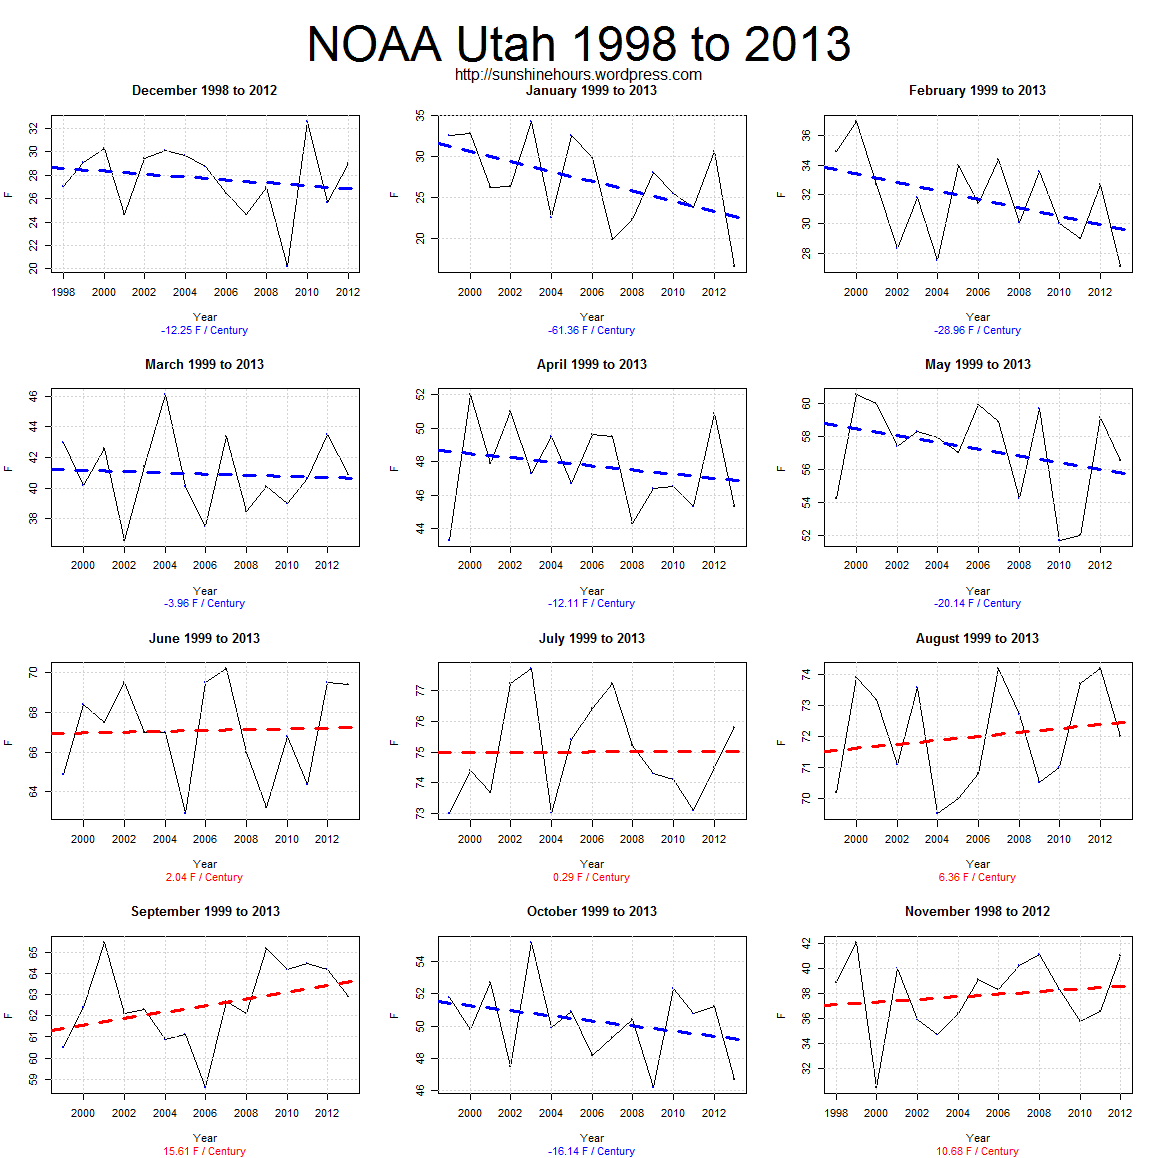
Graphs for each month/period below. (The percentages do not add up properly because some months were going in opposite direction of overall trend, but they give an idea of the magnitude)

Click for bigger.

NOAA USA Contiguous 48 States 1895 to 1998 - Trend 0.78F per Century

NOAA USA Contiguous 48 States 1998 to 2013 - Trend -3.33F per Century

70 Novembers Were Warmer Than November 2013 in the USA Lower 48

According to the NOAA November 2013 was 49th warmest out of 119.  The following 70 Novembers were warmer:

1899,1900,1901,1902,1904,1905,1908,1909,1912,1913,1914,1915,1917,1921,1922,1923,1924,1927,1928

and 1931,1933,1934,1939,1941,1942,1944,1945,1946,1948,1949,1953,1954,1958,1960,1962,1963,1964,1965,1966,1967,1969

and 1971,1973,1974,1975,1977,1980,1981,1983,1984,1987,1988,1989,1990,1994,1995,1998,1999,2001,2002,2003,2004,2005,2006,2007,2008,2009,2010,2011,2012

Only 4 states were “Above Normal”. Tennessee, for example, was over 3F below the 1901-2000 average and was 15th warmest out of 119.

NOAA_NOV_2013_Map

NOAA Winter Temperatures By State From 1998 to 2013

I’ve had a request to show Winter (Dec/Jan/Feb) temperatures by state. I am showing from 1998.  That would be to Dec 2012 / Jan+Feb 2013.

Only two states have a warming trend. Maine and Vermont. South Dakota is cooling at -41F/Century. The full list is below the graph.

Click for bigger.

NOAA Winter 1998 to 2013

State Trend in F/Decade
South Dakota -41.7
North Dakota -38.2
Minnesota -36.9
Nebraska -36.1
Iowa -33.2
Utah -32.7
Wisconsin -27.4
Kansas -24.2
Colorado -23.7
Wyoming -22.9
Illinois -21.5
Montana -21.5
Indiana -20.1
Ohio -19.4
Kentucky -18.3
Missouri -17.9
West Virginia -17.8
Nevada -17.1
Pennsylvania -17
New Mexico -15.9
Michigan -15.2
Rhode Island -15.1
Arizona -14.7
Idaho -14.3
Oklahoma -13.8
Oregon -12.3
Texas -12
Arkansas -11.8
Washington -11.3
Tennessee -11.2
Maryland -9.8
Massachusetts -9.2
North Carolina -7.9
Alabama -7.6
New York -6.9
New Jersey -6.7
Louisiana -5.4
Mississippi -5.3
Delaware -5.1
Virginia -5.1
Georgia -4
Florida -3.4
South Carolina -2
California -1.7
Connecticut -1.3
New Hampshire -1.3
Vermont 3.4
Maine 7.4

NOAA/USA – How Far Can You Go Back And Get a Negative Trend For January

Over the last few days I have presented data for Arizona, Washington and Utah showing massive cooling trends in January for the last 15 years.  I did something similar for HADCET last month.

So I thought I would do the same “How Far Can You Go Back” for the lower 48 states for January.  I was somewhat surprised. 20 states have a negative trend from 1895 (the beginning of the NOAA data).

Alabama in January (for example) is cooling at -1.9F/Century since 1895. You can check NOAA’s data here if you like. I did, just to make sure.

The top 6 cooling trends:

From 1983 North Dakota -6.919 F/Century
From 1994 Wyoming -4.992
From 1992 Colorado -4.862
From 1990 Nevada -4.704
From 1983 South Dakota -4.613
From 1986 Kansas -3.344

Click to make the graph bigger:

NOAA - How Far Can You Go Back - January as of 2013

And the distribution:

HIST NOAA - How Far Can You Go Back - January as of 2013

Washington State January Cooling At 23F / Century

Correction: The original graph on the Y axis said C for Celsius. The correct unit is F for Fahrenheit. All mentions of F are correct. Graph has been corrected.

Did you know January in Washington State is cooling at 23F/Century according to the NOAA? O that December is cooling at -18F/Century?

September though is warming like crazy. 8 out of the 12 months are cooling. I’d call February flat -0 .8F / century is pretty negligible.

Here is the last 15 years broken down by month.

FC Corrected NOAA Washington 1998 to 2013


October in the USA Since 1998

According to the NOAA, October 2013 was the 37th coldest since 1895. 1963 was the warmest.

Is it unusual for there to be a cold October since … say … 1998? Nope.

They are spread all the way from 4th warmest in 2007 to the 4th coldest in 2009.

year Oct Oct Rank (1 = Coldest / 119 = Warmest)
2007 56.78 116
2003 56.57 113
2010 56.21 106
2004 55.55 101
2005 55.48 99
1998 55.24 91
2011 55.18 89
2000 55.17 87
1999 54.59 70
2001 54.39 64
2008 53.95 49
2012 53.91 45
2013 53.58 37
2006 52.69 24
2002 51.85 14
2009 50.61 4

October 2013 USA State Ranking Map – Boy Was It Cold!

October 2013 in the USA was the 37th coldest since 1895 according to the NOAA.

The following map has the ranking by state. If there was a 119 (there was not) it would have been the warmest. 1 would have been the coldest.

As you can see, the whole western USA was well below normal. The center and the south were pretty average. And when the NOAA says average, they mean 50 or 60 Octobers were warmer.

For example, Oregon had the 11th coldest October. Which means 108 Octobers were warmer.

NOAA_October_2013_State_Map

October 2013 in the USA Was The 37th Coldest! These Octobers were warmer: 1897,1899,1900,1901,1902,1903,1904,1907,1910,1914,1915,1918 …

According to the NOAA, October 2013 was the 37th coldest since 1895. It was -0.61°F colder than the 1901-2000 average.

The warmest October was 1963 when it was 5.21F warmer than the 1901-2000 average. That means October 2013 was 5.83F colder than 1963!

These Octobers were warmer: 1897,1899,1900,1901,1902,1903,1904,1907,1910,1914,1915,1918

and 1920,1921,1922,1924,1926,1927,1928,1929,1931,1933,1934,1935,1937,1938,1939

and 1940,1941,1942,1943,1944,1945,1947,1949,1950,1951,1953,1954,1955,1956,1958,1960,1961,1962,1963,1964,1965,1967,1968

and 1971,1973,1974,1975,1977,1978,1979,1983,1984,1985,1986,1988,1989,1990,1991,1992,1994,1995,1996,1997,1998,1999

and 2000,2001,2003,2004,2005,2007,2008,2010,2011,2012.

NOAA_October_2013