USA – June 1933 was hottest Published on July 19, 2018July 19, 2018 by sunshinehours16 Comments 
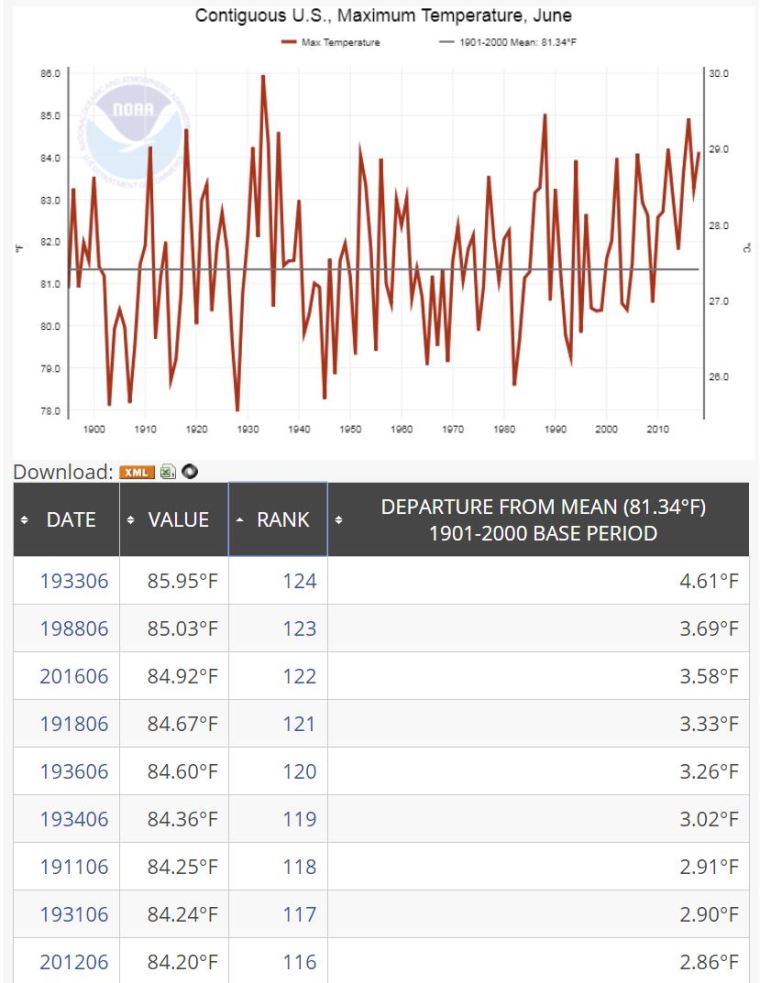
And by hottest i mean Maximum Temperature. Globalists use Average Temps because minimums are skyrocketing because of UHI. Minimums for USA at bottom of this post.
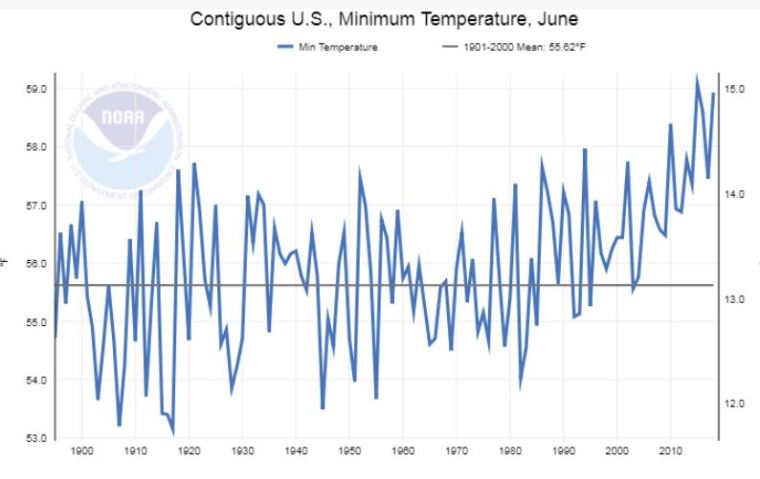
 Minimums
Sea Ice Extent (Global Antarctic and Arctic) – Day 199 – 2018 Published on July 19, 2018July 19, 2018 by sunshinehours11 Comment Arctic is 830,000 sq km higher than it was in 2011 on day 199. South / North
Sea Ice Extent (Global Antarctic and Arctic) – Day 198 – 2018 Published on July 18, 2018July 18, 2018 by sunshinehours12 Comments Arctic higher than 2011 2012 2017 2007 2013 2016 2014 and 2010 for day 198. South / North
Sea Ice Extent (Global Antarctic and Arctic) – Day 196 – 2018 Published on July 16, 2018July 16, 2018 by sunshinehours11 Comment If you graph the trend from 2010 …. it doesn’t exactly look like the end of the world. South / North
Sea Ice Extent (Global Antarctic and Arctic) – Day 195 – 2018 Published on July 15, 2018July 15, 2018 by sunshinehours11 Comment South / North
Sea Ice Extent (Global Antarctic and Arctic) – Day 194 – 2018 Published on July 14, 2018July 14, 2018 by sunshinehours1Leave a comment South / North
Sea Ice Extent (Global Antarctic and Arctic) – Day 193 – 2018 Published on July 13, 2018July 13, 2018 by sunshinehours11 Comment South / North
Sea Ice Extent (Global Antarctic and Arctic) – Day 192 – 2018 Published on July 12, 2018July 12, 2018 by sunshinehours11 Comment South / North
Arctic Temps Below Normal For 50 Days – Media Doesn’t Notice Published on July 10, 2018July 10, 2018 by sunshinehours114 Comments
Sea Ice Extent (Global Antarctic and Arctic) – Day 190 – 2018 Published on July 10, 2018July 10, 2018 by sunshinehours15 Comments Global Sea Ice is 1.3 million sq km higher than the lowest for this day Arctic is 840,000 sq km higher South / North