The NOAA said it was 44th coldest March in the USA .
(1 would be the coldest – 125 would be the warmest)

The NOAA said it was 44th coldest March in the USA .
(1 would be the coldest – 125 would be the warmest)
Checking in with DMI for the Daily mean temperature and climate north of the 80th northern parallel
After a 7C bump, it’s still cold and has returned to just slightly above the mean.

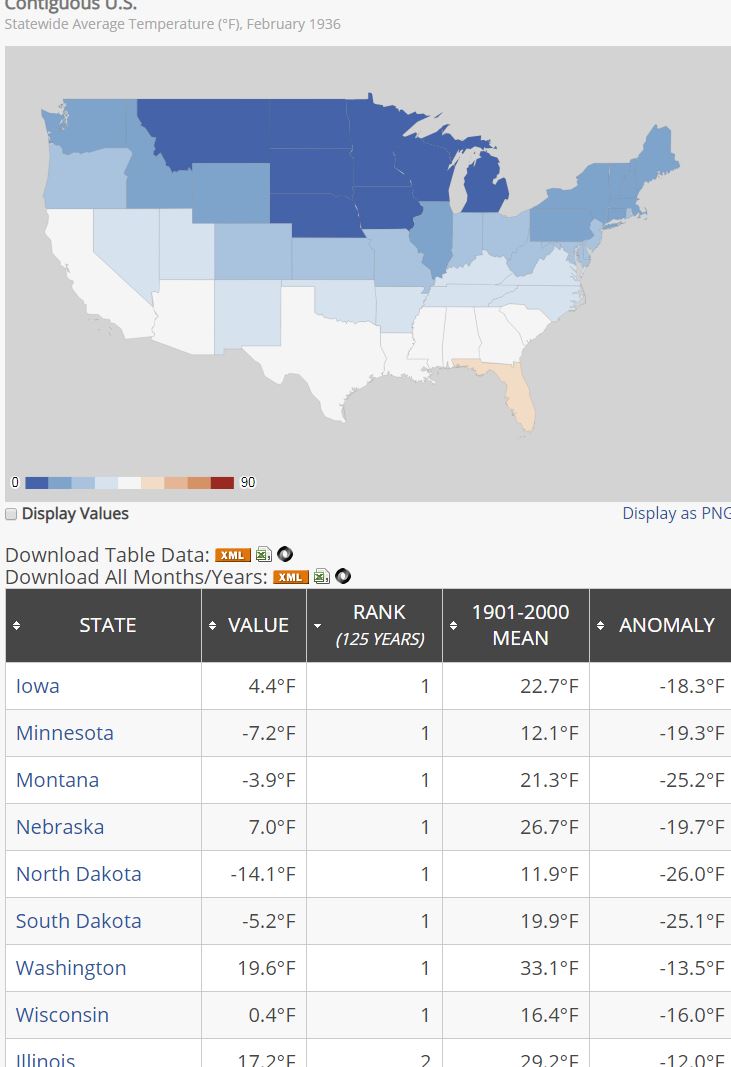
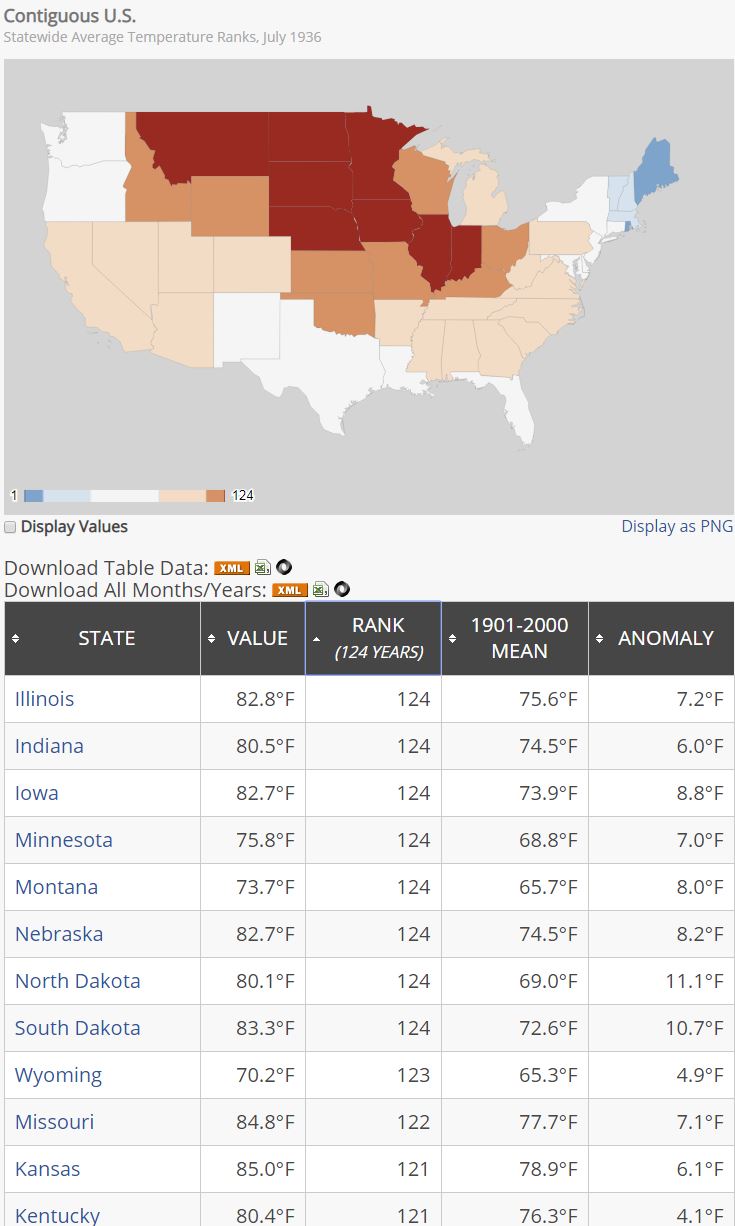
February 2019 Looks a lot Like February 1936 and thats bad because July of 1936 was so damn hot.

February 1936
July 1936 – 8 States Hottest and a bunch more in top 10.
According to the NOAA, Montana was -15.6F below the 1901-2000 mean
Norht Dakota was -14.8 below. South Dakota was -13.5F below.
Coldest February ever in Montana , South Dakota and North Dakota and 5 other states was 1936.
Feb 1936 looks very much like Feb 2019. I hope the summer of 2019 is not the same as the summer of 1936. That would be bad!!!!
So far in February 884 minimum daily temperature records have been broken (Seems low to me)

But the difference! 2 x -18 , 4 x -17 , 3 x -16 … and so on
Here is a sample

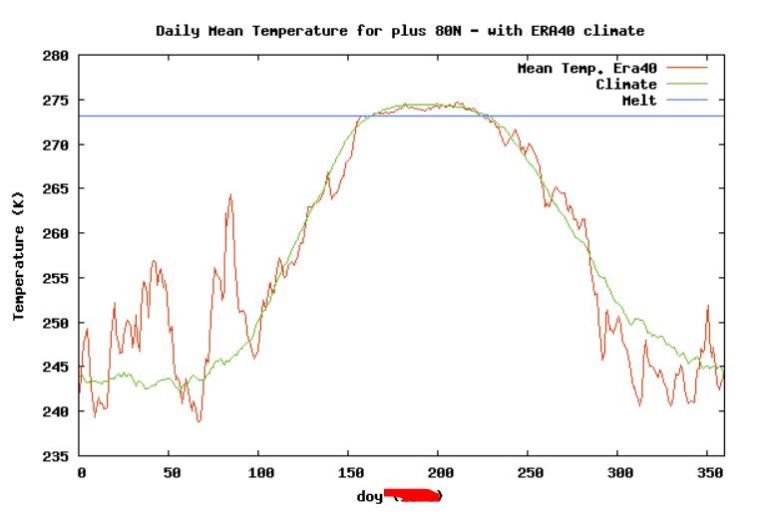
Checking in with DMI for the Daily mean temperature and climate north of the 80th northern parallel
Its still cold and only slightly above the mean.
Compare it to last year. It was almost 20C warmer in 2018 on day 53.

Nov 2018 USA was -2.011C below normal

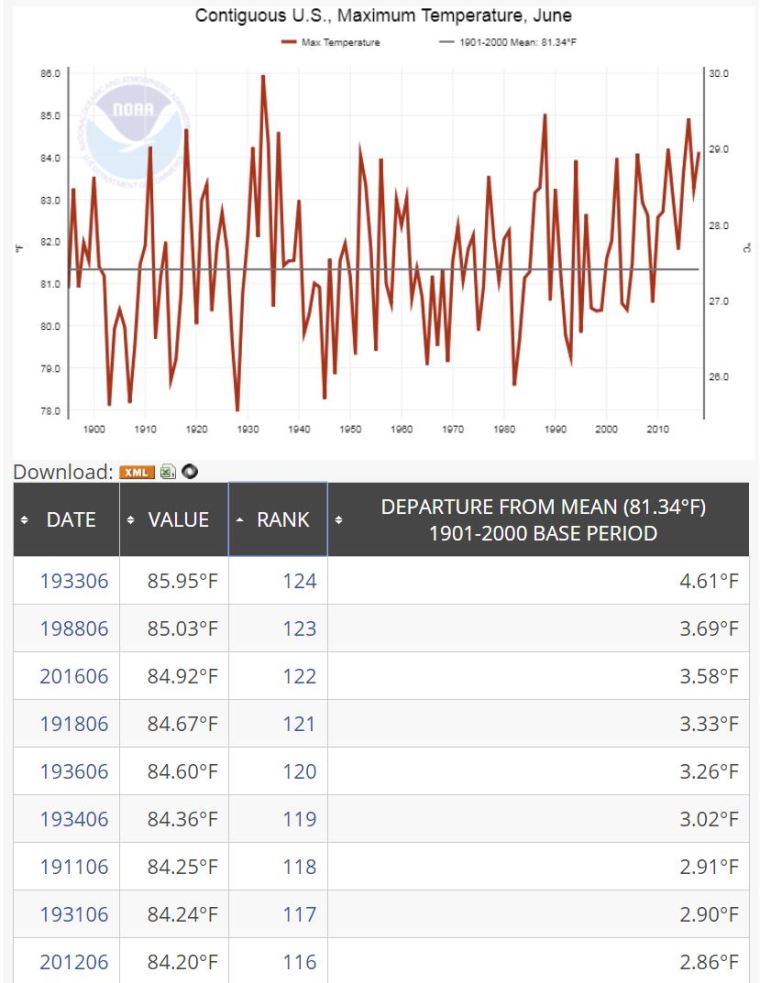
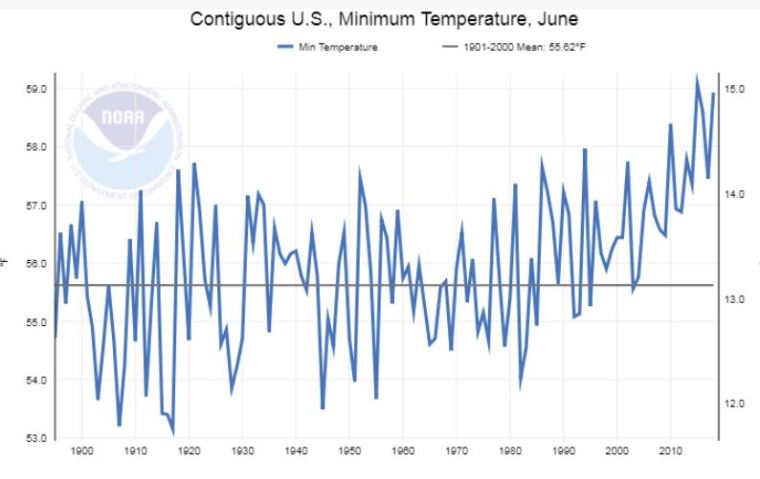
And by hottest i mean Maximum Temperature. Globalists use Average Temps because minimums are skyrocketing because of UHI.
Minimums for USA at bottom of this post.
Minimums
My previous post noted the 20C drop in temps and someone claimed only the 20C rise was news.
Guess which year? Hint … it was more than 40 years ago. And there are a bunch. And I didn’t even look past this one.
Look for yourself. Answer (white on white) is: 1976.
National Post has published some maps claiming Canada is going to suffer from “scorching summers”.
I’ve hit my online paper article limit so I’ll post the tweet.
The animated gif starts with a scary January, lots of red. And article/tweet predicts “warm winters, scorching summers”.
Note that they are using “mean temperatures”, not maximums.
But if you capture the monthly images , when do you notice about the summer months?
June/July/Aug are not scary and all red. They are pretty high up on the scale (which means the lowest change)
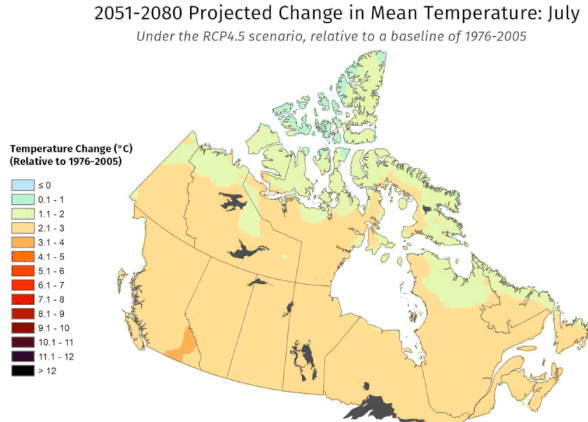
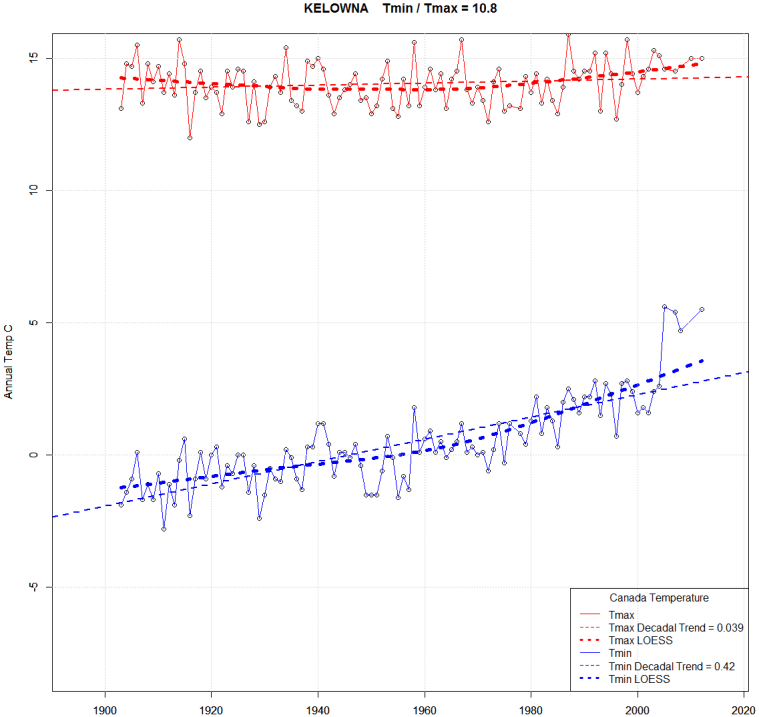
And I repeat. This is mean temperatures. Not max. And having looked at the data I know many of the BC cities have a very low rate of maximum change versus minimum.
It is the minimums that are climbing in a lot of cities and the max isn’t.
Here is my original hometown of Kelowna. Tmax has barely changed since 1900 (and in fact dropped from 1900 to 1950 and then climbed a bit since then.
The ratio of Tmin change to Tmax change is 10.8 to 1. Look at the Tmin climb. Huge. 7C warmer.