

Climate science says:
CO2 was about 280ppm in 1750.
CO2 is about 404ppm now.
CO2 levels have been rising by about 2ppm since 1997.

Therefore a doubling of CO2 from 1750 will occur around 78 years from now – say 2100.
The Transient Climate Response to a doubling of CO2 is around 1.35C.
Therefore temperatures from 1750 to 2100 will have risen by 1.35C
And for temperature to rise another 1.35C CO2 will have to go from 560ppm to 1120ppm – 280 more years 2380.
I don’t know about you, but 2.7C by 2380 sounds pretty nice.
And remember, for temperatures to go up 1.35C from today, it will take 200 years.
Whats everybody worrying about?
(h/t Hockey Schtick)
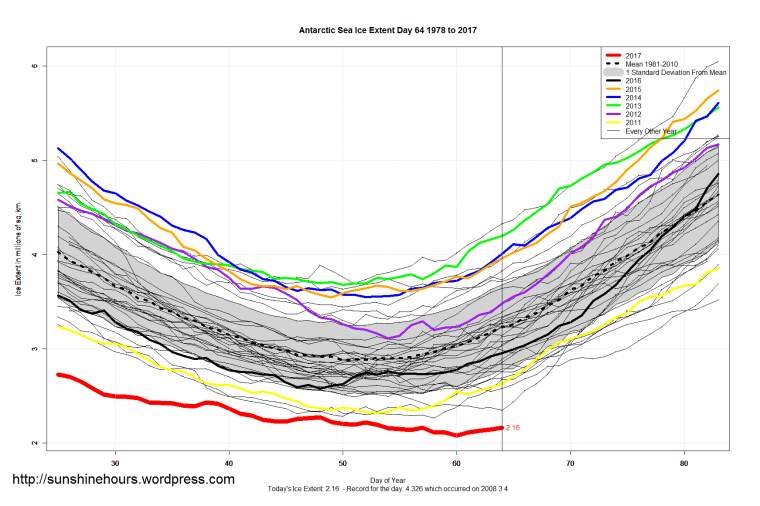
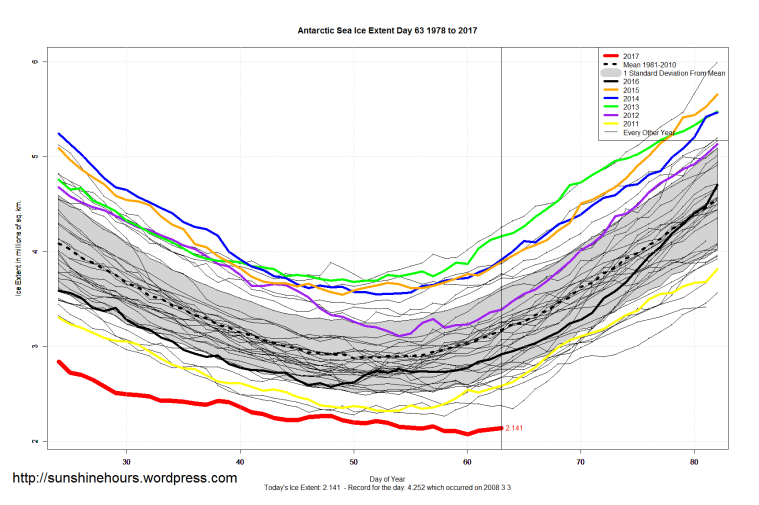
Antarctica set a new record for lowest minimum back on day 60.
| Year | Min | Max | day of Max | day of Min | Avg Anomaly |
| 2017 | 2.075 | N/A | N/A | 60 | N/A |
| 1997 | 2.264 | 18.792 | 265 | 58 | -0.262895726184 |
| 1993 | 2.281 | 18.71 | 263 | 50 | -0.233008054951 |
| 2011 | 2.319 | 18.954 | 266 | 53 | -0.152375178238 |
| 1984 | 2.382 | 18.37 | 266 | 58 | -0.20397636284 |
| 2006 | 2.487 | 19.36 | 264 | 51 | -0.192035452211 |
| 1992 | 2.492 | 18.467 | 255 | 54 | -0.241630203122 |
| 1980 | 2.521 | 19.092 | 267 | 57 | -0.390551802967 |
| 1991 | 2.554 | 18.671 | 273 | 58 | -0.108073808375 |
| 2016 | 2.578 | 18.518 | 241 | 48 | -0.484736760499 |
| 2000 | 2.582 | 19.159 | 272 | 49 | 0.106979086495 |
| 1996 | 2.597 | 18.831 | 267 | 56 | 0.12888072584 |
| 1985 | 2.602 | 18.931 | 254 | 50 | -0.045367912714 |
| 1988 | 2.639 | 18.785 | 277 | 55 | -0.142789879716 |
| 2009 | 2.671 | 19.299 | 267 | 53 | 0.395643999844 |
| 1981 | 2.694 | 18.856 | 261 | 51 | -0.210032677284 |
| 2002 | 2.697 | 18.116 | 252 | 51 | -0.4313395618 |
| 1999 | 2.707 | 18.981 | 273 | 51 | 0.107734410803 |
| 1989 | 2.723 | 18.274 | 266 | 51 | -0.227268328923 |
| 2007 | 2.723 | 19.086 | 272 | 50 | 0.034159068337 |
| 1998 | 2.772 | 19.244 | 258 | 56 | 0.085424821762 |
| 1990 | 2.784 | 18.379 | 273 | 53 | -0.24335326043 |
| 2005 | 2.804 | 19.295 | 272 | 49 | 0.041931671077 |
| 2010 | 2.842 | 18.998 | 249 | 47 | 0.453843999844 |
| 1983 | 2.843 | 18.811 | 263 | 55 | -0.256928852148 |
| 1982 | 2.89 | 18.55 | 246 | 54 | -0.021131648978 |
| 1979 | 2.911 | 18.361 | 256 | 48 | 0.039939779594 |
| 1986 | 2.953 | 18.027 | 261 | 65 | -0.555519016082 |
| 1987 | 3.01 | 18.524 | 258 | 52 | -0.249198161098 |
| 1994 | 3.083 | 18.827 | 243 | 43 | 0.121022082036 |
| 2012 | 3.111 | 19.478 | 266 | 54 | 0.364189469009 |
| 2004 | 3.259 | 19.124 | 252 | 51 | 0.321249578299 |
| 1995 | 3.33 | 18.762 | 269 | 55 | 0.141808383406 |
| 2001 | 3.441 | 18.494 | 271 | 50 | 0.019676876556 |
| 2015 | 3.544 | 18.912 | 275 | 49 | 0.761114979042 |
| 2014 | 3.548 | 20.201 | 263 | 52 | 1.123178246419 |
| 2003 | 3.626 | 18.68 | 268 | 48 | 0.316339890255 |
| 2013 | 3.679 | 19.608 | 274 | 50 | 0.870657698474 |
| 2008 | 3.692 | 18.298 | 247 | 51 | 0.599159414364 |
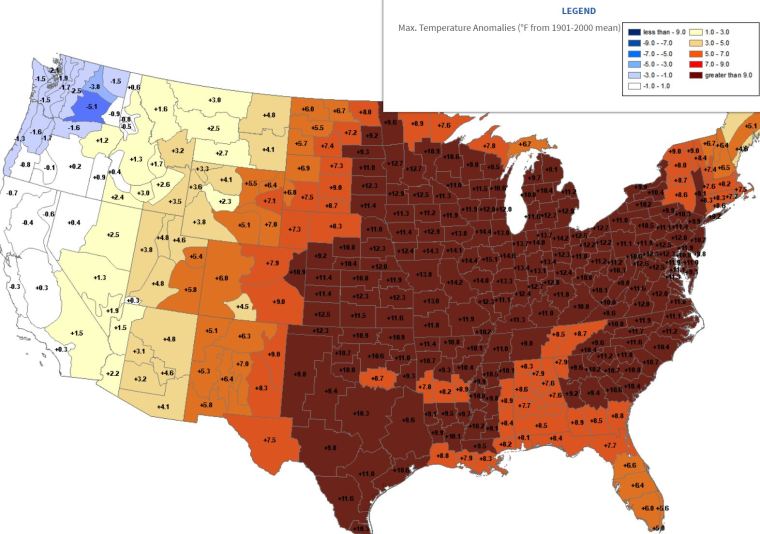
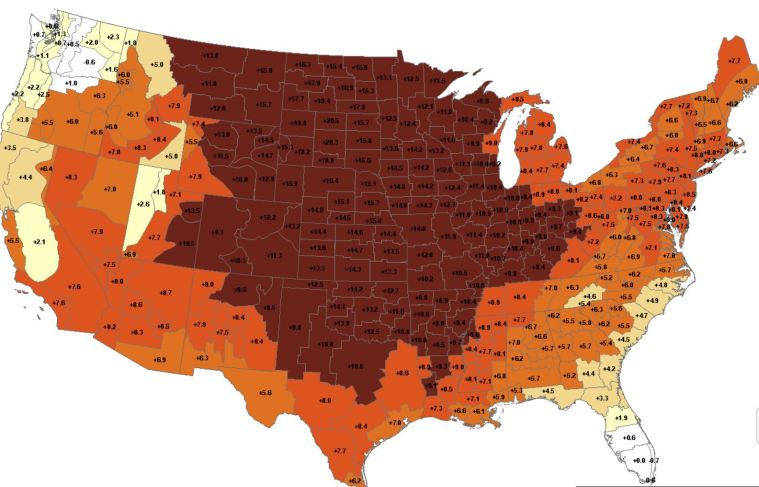
February 2017 was 2nd warmest Tmax. 1954 is still the record holder.

2017 Map of Tmax anomalies
1954 Map of Tmax anomalies
The climate model scam explained by Scott Adams.
Warming did it. Cooling did it.
“The Earth has known several mass extinctions over the course of its history. One of the most important happened at the Permian-Triassic boundary 250 million years ago. Over 95% of marine species disappeared and, up until now, scientists have linked this extinction to a significant rise in Earth temperatures. But researchers have now discovered that this extinction took place during a short ice age which preceded the global climate warming.”