Word of the Day: Sewage Sludge

Ok. Technically Sewage Sludge is a phrase.

The other day I was talking about cofiring. And I discovered that one of the fuels they cofire alongside coal is sewage sludge.

What is sludge?

Up to 95 percent is water. But it starts as wastewater, which is a mix of food, paper, diapers, plant mater, feces, condoms, sanitary napkins, paints, pesticides, bacteria, pathogens, pharmaceuticals, sand, metal particles, road salt, insects and gases.

I think I would prefer 100% coal.


NSIDC: why does the Antarctic sea ice trend resist decline?

One of the stupidest lines ever to come out of the AGW cult

NSIDC news release.

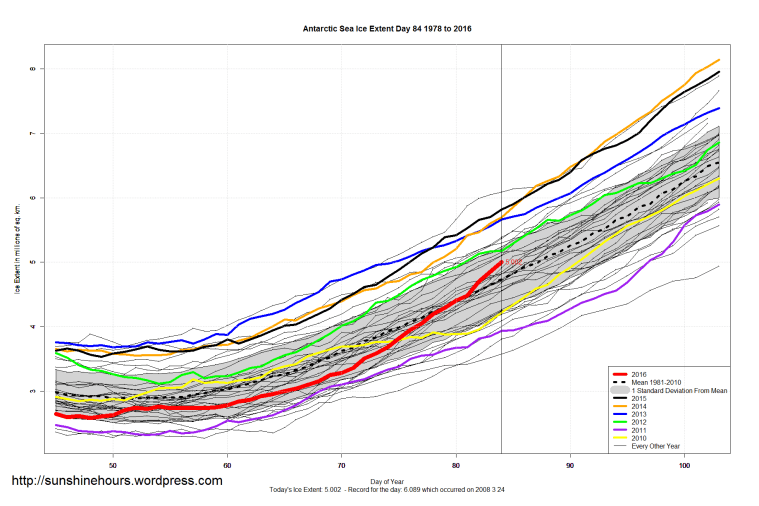
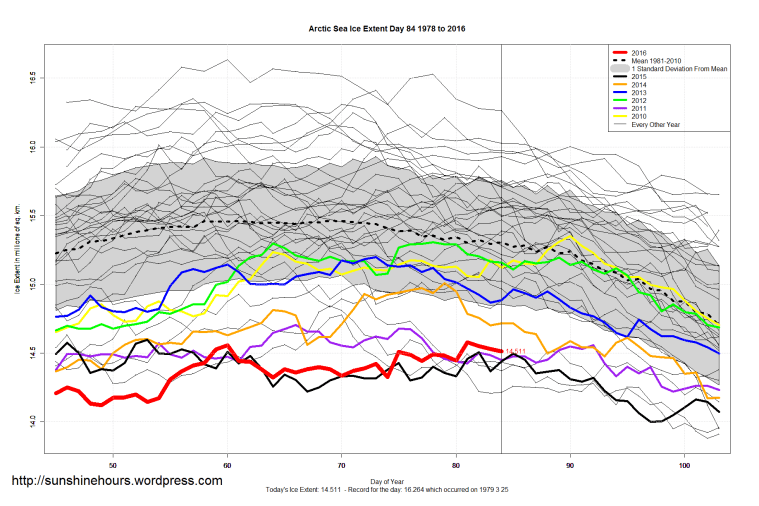
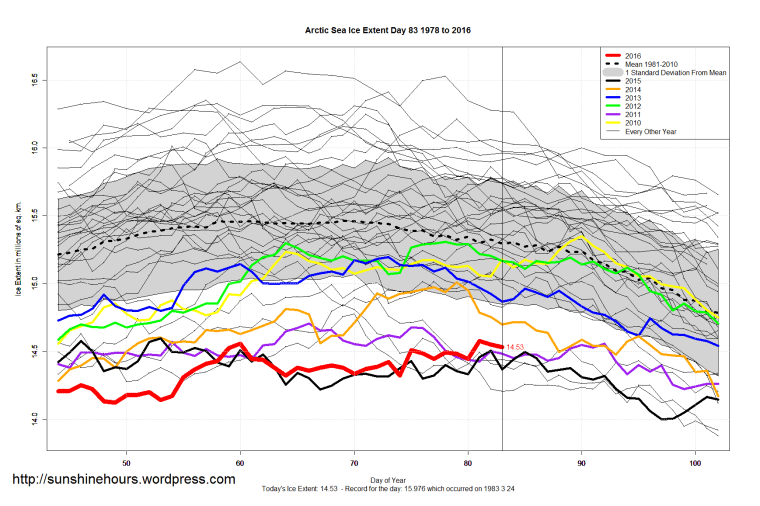
“Antarctic sea ice extent continues to make headlines because it has grown even as much of the globe, and Antarctica itself, is warming. Arctic sea ice, in contrast, is showing a marked decline. Warmer air and ocean waters are bathing both poles, so why does the Antarctic sea ice trend resist decline?

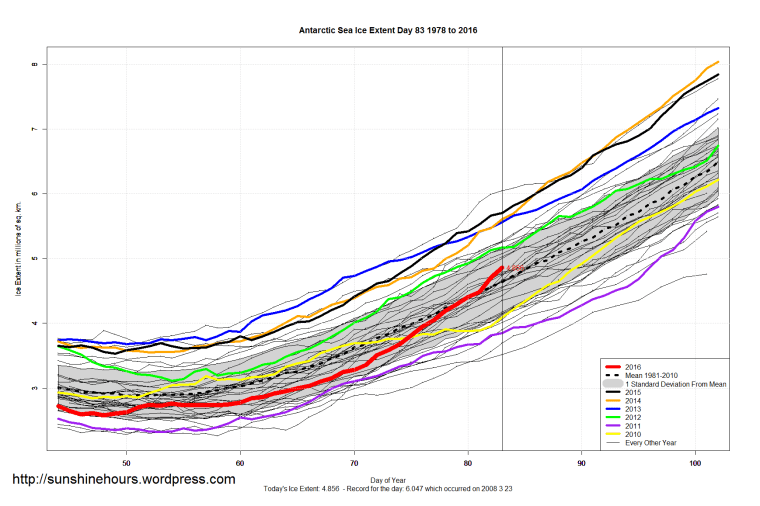
First, Antarctic Sea Ice is NOT resisting decline. Antarctic Sea Ice set records in 2012, 2013 and 2014 for most ice ever. There is no decline! And it is not resisting. It is exuberantly going in the opposite direction!

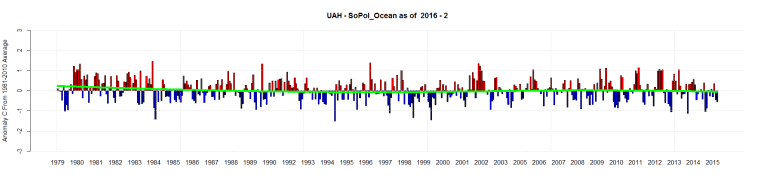
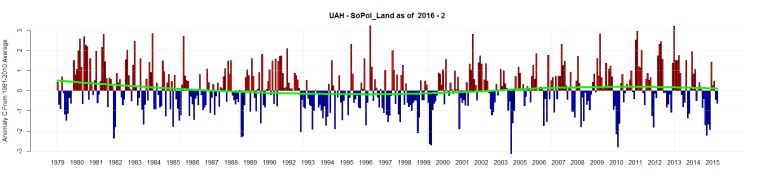
Second, the oceans around Antarctica are not warming. and neither is the actual land according to UAH. Click twice for big versions.

UAH - SoPol_Ocean as of  2016 - 2 UAH - SoPol_Land as of  2016 - 2

They also said:

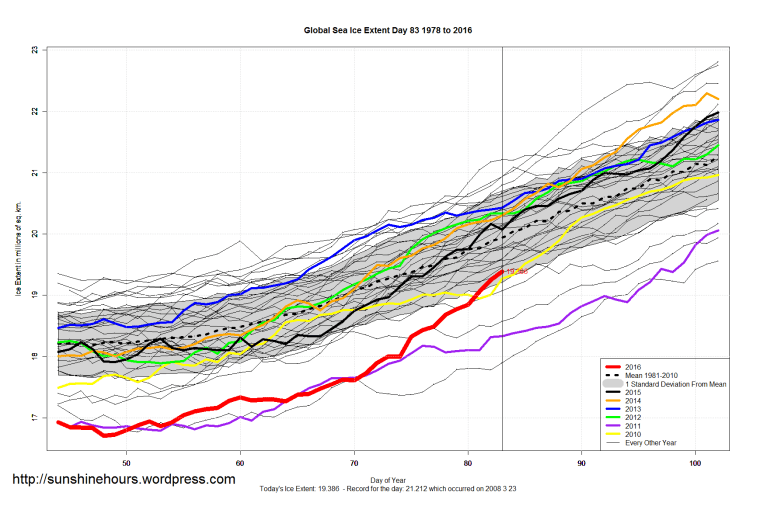
Despite what some might think, high ice extent in Antarctica does not balance out low ice extent in the Arctic.

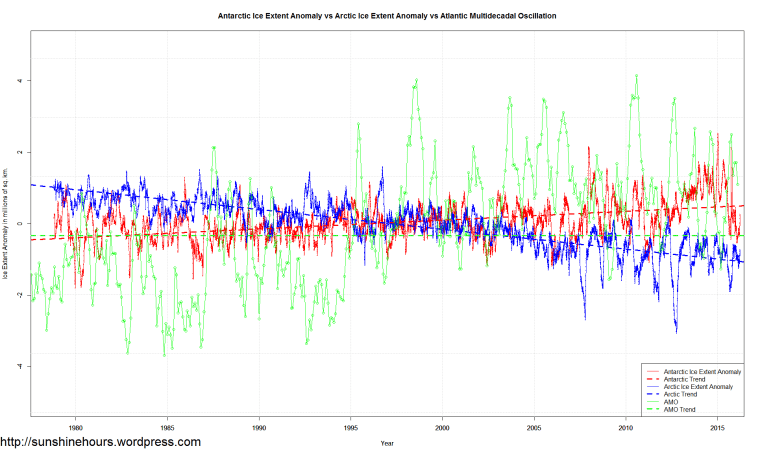
It does if you know what the AMO is.When the AMO is negative arctic ice is high and antarctic low. When the AMO goes positive the opposite occurs.

It is no surprise that the crossover point in the graph below is right when the AMO turned positive (around 1996).

Sea_Ice_Extent_Trends


Sea Ice Extent (Global Antarctic and Arctic) – Day 84 – 2016


Arctic Sea Ice is just bouncing along at the same level its been for 30 days.

Global Sea Ice is well inside the one standard deviation mark.

Antarctic Sea Ice is well above the mean.

Global_Sea_Ice_Extent_Zoomed_2016_Day_84_1981-2010 Antarctic_Sea_Ice_Extent_Zoomed_2016_Day_84_1981-2010 Arctic_Sea_Ice_Extent_Zoomed_2016_Day_84_1981-2010

South / North

Climate Change Makes Better Wine

Good news on the climate front!

The doom and gloom surrounding global warming tends to offer a depressing picture of the future, but there may be a small glimmer of hope.

Scientists have discovered climate change may actually be making wine taste better.

They have found the conditions typically associated with high-quality wines have altered in recent years as temperatures have risen, resulting in consistently better vintages.

http://www.dailymail.co.uk/sciencetech/article-3507836/Is-climate-change-making-wine-taste-BETTER-Rising-temperatures-causing-early-harvests-high-quality-vintages.html

I usually laugh at these stories when they show the opposite. So I’m going to highlight 2 things.

CO2 is never mentioned in the story. Yet its easy to find research showing higher CO2 increases grape yields.

Their “temperature reconstruction” splices 100 years of thermometer data  onto 300 years of tree ring data (which they claim tells you what the temperature and precipitation is).Thats pretty bogus “science”.


German Electricity March 7 2016

Lets say its March 7th 2016 9am in Germany and there is about 70GW of demand to keep the country functioning and you are a greenie looking forward to a day when there is no more nuclear or CO2 producing power plants..

Ooops. 0.03GW from solar. 1.09GW from wind. 10.7GW from nuclear.  51.5GW from CO2 producing power plants (gas, coal, biomass, oil)


Capture_March_7_2016_Germany

Arctic Sea Ice Extent Update – Record Low Maximum?

There have been many online articles predicting Arctic Sea Ice doom in the last week.

My favorite quote is: “Scientists warn that the area covered by this winter’s Arctic sea ice could turn out to be the lowest ever measured.”

Total nonsense. In fact, as of day 83 Arctic Sea Ice extent is higher than it was in 2005, 2006, 2007, 2011 and 2015.

The record that may be set (maybe not since there is still a week or so to go before day 90 which is the latest maximum) is lowest maximum.

The record may be broken by 20,000 sq km. Out of 14,000,000 sq km. 0.14%


And MASIE (a different method) has 2016’s maximum 400,000 sq km HIGHER than 2006. (MASIE only goes back to 2006)

Year Min Max day of Max day of Min
2012 3368882.08 15821891.32 82 264
2008 4223400.12 15661926.25 72 265
2014 5066134.38 15523208.18 73 262
2013 4677324.53 15505010.03 73 260
2010 4716943.6 15,396,877.99 77 266
2009 4871392.35 15,326,130.68 62 254
2011 4302977.96 15,110,021.96 67 257
2016 13095244.88 15,077,599.37 61
2015 4442258.23 14,910,198.98 62 260
2007 3986945.93 14,907,125.15 73 261
2006 5640540.95 14,663,037.37 69 267


NSIDC/NOAA data graph.

Arctic_Sea_Ice_Extent_2016_Day_83_1981-2010

The latest South / North

China’s Smog Clouds May Prevent Global Warming

I’ve posted articles in the past linking the clean air legislation in the west with more sunshine and therefore more warming. Here is a paper arguing the opposite: the lack of clean air in China is cooling the globe.

China is responsible for just 10 per cent of man-made global warming, despite emitting more than one quarter of the world’s greenhouse gases, a new study claims.

The study found sulphate and nitrate aerosols emitted by burning fossil fuels had a cooling effect that offset much of the warming caused by greenhouse gas emissions of carbon dioxide, methane and black carbon.

As a result, while China’s consumption of fossil fuels and its carbon emissions had increased significantly over the past decades, a corresponding increase in aerosol emissions meant its contribution to man-made climate change had remained largely unchanged since the pre-industrial period.

The study was led by Professor Li Bengang at Peking University and published in Nature.

http://www.scmp.com/news/china/policies-politics/article/1929306/chinas-smog-clouds-have-silver-lining-they-may-help

Sea Ice Extent (Global Antarctic and Arctic) – Day 83 – 2016

Arctic Sea Ice is just bouncing along at the same level its been for 10 days. The latest maximum was day 90.

Global Sea Ice is now inside the one standard deviation mark.

Antarctic Sea Ice is above the mean.

Global_Sea_Ice_Extent_Zoomed_2016_Day_83_1981-2010 Antarctic_Sea_Ice_Extent_Zoomed_2016_Day_83_1981-2010 Arctic_Sea_Ice_Extent_Zoomed_2016_Day_83_1981-2010

South / North