Methane Increase Caused By Agriculture and Not Fracking

“A new study published today in the journal Science shows that fossil fuels are not the cause of increasing levels of methane in the atmosphere, but rather from agriculture. The study, conducted by National Institute of Water and Atmospheric Research (NIWA) and led by Hinrich Schaefer, concludes that since 2007, the most likely cause of increased atmospheric methane comes from agricultural practices, and not from fracking or fossil fuel production.”

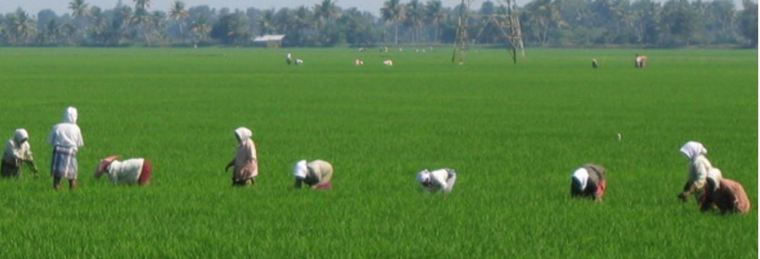
According to Schaefer, the NIWA team found they could distinguish three types of methane emissions. “One is the burning of organic material, such as forest fires,” he said. “Another is fossil fuel production – the same processes that form natural oil and gas – and the third is formed by microbes which come from a variety of sources such as wetlands, rice paddies and livestock.”

The team found that the “source of the increase was methane produced by bacteria, of which the most likely sources are natural, such as wetlands or agricultural, for example from rice paddies or livestock.” They were surprised to discover that fossil fuel production was not the source of the increased methane and ruled it out. They call the post-2006 rise in methane primarily microorganisms (biogenic), were coming from outside the Arctic, and were “more consistent with agriculture than wetlands.”

http://www.examiner.com/article/study-increased-methane-levels-from-agriculture-not-fossil-fuel-production

Capture


MASIE Records as of Day 67 – 2016

MASIE and NSIDC are two different sea ice indexes. The difference between the two methodologies is here.

Ron Clutz reminded me that MASIE’s records are different than NSIDC.  (MASIE data is only back to 2006)

The only record 2016 holds (so far) is earliest maximum. 2016 has the 4th lowest maximum behind 2006, 2007 and 2015.

MASIE records:

Lowest Minimum 3368882.08 2012
Highest Minimum 5640540.95 2006
Lowest day of Minimum 254 2009
Highest day of Minimum 267 2006
Lowest Maximum 14663037.37 2006
Highest Maximum 15821891.32 2012
Lowest day of Maximum 61 2016
Highest day of Maximum 82 2012

Year Min Max day of Max day of Min
2006 5640540.95 14663037.37 69 267
2007 3986945.93 14907125.15 73 261
2008 4223400.12 15661926.25 72 265
2009 4871392.35 15326130.68 62 254
2010 4716943.6 15396877.99 77 266
2011 4302977.96 15110021.96 67 257
2012 3368882.08 15821891.32 82 264
2013 4677324.53 15505010.03 73 260
2014 5066134.38 15523208.18 73 262
2015 4442258.23 14910198.98 62 260
2016 15077599.37 61

Sea Ice Extent (Global Antarctic and Arctic) – Day 64 – 2016

It appears the Arctic set a new record for lowest maximum on day 60. 38,000 sq km lower than 2015.

(However it is possible that could change)

Global_Sea_Ice_Extent_Zoomed_2016_Day_64_1981-2010 Antarctic_Sea_Ice_Extent_Zoomed_2016_Day_64_1981-2010 Arctic_Sea_Ice_Extent_Zoomed_2016_Day_64_1981-2010

South / North